
datasette-cluster-map


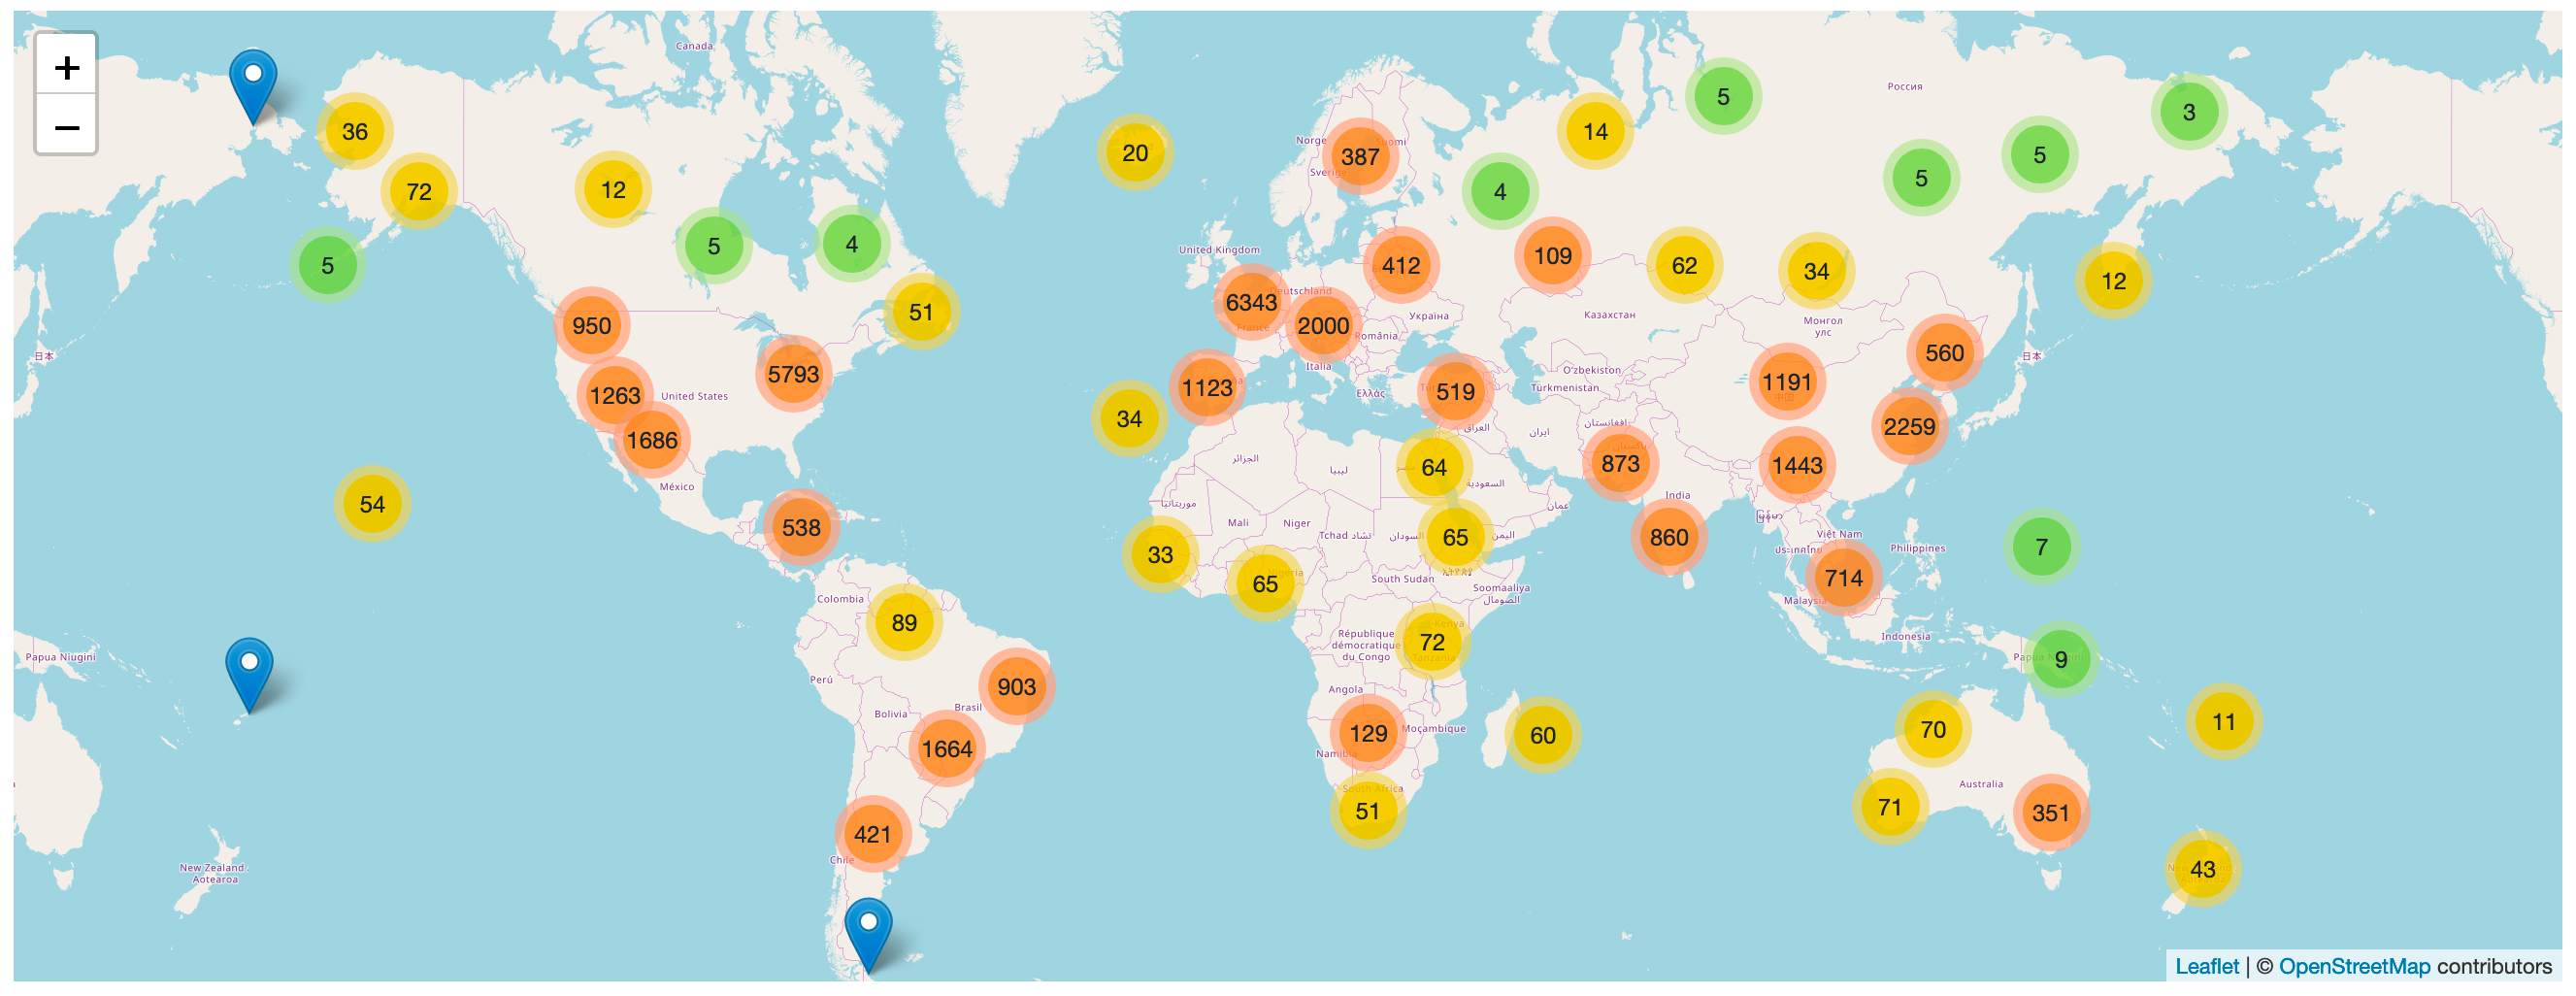
A Datasette plugin that detects tables with latitude and longitude columns and then plots them on a map using Leaflet.markercluster.
More about this project: Datasette plugins, and building a clustered map visualization.
Demo
datasette.io/global-power-plants/global-power-plants hosts a demo of this plugin running against a database of 33,000 power plants around the world.
Installation
Run datasette install datasette-cluster-map to add this plugin to your Datasette virtual environment. Datasette will automatically load the plugin if it is installed in this way.
If you are deploying using the datasette publish command you can use the --install option:
datasette publish cloudrun mydb.db --install=datasette-cluster-map
If any of your tables have one of the following pairs of columns a map will be automatically displayed:
latitudeandlongitudelatandlnglatandlonlatandlong*_latitudeand*_longitude*_latand*_lngfor any of the three variants oflng
The map is added to the page once the first row with a valid latitude and longitude has loaded. If none of the rows have a location, no map is shown.
Configuration
If your columns are called something else you can configure the column names using plugin configuration in a metadata.json file. For example, if all of your columns are called xlat and xlng you can create a metadata.json file like this:
{
    "title": "Regular metadata keys can go here too",
    "plugins": {
        "datasette-cluster-map": {
            "latitude_column": "xlat",
            "longitude_column": "xlng"
        }
    }
}
Then run Datasette like this:
datasette mydata.db -m metadata.json
This will configure the required column names for every database loaded by that Datasette instance.
If you want to customize the column names for just one table in one database, you can do something like this:
{
    "databases": {
        "polar-bears": {
            "tables": {
                "USGS_WC_eartag_deployments_2009-2011": {
                    "plugins": {
                        "datasette-cluster-map": {
                            "latitude_column": "Capture Latitude",
                            "longitude_column": "Capture Longitude"
                        }
                    }
                }
            }
        }
    }
}
You can also use a custom SQL query to rename those columns to latitude and longitude, for example:
select *,
    "Capture Latitude" as latitude,
    "Capture Longitude" as longitude
from [USGS_WC_eartag_deployments_2009-2011]
The map defaults to being displayed above the main results table on the page. You can use the "container" plugin setting to provide a CSS selector indicating an element that the map should be appended to instead.
Custom tile layers
You can customize the tile layer used by the maps using the tile_layer and tile_layer_options configuration settings. For example, to use the OpenTopoMap you can use these settings:
{
"plugins": {
"datasette-cluster-map": {
"tile_layer": "https://{s}.tile.opentopomap.org/{z}/{x}/{y}.png",
"tile_layer_options": {
"attribution": "Map data: © <a href='https://www.openstreetmap.org/copyright'>OpenStreetMap</a> contributors, <a href='http://viewfinderpanoramas.org'>SRTM</a> | Map style: © <a href='https://opentopomap.org'>OpenTopoMap</a> (<a href='https://creativecommons.org/licenses/by-sa/3.0/'>CC-BY-SA</a>)",
"maxZoom": 17
}
}
}
}
If your tile server provides retina tiles, add "detectRetina": true to tile_layer_options to enable them.
The Leaflet Providers preview list has details of many other tile layers you can use.
Tile layers and the Referer header
The default OpenStreetMap tile server requires requests to include a Referer header. Tile requests send the origin of your Datasette instance, such as https://example.com/, but never the URL of the page showing the map. This applies to custom tile layers too.
This is handled by datasette-leaflet: see Tile layers and the Referer header in its documentation for how to change or disable it.
Custom marker popups
The marker popup defaults to displaying the data for the underlying database row.
You can customize this by including a popup column in your results containing JSON that defines a more useful popup.
The JSON in the popup column should look something like this:
{
    "image": "https://niche-museums.imgix.net/dodgems.heic?w=800&h=400&fit=crop",
    "alt": "Dingles Fairground Heritage Centre",
    "title": "Dingles Fairground Heritage Centre",
    "description": "Home of the National Fairground Collection, Dingles has over 45,000 indoor square feet of vintage fairground rides... and you can go on them! Highlights include the last complete surviving and opera",
    "link": "/browse/museums/26"
}
Each of these columns is optional.
titleis the title to show at the top of the popupimageis the URL to an image to display in the popupaltis the alt attribute to use for that imagedescriptionis a longer string of text to use as a descriptionlinkis a URL that the marker content should link to
You can use the SQLite json_object() function to construct this data dynamically as part of your SQL query. Here's an example:
select json_object(
  'image', photo_url || '?w=800&h=400&fit=crop',
  'title', name,
  'description', substr(description, 0, 200),
  'link', '/browse/museums/' || id
  ) as popup,
  latitude, longitude from museums
where id in (26, 27) order by id
Try that example here or take a look at this demo built using a SQL view.
Development
To set up this plugin locally, first checkout the code. Then run the tests using uv:
cd datasette-cluster-map
uv run pytest
Some of the tests use Playwright to drive a real browser. If they fail because the browser is missing, install it like this:
uv run playwright install chromium
1 maintainer

Metadata
1 maintainer
Release files for datasette-cluster-map 0.19
For a detailed explanation of source distributions (sdists) and built distributions (wheels), please see the package formats documentation.
Source distribution (sdist)
| File | Size | Uploaded | Provenance | Actions |
|---|---|---|---|---|
| datasette_cluster_map-0.19.tar.gz | 33.4 kB | With provenance | Details for datasette_cluster_map-0.19.tar.gz |
Built distribution (wheel)
| File | Interpreter | ABI | Platform | Actions Reset |
|---|---|---|---|---|
| datasette_cluster_map-0.19-py3-none-any.whl | Python 3 | none | any | Details for datasette_cluster_map-0.19-py3-none-any.whl |
Total release size: 65.1 kB
Release files / datasette_cluster_map-0.19.tar.gz
| Download URL | datasette_cluster_map-0.19.tar.gz |
|---|---|
| Size | 33.4 kB |
| Tags | Source |
|
SHA-256 checksum How to use checksums |
0e54158564d314782c371dc2095189c825933cc357b7ba737f044d80f8e91fdf
|
|
BLAKE2b-256 checksum How to use checksums |
2813e6cc65d249a1f0f25342db1bda8899066664d38066c90254f1375ca4e11b
|
| Upload date | |
|
Uploaded using Trusted Publishing? What is trusted publishing? |
Yes |
| Uploaded via |
twine/7.0.0 CPython/3.13.16
|
Provenance
Provenance describes where a file came from. On PyPI, provenance is shared via attestations, which provide a verifiable record of the build or publishing details. View details, limitations and caveats.


PyPI Publish Attestation
PyPI verified that this artifact, at this checksum, originated from the publisher listed below.
Signed by GitHub Actions, verified by PyPI on Nov 13, 2026.
Transparency logRelease files / datasette_cluster_map-0.19-py3-none-any.whl
| Download URL | datasette_cluster_map-0.19-py3-none-any.whl |
|---|---|
| Size | 31.7 kB |
| Tags | Python 3 |
|
SHA-256 checksum How to use checksums |
e70ce208322b176f6b28126ff19bb7f551c5834176fa8a4c4390fc3e71a4d379
|
|
BLAKE2b-256 checksum How to use checksums |
3deb56e17318486f9b45051414ae014f93279695a93ac40752273ac3fb035b20
|
| Upload date | |
|
Uploaded using Trusted Publishing? What is trusted publishing? |
Yes |
| Uploaded via |
twine/7.0.0 CPython/3.13.16
|
Provenance
Provenance describes where a file came from. On PyPI, provenance is shared via attestations, which provide a verifiable record of the build or publishing details. View details, limitations and caveats.
PyPI Publish Attestation
PyPI verified that this artifact, at this checksum, originated from the publisher listed below.
Signed by GitHub Actions, verified by PyPI on Nov 13, 2026.
Transparency logSecurity for datasette-cluster-map 0.19
Provenance
Provenance describes where a file came from. On PyPI, provenance is shared via attestations, which provide a verifiable record of the build or publishing details. View details, limitations and caveats.
Full provenance
Both files in this release have been uploaded with provenance metadata.
Attestation for datasette_cluster_map-0.19.tar.gz
PyPI Publish Attestation
PyPI verified that this artifact, at this checksum, originated from the publisher listed below.
Signed by GitHub Actions, verified by PyPI on Nov 13, 2026.
Transparency logA note on package security
PyPI is a repository for distributing packages, not a service for auditing them. While third-party security researchers and our staff do their best to detect and remove malicious packages, PyPI cannot guarantee the quality, security or suitability of any given package.
To learn more about protecting yourself from malicious actors, visit our package security documentation.














