Datasette plugin to create interactive data dashboards
Verified details
These details have been verified by PyPIProject links
GitHub Statistics
Maintainers

Project description
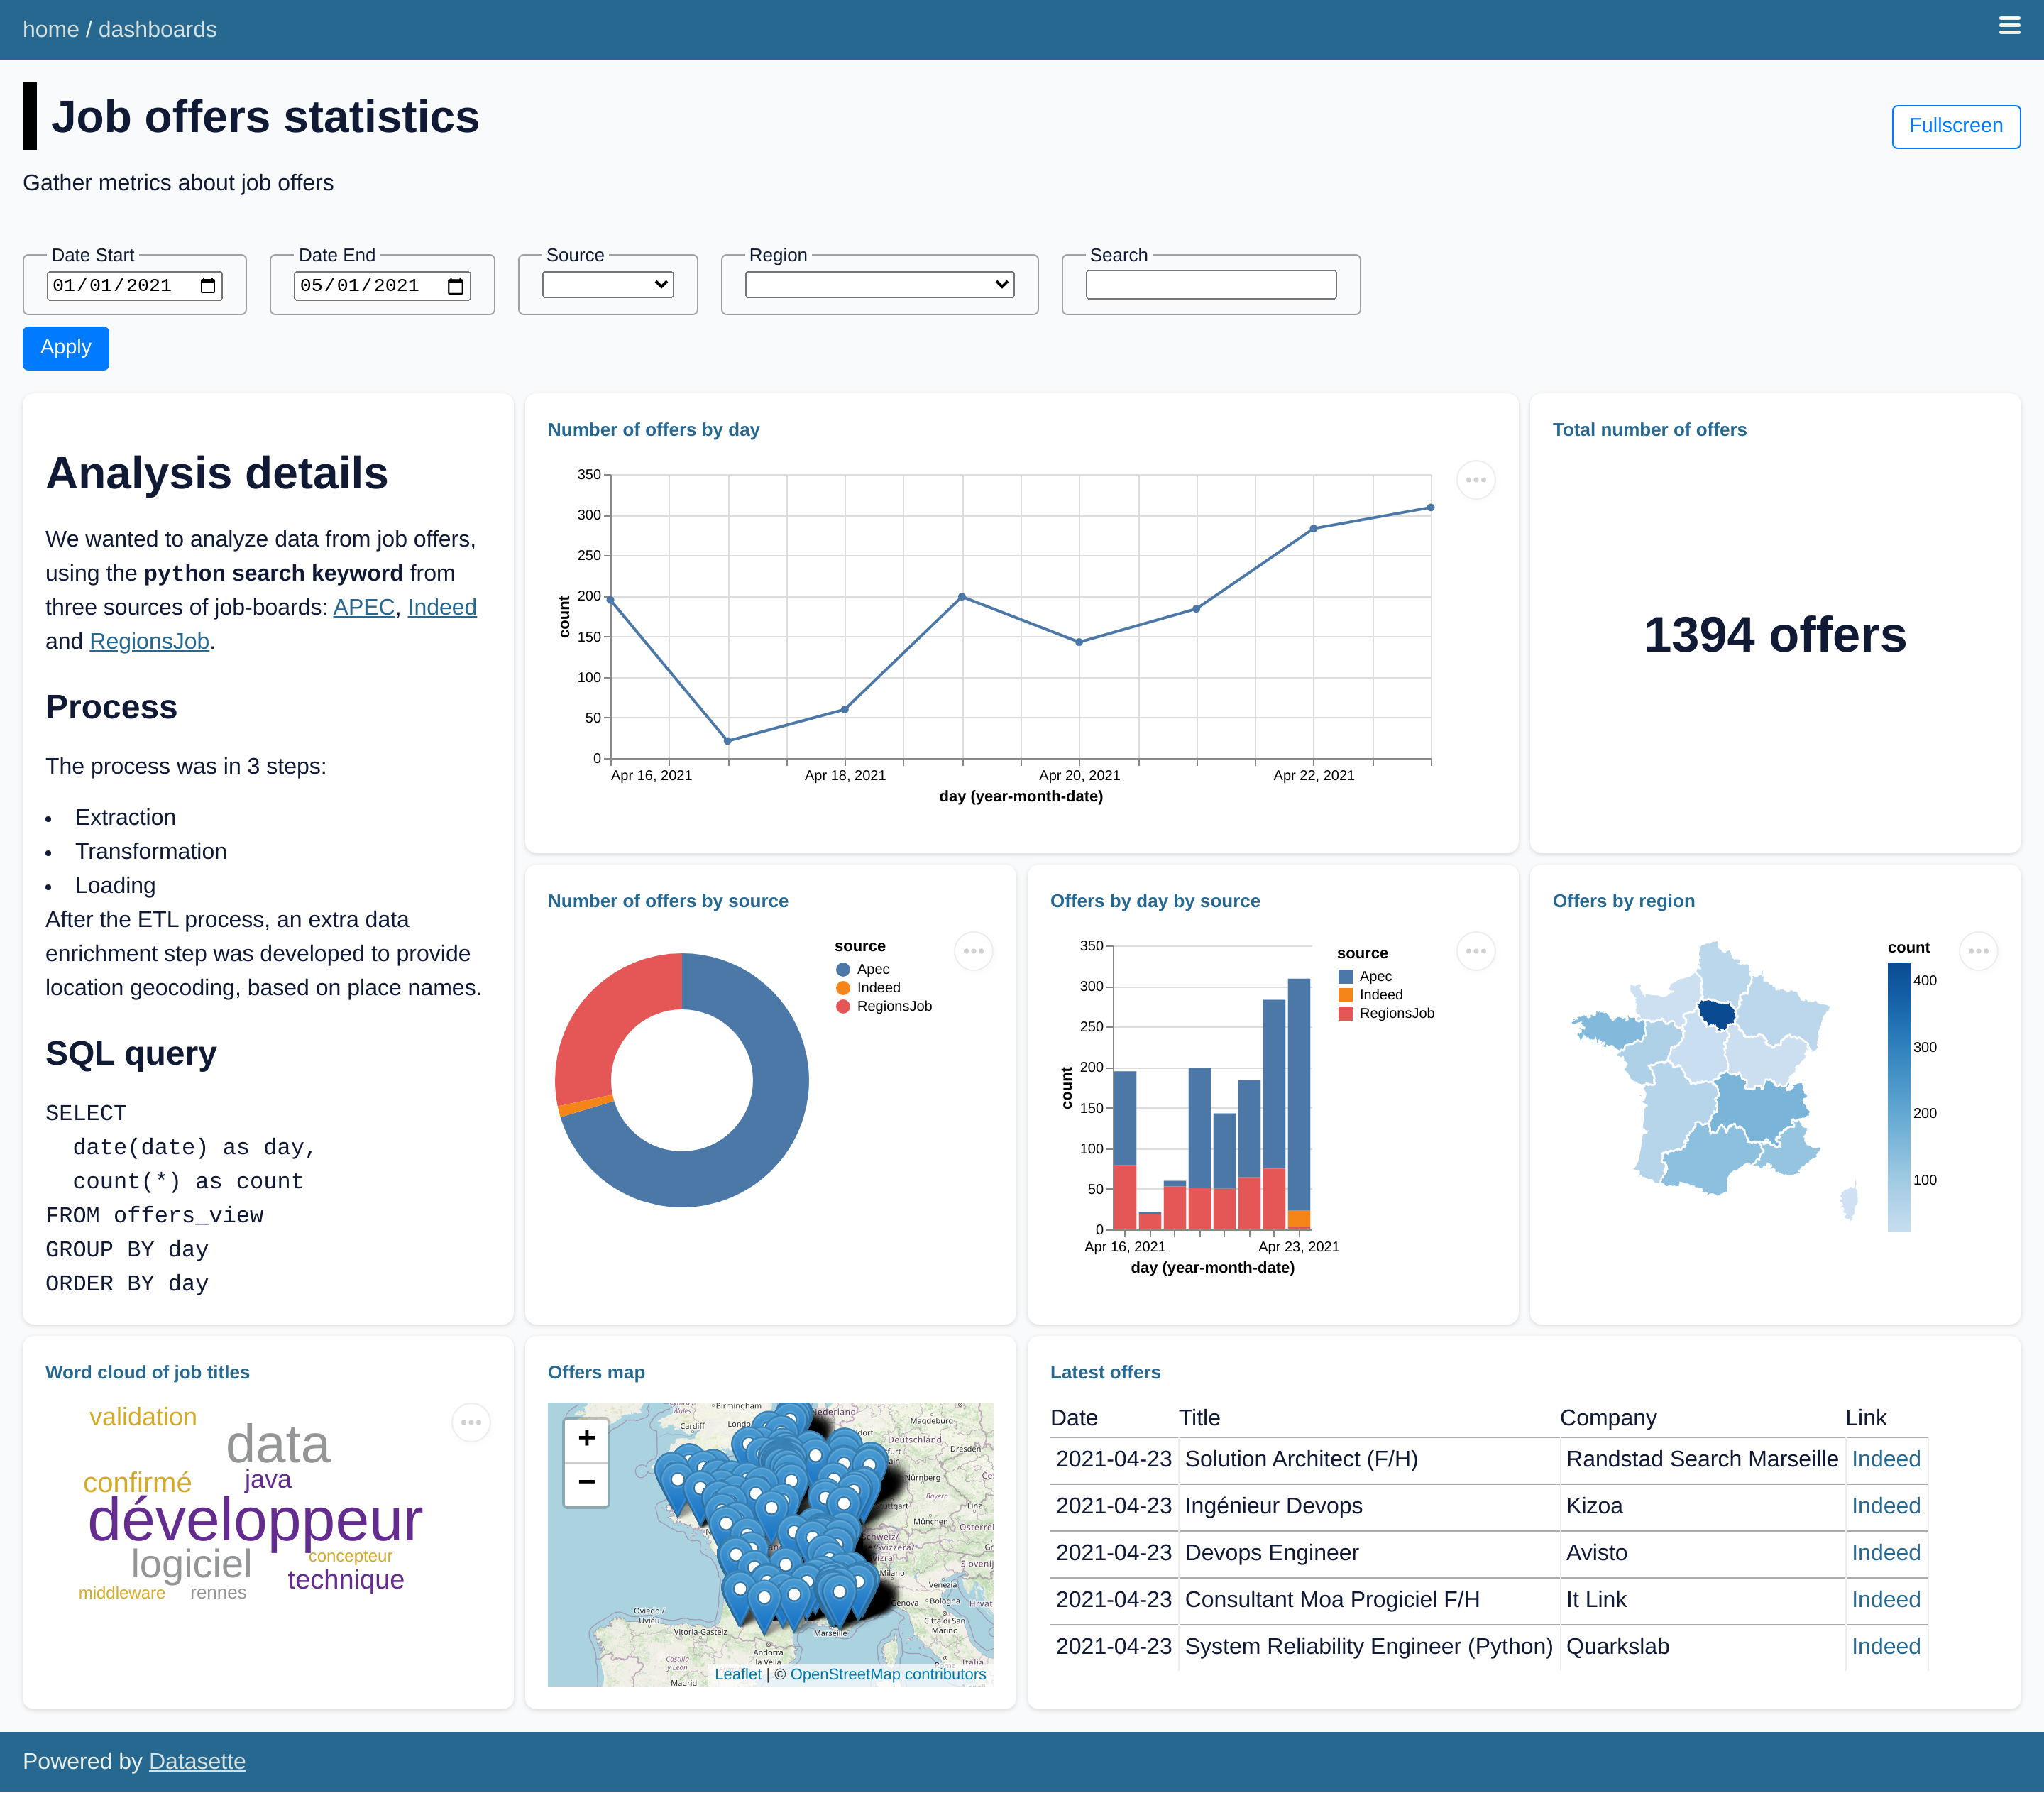
datasette-dashboards
Datasette plugin to create interactive data dashboards


Try out a live demo at https://datasette-dashboards-demo.vercel.app
WARNING: this plugin is still experimental and not ready for production. Some breaking changes might happen between releases before reaching a stable version. Use it at your own risks!
Installation
Install this plugin in the same environment as Datasette:
$ datasette install datasette-dashboards
Usage
Define dashboards within metadata.yml / metadata.json:
plugins:
  datasette-dashboards:
    my-dashboard:
      title: My Dashboard
      description: Showing some nice metrics
      layout:
        - [analysis-note, events-count]
        - [analysis-note, events-source]
      filters:
        date_start:
          name: Date Start
          type: date
          default: "2021-01-01"
        date_end:
          name: Date End
          type: date
        category:
          name: My Category
          type: select
          options: [Option 1, Option 2, Option 3]
        dynamic_category:
          name: My Dynamic Category
          type: select
          db: jobs
          query: SELECT DISTINCT col1 FROM mytable ORDER BY col1 ASC
        dependent_filter:
          name: My Dependent Filter
          type: select
          db: jobs
          query: SELECT DISTINCT col2 FROM mytable WHERE col2 IS NOT NULL [[ AND col1 = :dynamic_category ]] ORDER BY col2 ASC
      charts:
        analysis-note:
          library: markdown
          settings:
            extensions:
              - attr_list
            extra_attrs:
              h1:
                - name
          display: |-
            # Analysis notes {: name="notes" }
            > A quick rundown of events statistics and KPIs

        events-count:
          title: Total number of events
          db: jobs
          query: SELECT count(*) as count FROM events
          library: metric
          display:
            field: count
            prefix:
            suffix:

        events-source:
          title: Number of events by source
          db: jobs
          query: SELECT source, count(*) as count FROM events WHERE TRUE [[ AND date >= date(:date_start) ]] [[ AND date <= date(:date_end) ]] GROUP BY source ORDER BY count DESC
          library: vega-lite
          display:
            mark: { type: arc, tooltip: true }
            encoding:
              color: { field: source, type: nominal }
              theta: { field: count, type: quantitative }
A new menu entry is now available, pointing at /-/dashboards to access all defined dashboards.
Properties
Dashboard properties:
| Property | Type | Description |
|---|---|---|
title |
string |
Dashboard title |
description |
string |
Dashboard description |
settings |
object |
Dashboard settings |
layout |
array |
Dashboard layout |
filters |
object |
Dashboard filters |
Dashboard settings:
| Property | Type | Description |
|---|---|---|
allow_fullscreen |
bool |
Allow dashboard to be toggled in fullscreen (default false) |
autorefresh |
number |
Auto-refresh timeout in minutes |
Dashboard filters:
| Property | Type | Description |
|---|---|---|
name |
string |
Filter display name |
type |
string |
Filter type (text, date, number, select) |
default |
string, number |
(optional) Filter default value |
min |
number |
(optional) Filter minimum value |
max |
number |
(optional) Filter maximum value |
step |
number |
(optional) Filter stepping value |
options |
list |
(optional) Select filter options list |
db |
string |
(optional) Dynamic select filter database |
query |
string |
(optional) Dynamic select filter query |
Common chart properties for all chart types:
| Property | Type | Description |
|---|---|---|
title |
string |
Chart title |
db |
string |
Database name against which to run the query |
query |
string |
SQL query to run and extract data from |
library |
string |
One of supported libraries: vega, vega-lite, markdown, metric, table, map |
display |
object |
Chart display specification (depend on the used library) |
To define SQL queries using dashboard filters:
SELECT * FROM mytable [[ WHERE col >= :my_filter ]]
SELECT * FROM mytable WHERE TRUE [[ AND col1 = :my_filter_1 ]] [[ AND col2 = :my_filter_2 ]]
Important notes:
- When a
selectfilter has more than 100 options, the dropdown list will be automatically converted to a text filter with autocompletion
Vega properties
Available configuration for vega charts:
| Property | Type | Description |
|---|---|---|
library |
string |
Must be set to vega |
display |
object |
Vega specification object |
Notes about the display property:
- Requires a valid Vega specification object
- Some fields are pre-defined:
$schema,description,autosize,data,signals - All fields are passed along as-is (overriding pre-defined fields if any)
- Only
markandencodingfields are required as the bare-minimum
Vega-Lite properties
Available configuration for vega-lite charts:
| Property | Type | Description |
|---|---|---|
library |
string |
Must be set to vega-lite |
display |
object |
Vega specification object |
Notes about the display property:
- Requires a valid Vega-Lite specification object
- Some fields are pre-defined:
$schema,description,width,view,config,data - All fields are passed along as-is (overriding pre-defined fields if any)
- Only
markandencodingfields are required as the bare-minimum
Markdown properties
Available configuration for markdown chart:
| Property | Type | Description |
|---|---|---|
library |
string |
Must be set to markdown |
display |
string |
Multi-line string containing the Markdown content |
settings |
object |
Markdown settings (see below) |
Note :
- Some common properties do not apply and can be omitted:
title,db,query - Markdown rendering is done by
datasette-render-markdown - To configure Markdown rendering, use the
settingsproperty.
Markdown settings
Available configuration for Markdown rendering:
| Property | Type | Description |
|---|---|---|
extensions |
array |
List of extension entry points to enable |
extra_tags |
array |
List of extra tags to allow |
extra_attrs |
object |
Mapping of tags to extra attributes allowed for them |
Note :
- These arguments are passed to the
render_markdown()function. - The
extra_tagsandextra_attrsare passed to Bleach.extra_attrsis indeed required to be given as a dict.
Metric properties
Available configuration for metric chart:
| Property | Type | Description |
|---|---|---|
library |
string |
Must be set to metric |
display.field |
string |
Numerical field to be displayed as metric |
display.prefix |
string |
Prefix to be displayed before metric |
display.suffix |
string |
Prefix to be displayed after metric |
Note:
- The
display.fieldmust reference a single-numerical value from the SQL query (e.g. numericalnumberfield inSELECT count(*) as number FROM events)
Table properties
There is no required configured in display, so you can either ignored or
leave it empty for table charts.
Some advice for a nice table chart:
- Set proper column names in the
SELECTclause - Limit the number of columns in the
SELECTclause - Limit the number of rows with the
LIMITclause - Order the rows explicitely with the
ORDER BYclause - Use SQLite string concatenation operator (
||) to format column data (for instance to include HTML markup!)
Map properties
Available configuration for map chart:
| Property | Type | Description |
|---|---|---|
library |
string |
Must be set to map |
display.latitude_column |
string |
Name of the latitude column (default: latitude) |
display.longitude_column |
string |
Name of the latitude column (default: longitude) |
display.show_latlng_popup |
boolean |
Whether or not to display latitude and longitude values in popup (default: false) |
Warning: do not try to load more than a thousand rows for a map at the risk of
slugginess and being unreadable. Make sensible use of the LIMIT clause to reduce
the number of items to display on the map.
Dashboard layout
The default dashboard layout will present two charts per row (one per row on mobile).
To make use of custom dashboard layout using CSS Grid Layout,
define the layout array property as a grid / matrix:
- Each entry represents a row of charts
- Each column is referring a chart by its property name
- An empty slot in the grid can be specified using the
.(full stop) placeholder
WARNINGS:
- All rows must specify the same number of columns
- All charts must be placed somewhere on the custom layout
Here is a simple 2x3 grid example with 4 different charts:
layout:
  - [chart1, chart2, chart3]
  - [chart1, chart4, chart4]
Here is a more subtle example involving an empty spot at the end of the second row:
layout:
  - [chart1, chart2, chart3]
  - [chart1, chart4, .]
Embedding dashboards and charts
Dashboards can be embedded within an HTML page using an iframe element:
<iframe
  src="/-/dashboards/my-dashboard/embed?start_date=2023-01-01&end_date=2023-12-31"
  frameborder="0"
  width="100%"
  height="600"
  allowtransparency
>
</iframe>
Same goes for charts:
<iframe
  src="/-/dashboards/my-dashboard/my-chart/embed?start_date=2023-01-01&end_date=2023-12-31"
  frameborder="0"
  width="100%"
  height="600"
  allowtransparency
>
</iframe>
Development
To set up this plugin locally, first checkout the code. Then create a new virtual environment and the required dependencies:
uv sync
To run the QA suite:
uv run ruff check datasette_dashboards tests
uv run mypy --strict datasette_dashboards tests
uv run pytest -v --cov=datasette_dashboards --cov=tests --cov-branch --cov-report=term-missing tests
Updating JS dependencies
External JS dependencies are tracked and bundled using NPM and package.json (package-lock.json is not needed here):
npm install --no-package-lock
Demo
With the developmnent environment setup, you can run the demo locally:
uv run datasette \
  --metadata demo/metadata.yml \
  --template-dir demo/templates \
  demo/jobs.db
License
Licensed under Apache License, Version 2.0
Copyright (c) 2021 - present Romain Clement
Project details
Verified details
These details have been verified by PyPIProject links
GitHub Statistics
Maintainers
Release history Release notifications | RSS feed


Download files
Download the file for your platform. If you're not sure which to choose, learn more about installing packages.
Source Distribution
Built Distribution
Filter files by name, interpreter, ABI, and platform.
If you're not sure about the file name format, learn more about wheel file names.
Copy a direct link to the current filters
File details
Details for the file datasette_dashboards-0.8.0.tar.gz.
File metadata
- Download URL: datasette_dashboards-0.8.0.tar.gz
- Upload date:
- Size: 292.8 kB
- Tags: Source
- Uploaded using Trusted Publishing? Yes
- Uploaded via: twine/6.1.0 CPython/3.13.7
File hashes
| Algorithm | Hash digest | |
|---|---|---|
| SHA256 |
5da852457203a3553b52cde36ad228af63de8f68f7a3e6556d3532a5d916cfff
|
|
| MD5 |
ed6d6f5a6c0e53e88ce8dddd59a6754d
|
|
| BLAKE2b-256 |
93acd56618c168404df71ff151ebfab4455d17f4d45b3cacceb3c86d94cea123
|
Provenance
The following attestation bundles were made for datasette_dashboards-0.8.0.tar.gz:
Publisher:
ci-cd.yml on rclement/datasette-dashboards
-
Statement:
-
Statement type:
https://in-toto.io/Statement/v1 -
Predicate type:
https://docs.pypi.org/attestations/publish/v1 -
Subject name:
datasette_dashboards-0.8.0.tar.gz -
Subject digest:
5da852457203a3553b52cde36ad228af63de8f68f7a3e6556d3532a5d916cfff - Sigstore transparency entry: 707900466
- Sigstore integration time:
-
Permalink:
rclement/datasette-dashboards@89645392dccf12042c365b1a9d3bbf8f32a23b16 -
Branch / Tag:
refs/tags/0.8.0 - Owner: https://github.com/rclement
-
Access:
public
-
Token Issuer:
https://token.actions.githubusercontent.com -
Runner Environment:
github-hosted -
Publication workflow:
ci-cd.yml@89645392dccf12042c365b1a9d3bbf8f32a23b16 -
Trigger Event:
push
-
Statement type:
File details
Details for the file datasette_dashboards-0.8.0-py3-none-any.whl.
File metadata
- Download URL: datasette_dashboards-0.8.0-py3-none-any.whl
- Upload date:
- Size: 296.6 kB
- Tags: Python 3
- Uploaded using Trusted Publishing? Yes
- Uploaded via: twine/6.1.0 CPython/3.13.7
File hashes
| Algorithm | Hash digest | |
|---|---|---|
| SHA256 |
246fe716da3168a10985989febc4c10cd18d3f5d9721f0c0446eee5fa8e34ada
|
|
| MD5 |
356a59fd7c0b4ad09c51fe6d2c64a484
|
|
| BLAKE2b-256 |
37abcaf44d5dce374b7812027bcdf235d8c5e33ecc8e00a297c83b46634cfa01
|
Provenance
The following attestation bundles were made for datasette_dashboards-0.8.0-py3-none-any.whl:
Publisher:
ci-cd.yml on rclement/datasette-dashboards
-
Statement:
-
Statement type:
https://in-toto.io/Statement/v1 -
Predicate type:
https://docs.pypi.org/attestations/publish/v1 -
Subject name:
datasette_dashboards-0.8.0-py3-none-any.whl -
Subject digest:
246fe716da3168a10985989febc4c10cd18d3f5d9721f0c0446eee5fa8e34ada - Sigstore transparency entry: 707900469
- Sigstore integration time:
-
Permalink:
rclement/datasette-dashboards@89645392dccf12042c365b1a9d3bbf8f32a23b16 -
Branch / Tag:
refs/tags/0.8.0 - Owner: https://github.com/rclement
-
Access:
public
-
Token Issuer:
https://token.actions.githubusercontent.com -
Runner Environment:
github-hosted -
Publication workflow:
ci-cd.yml@89645392dccf12042c365b1a9d3bbf8f32a23b16 -
Trigger Event:
push
-
Statement type:


