
This release is a pre-release and may not be stable for production use.
datasette-otel-otlp-exporter
Send Datasette's builtin OpenTelemetry traces to any OTLP backend: Jaeger, Grafana Cloud, Honeycomb, an OpenTelemetry Collector, and so on.
Datasette records a span for every request and SQL query, but it doesn't send them anywhere on its own. datasette-otel-otlp-exporter sends them over OTLP/HTTP, the protocol nearly every tracing backend accepts, so you can see where a slow page spends its time, down to individual SQL queries. You configure it with a single plugin setting; there's no opentelemetry-instrument wrapper to run.
Installing
This plugin requires Datasette 1.0a41 or higher.
uv add datasette-otel-otlp-exporter
Usage
A one-liner with uvx, sending traces to an OTLP endpoint on localhost:4318:
uvx --prerelease=allow \
  --with datasette-otel-otlp-exporter \
  --with 'datasette>=1a41' \
  datasette \
    -s plugins.datasette-otel-otlp-exporter.endpoint http://localhost:4318 \
    my_data.db
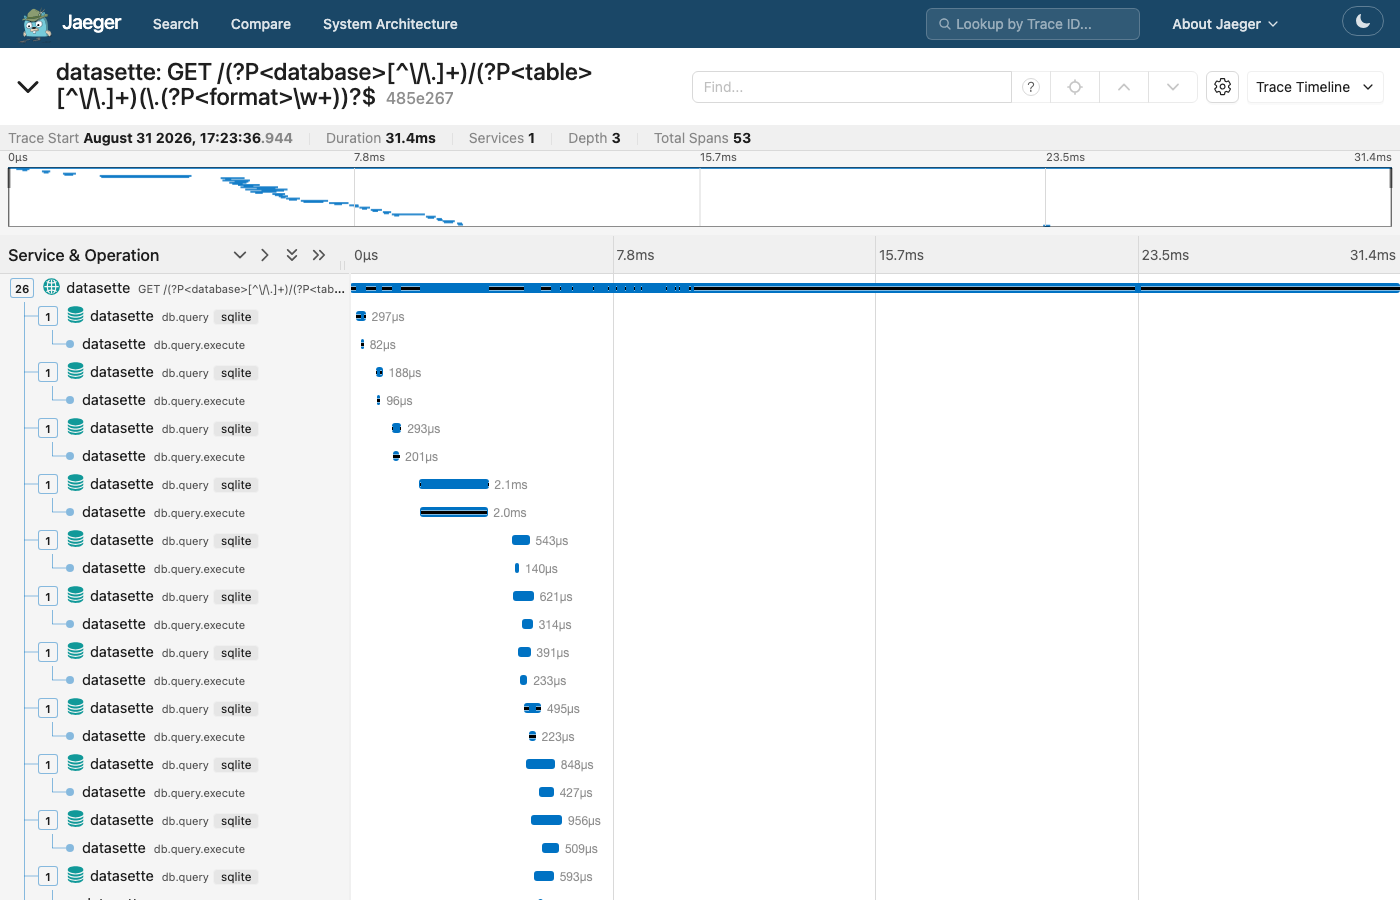
To try this locally, run Jaeger, which ships as a single binary and accepts OTLP on port 4318. Load a few Datasette pages, wait about five seconds for the next batch to go out, then open the Jaeger UI at http://localhost:16686 and pick the datasette service:
Hosted backends usually want an API key in a header. Keep the key out of your config file with Datasette's $env substitution:
# datasette.yaml
plugins:
  datasette-otel-otlp-exporter:
    endpoint: https://api.honeycomb.io
    headers:
      x-honeycomb-team:
        $env: HONEYCOMB_API_KEY
HONEYCOMB_API_KEY=... datasette my_data.db -c datasette.yaml
Grafana Cloud
Grafana Cloud's free tier is a cheap way to get a hosted trace UI, for example for a Datasette instance on Fly.io. Its OTLP gateway needs a specific URL and a basic-auth header, so the plugin builds both from a grafana_cloud block:
# datasette.yaml
plugins:
  datasette-otel-otlp-exporter:
    grafana_cloud:
      region: prod-us-east-0
      instance_id: "123456"
      api_token:
        $env: GRAFANA_CLOUD_TOKEN
All three values come from the OpenTelemetry tile on your stack's page at grafana.com, and the token needs the traces:write scope (creating one). Newer Grafana Cloud regions use a different gateway hostname than otlp-gateway-<region>.grafana.net. If yours does, replace region with endpoint set to the full URL from the tile, ending in /otlp/v1/traces.
Service name and sampling
These use the standard OpenTelemetry environment variables:
OTEL_SERVICE_NAME=my-datasette \
OTEL_TRACES_SAMPLER=parentbased_traceidratio \
OTEL_TRACES_SAMPLER_ARG=0.25 \
  datasette my_data.db -c datasette.yaml
This labels the instance my-datasette in your tracing UI and keeps a quarter of traces. By default every trace is kept and the service name is datasette.
More details are in the Reference below.
Privacy
Spans include the text of every SQL query Datasette runs, in the db.query.text attribute. On a public instance that includes any SQL visitors type into the query editor or send with ?sql=. Parameter values are never recorded, but table names, column names and literal values written into the SQL are. Everything goes to the endpoint you configure, so if that's a third-party service, you are sending it your users' queries. Treat your tracing backend with the same care as the database itself.
Reference
Options
# datasette.yaml
plugins:
  datasette-otel-otlp-exporter:
    endpoint: http://localhost:4318
    headers:
      x-api-key:
        $env: TRACING_API_KEY
| option | default | description |
|---|---|---|
endpoint |
Base OTLP/HTTP URL, e.g. http://localhost:4318. /v1/traces is appended when the URL has no path. Without an endpoint, nothing is exported. |
|
headers |
{} |
HTTP headers sent with every export, usually a vendor API key. |
grafana_cloud |
Grafana Cloud settings (see below). Sets a default endpoint and Authorization header. |
grafana_cloud takes:
| option | description |
|---|---|
instance_id |
Required. Your stack's instance ID, sent as the basic-auth username. |
api_token |
Required. An access policy token with the traces:write scope, sent as the basic-auth password. |
region |
Your stack's region, e.g. prod-us-east-0, used to build the URL https://otlp-gateway-<region>.grafana.net/otlp/v1/traces. |
endpoint |
The full gateway URL, ending in /otlp/v1/traces. Use this instead of region when your stack's hostname doesn't follow that pattern. |
Some behavior to be aware of:
- Without an
endpoint(orgrafana_cloudblock), the plugin printsno endpoint configured - OpenTelemetry export is disabledto stderr at startup and sends nothing. - Unknown options and invalid values fail at startup, listing every problem:
Error: datasette-otel-otlp-exporter: invalid plugin config endpiont: Extra inputs are not permitted - An explicit
endpointtakes precedence over the onegrafana_cloudbuilds. Explicitheadersare merged over itsAuthorizationheader, key by key. - Spans are sent in batches, about every five seconds, and once more when Datasette exits.
- If the backend is unreachable, Datasette keeps serving pages as normal. Each batch is retried for a few seconds, then dropped with a
Failed to export span batchlog message.
Environment variables
The standard OpenTelemetry environment variables are supported, and they take precedence over plugin config:
| variable | description |
|---|---|
OTEL_SERVICE_NAME |
The service.name shown in your tracing UI. Defaults to datasette. service.name in OTEL_RESOURCE_ATTRIBUTES works too. |
OTEL_TRACES_SAMPLER, OTEL_TRACES_SAMPLER_ARG |
Which traces to keep. Defaults to keeping all of them. |
OTEL_EXPORTER_OTLP_ENDPOINT, OTEL_EXPORTER_OTLP_TRACES_ENDPOINT |
Override endpoint. |
OTEL_EXPORTER_OTLP_HEADERS, OTEL_EXPORTER_OTLP_TRACES_HEADERS |
Override headers. |
The service name and sampler are read when Datasette loads its plugins, so they also apply to the datasette.startup trace.
What gets exported
Whatever Datasette records. The plugin adds no spans of its own. That's one span per HTTP request named after the method and the route that matched it, one per SQL query with its text, database and timing, spans for writes, and a datasette.startup trace covering plugin hooks and loading the internal catalog. The full list of spans and attributes is in Datasette's telemetry documentation.
Only traces are exported. For metrics, see datasette-otel-prometheus.
Using alongside other OpenTelemetry setups
OpenTelemetry allows one tracer provider per process. The plugin installs its own when it is first imported, unless one already exists. If Datasette runs under opentelemetry-instrument, inside an application that set up tracing, or alongside another exporter plugin such as datasette-otel-file-exporter, the plugin adds its exporter to that provider instead. Both get every span, whichever loaded first. In that case the other provider's sampler and service name apply.
If the existing provider isn't the OpenTelemetry SDK's (for example a NoOpTracerProvider, which turns tracing off), the plugin can't attach to it. It prints a warning to stderr and exports nothing.
Release files for datasette-otel-otlp-exporter 0.1.0a1
For a detailed explanation of source distributions (sdists) and built distributions (wheels), please see the package formats documentation.
Source distribution (sdist)
| File | Size | Uploaded | |
|---|---|---|---|
| datasette_otel_otlp_exporter-0.1.0a1.tar.gz | 16.9 kB | Details |
Built distribution (wheel)
| File | Interpreter | ABI | Platform | Reset |
|---|---|---|---|---|
| datasette_otel_otlp_exporter-0.1.0a1-py3-none-any.whl | Python 3 | none | any | Details |
Total release size: 31.1 kB
Release files / datasette_otel_otlp_exporter-0.1.0a1.tar.gz
| Download URL | datasette_otel_otlp_exporter-0.1.0a1.tar.gz |
|---|---|
| Size | 16.9 kB |
| Tags | Source |
|
SHA-256 checksum How to use checksums |
66f76e60a77af37bd4972e89bbbcdf54579bf69202874c5c397dacf6809df410
|
|
BLAKE2b-256 checksum How to use checksums |
b0465c804e36f20758f35afbc122da0b93177d452ca202ecba8b2bdb92f8025d
|
| Upload date | |
|
Uploaded using Trusted Publishing? What is trusted publishing? |
Yes |
| Uploaded via |
twine/7.0.0 CPython/3.13.14
|
Provenance
Provenance describes where a file came from. On PyPI, provenance is shared via attestations, which provide a verifiable record of the build or publishing details. View details, limitations and caveats.


PyPI Publish Attestation
PyPI verified that this artifact, at this checksum, originated from the publisher listed below.
Signed by GitHub Actions, verified by PyPI on Sep 25, 2026.
Transparency logRelease files / datasette_otel_otlp_exporter-0.1.0a1-py3-none-any.whl
| Download URL | datasette_otel_otlp_exporter-0.1.0a1-py3-none-any.whl |
|---|---|
| Size | 14.2 kB |
| Tags | Python 3 |
|
SHA-256 checksum How to use checksums |
6c607e1d7f00180054c024da2a6328bb389f508b153a626a788583cad83f190f
|
|
BLAKE2b-256 checksum How to use checksums |
00cee3743bea8d121e3e37d337c34b0058401dc78ddc96762117e8b921371696
|
| Upload date | |
|
Uploaded using Trusted Publishing? What is trusted publishing? |
Yes |
| Uploaded via |
twine/7.0.0 CPython/3.13.14
|
Provenance
Provenance describes where a file came from. On PyPI, provenance is shared via attestations, which provide a verifiable record of the build or publishing details. View details, limitations and caveats.
PyPI Publish Attestation
PyPI verified that this artifact, at this checksum, originated from the publisher listed below.
Signed by GitHub Actions, verified by PyPI on Sep 25, 2026.
Transparency log












