
This release is a pre-release and may not be stable for production use.
datasette-otel-viewer
Browse Datasette's builtin OpenTelemetry traces and metrics from inside Datasette itself.
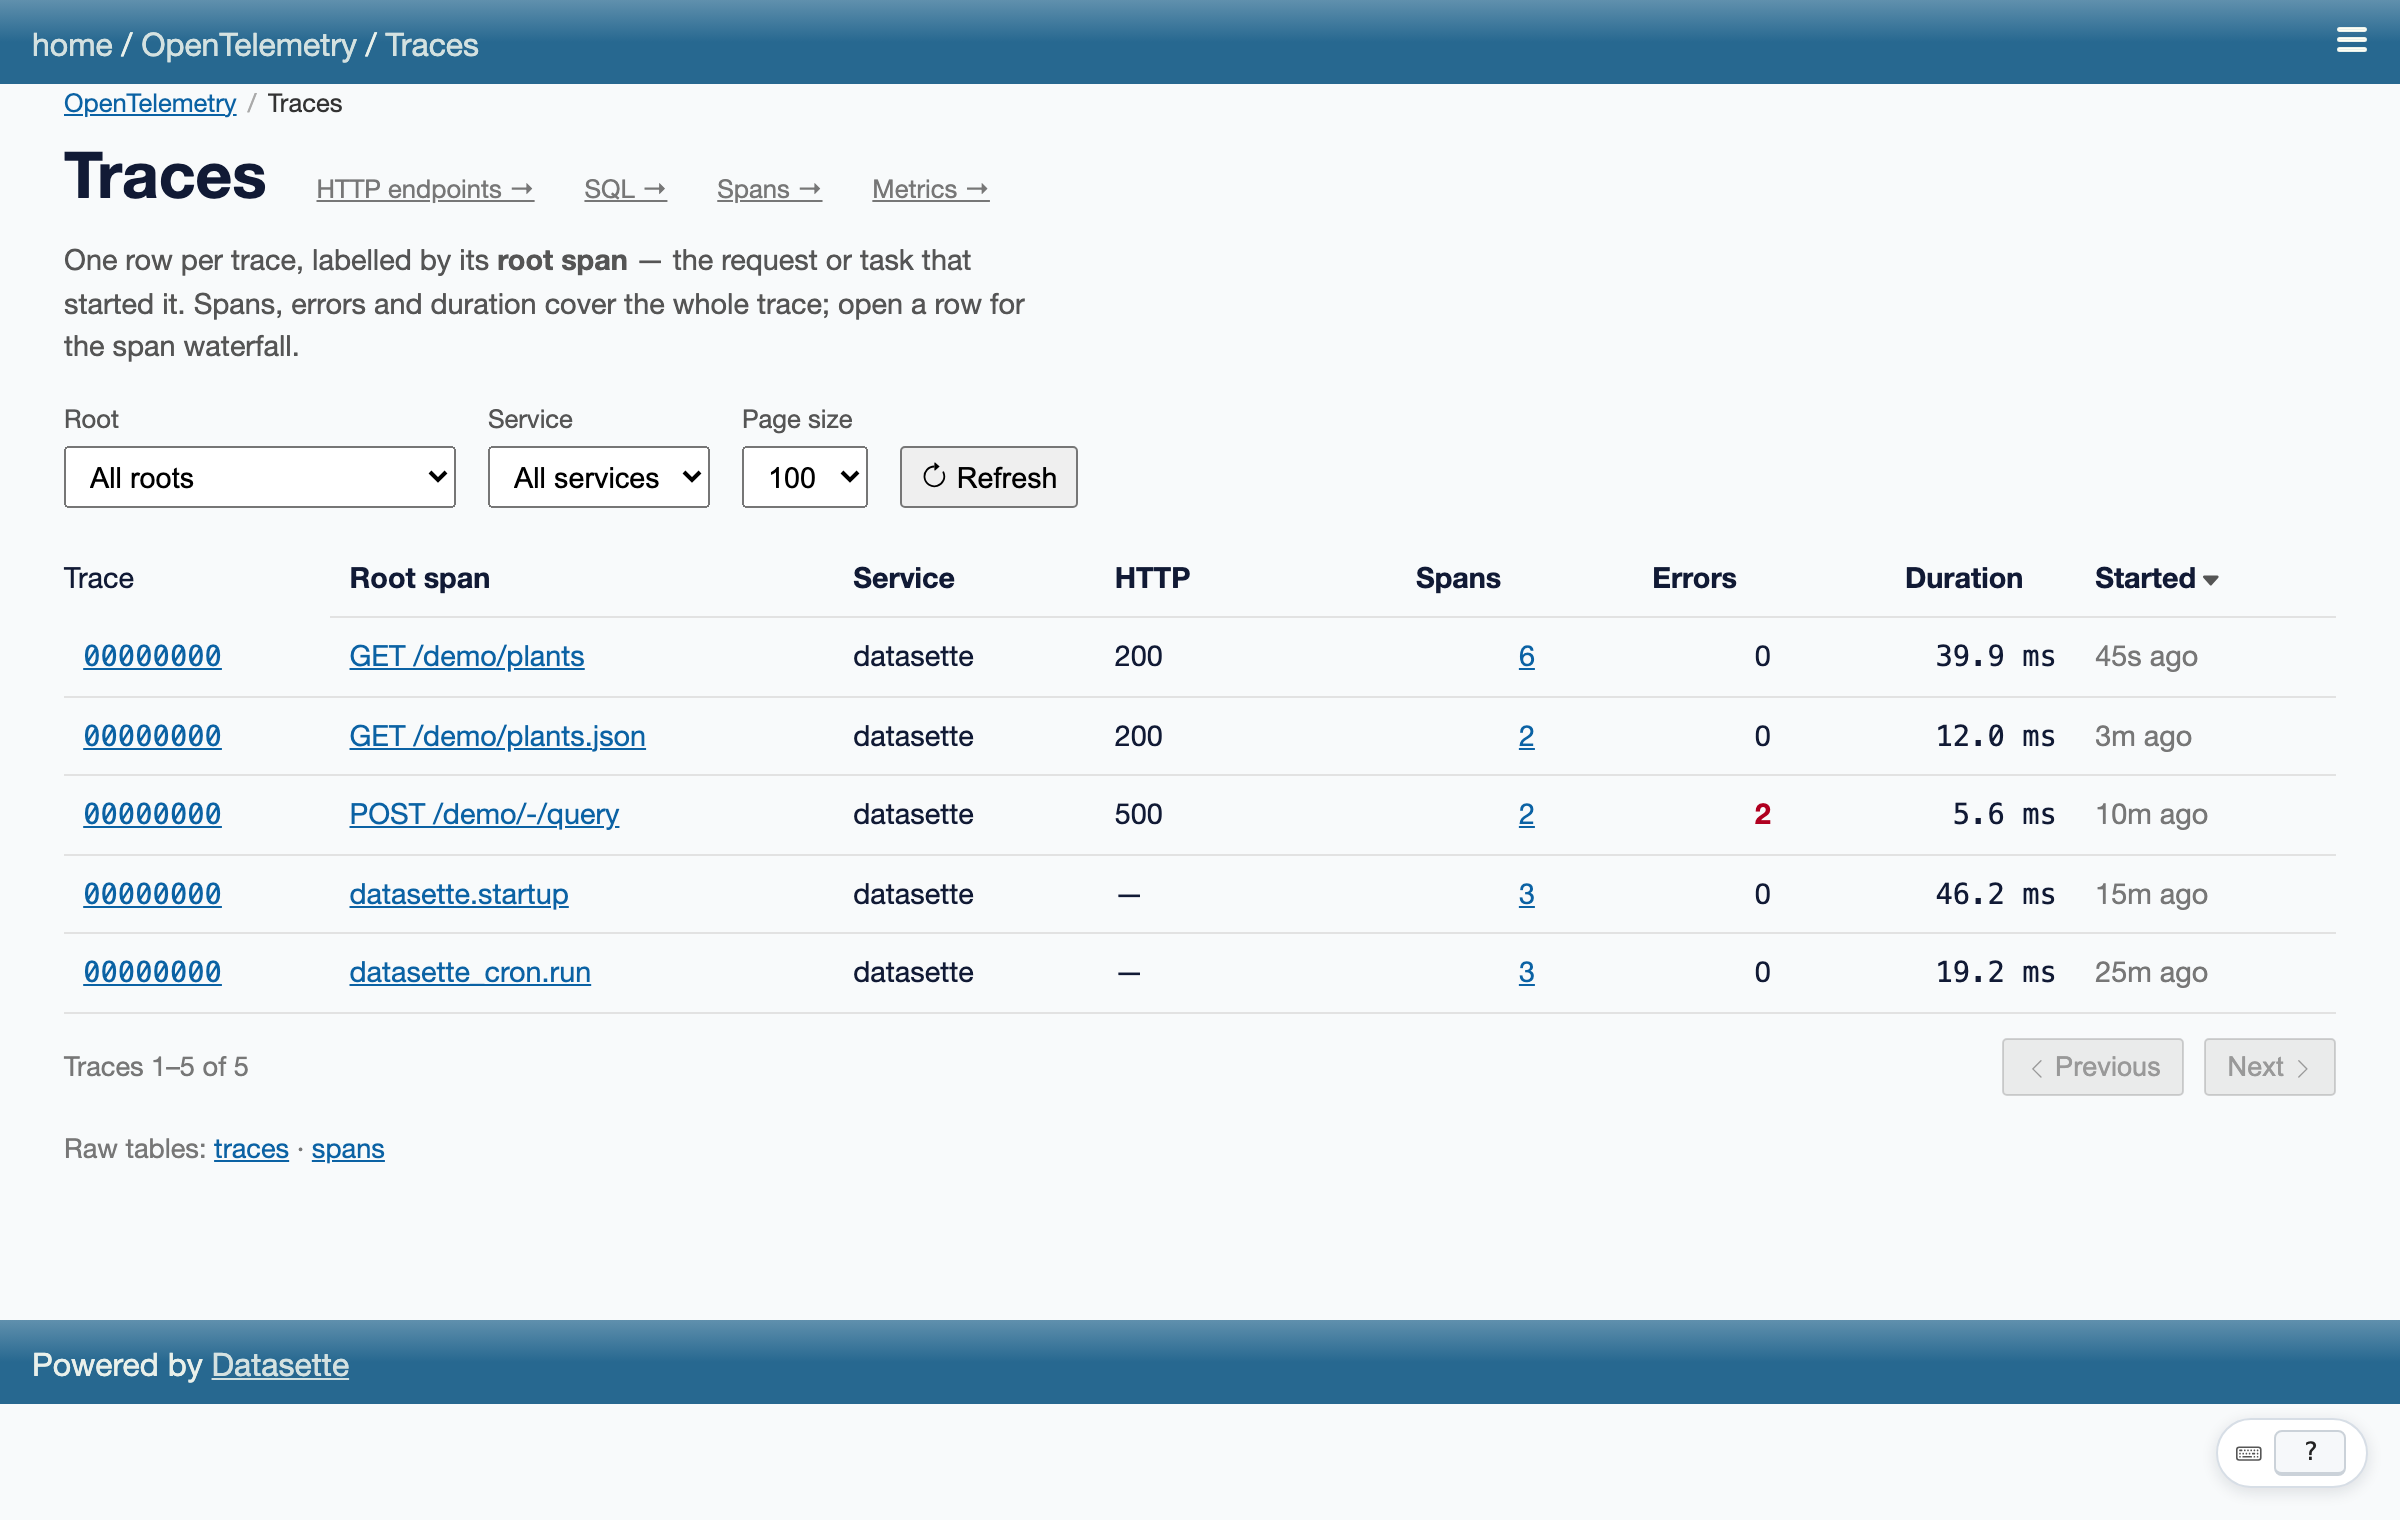
Datasette records a trace for every request, and a span for every SQL query, template render and plugin task, plus metrics like query durations and write queue depth. Normally you'd need to run Jaeger, Honeycomb or Grafana alongside Datasette to look at any of that. datasette-otel-viewer stores this instance's own spans and metrics in a SQLite database and adds a viewer at /-/otel: a trace list, span waterfalls, slowest endpoints and SQL statements, and metric charts. Nothing else runs, and nothing leaves the machine.
Installing
This plugin requires Datasette 1.0a41 or higher.
uv add datasette-otel-viewer
Usage
A one-liner with uvx:
uvx --prerelease=allow \
  --with datasette-otel-viewer \
  --with 'datasette>=1a41' \
  datasette my_data.db --root
Open the link --root prints, click around for a bit, then pick OpenTelemetry from the menu, or go to /-/otel. No config is needed. Spans and metrics go to otel.db in the current directory, which keeps the last 72 hours and at most 100,000 spans.
The viewer is private by default. See Privacy and permissions for how to let other users in.
What's in the viewer
Traces (/-/otel/traces) lists one row per trace, labelled by the request or task that started it. You can sort by duration or error count and filter by what started the trace. The list is sorted and paged over the whole store, and the URL holds the state, so "slowest traces this morning" is a link you can share.
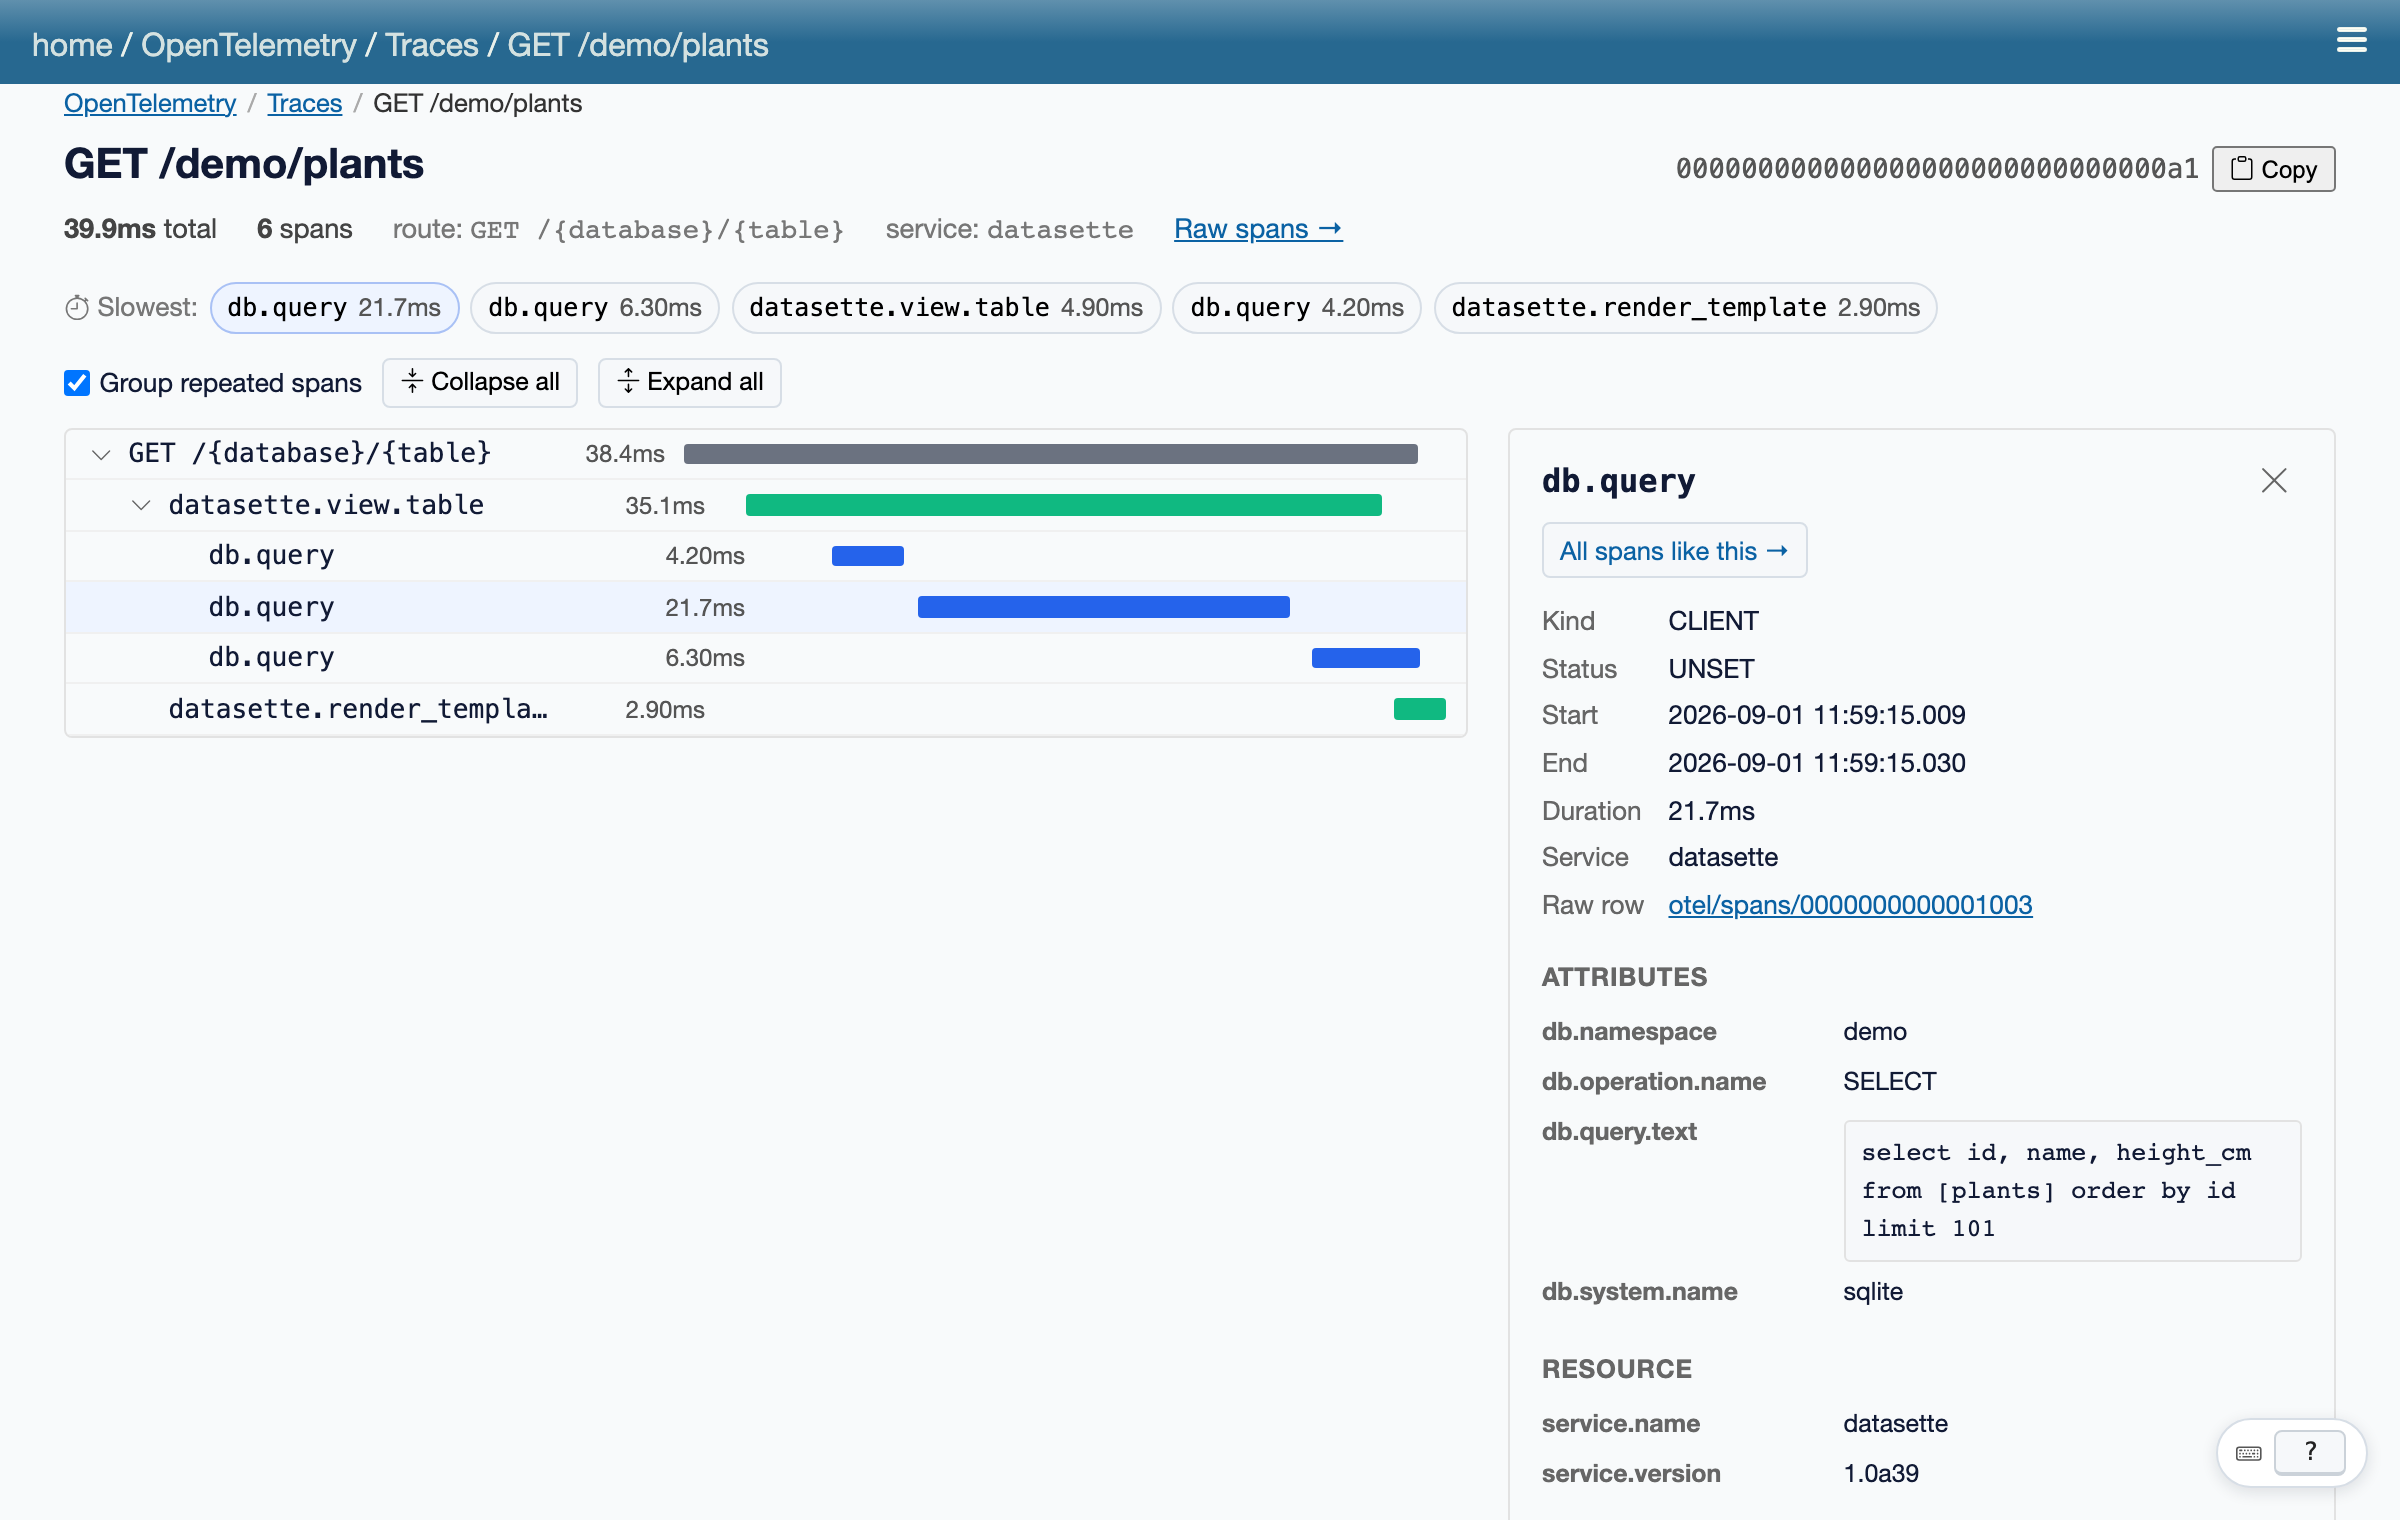
Trace waterfall (/-/otel/traces/<trace_id>) shows every span in a trace on a timeline. Selecting a span opens an inspector with its attributes, including the SQL it ran. Runs of repeated sibling spans, like fifty db.query calls in a row, are folded into one row until you open them. All spans like this compares the span with every other span of the same kind.
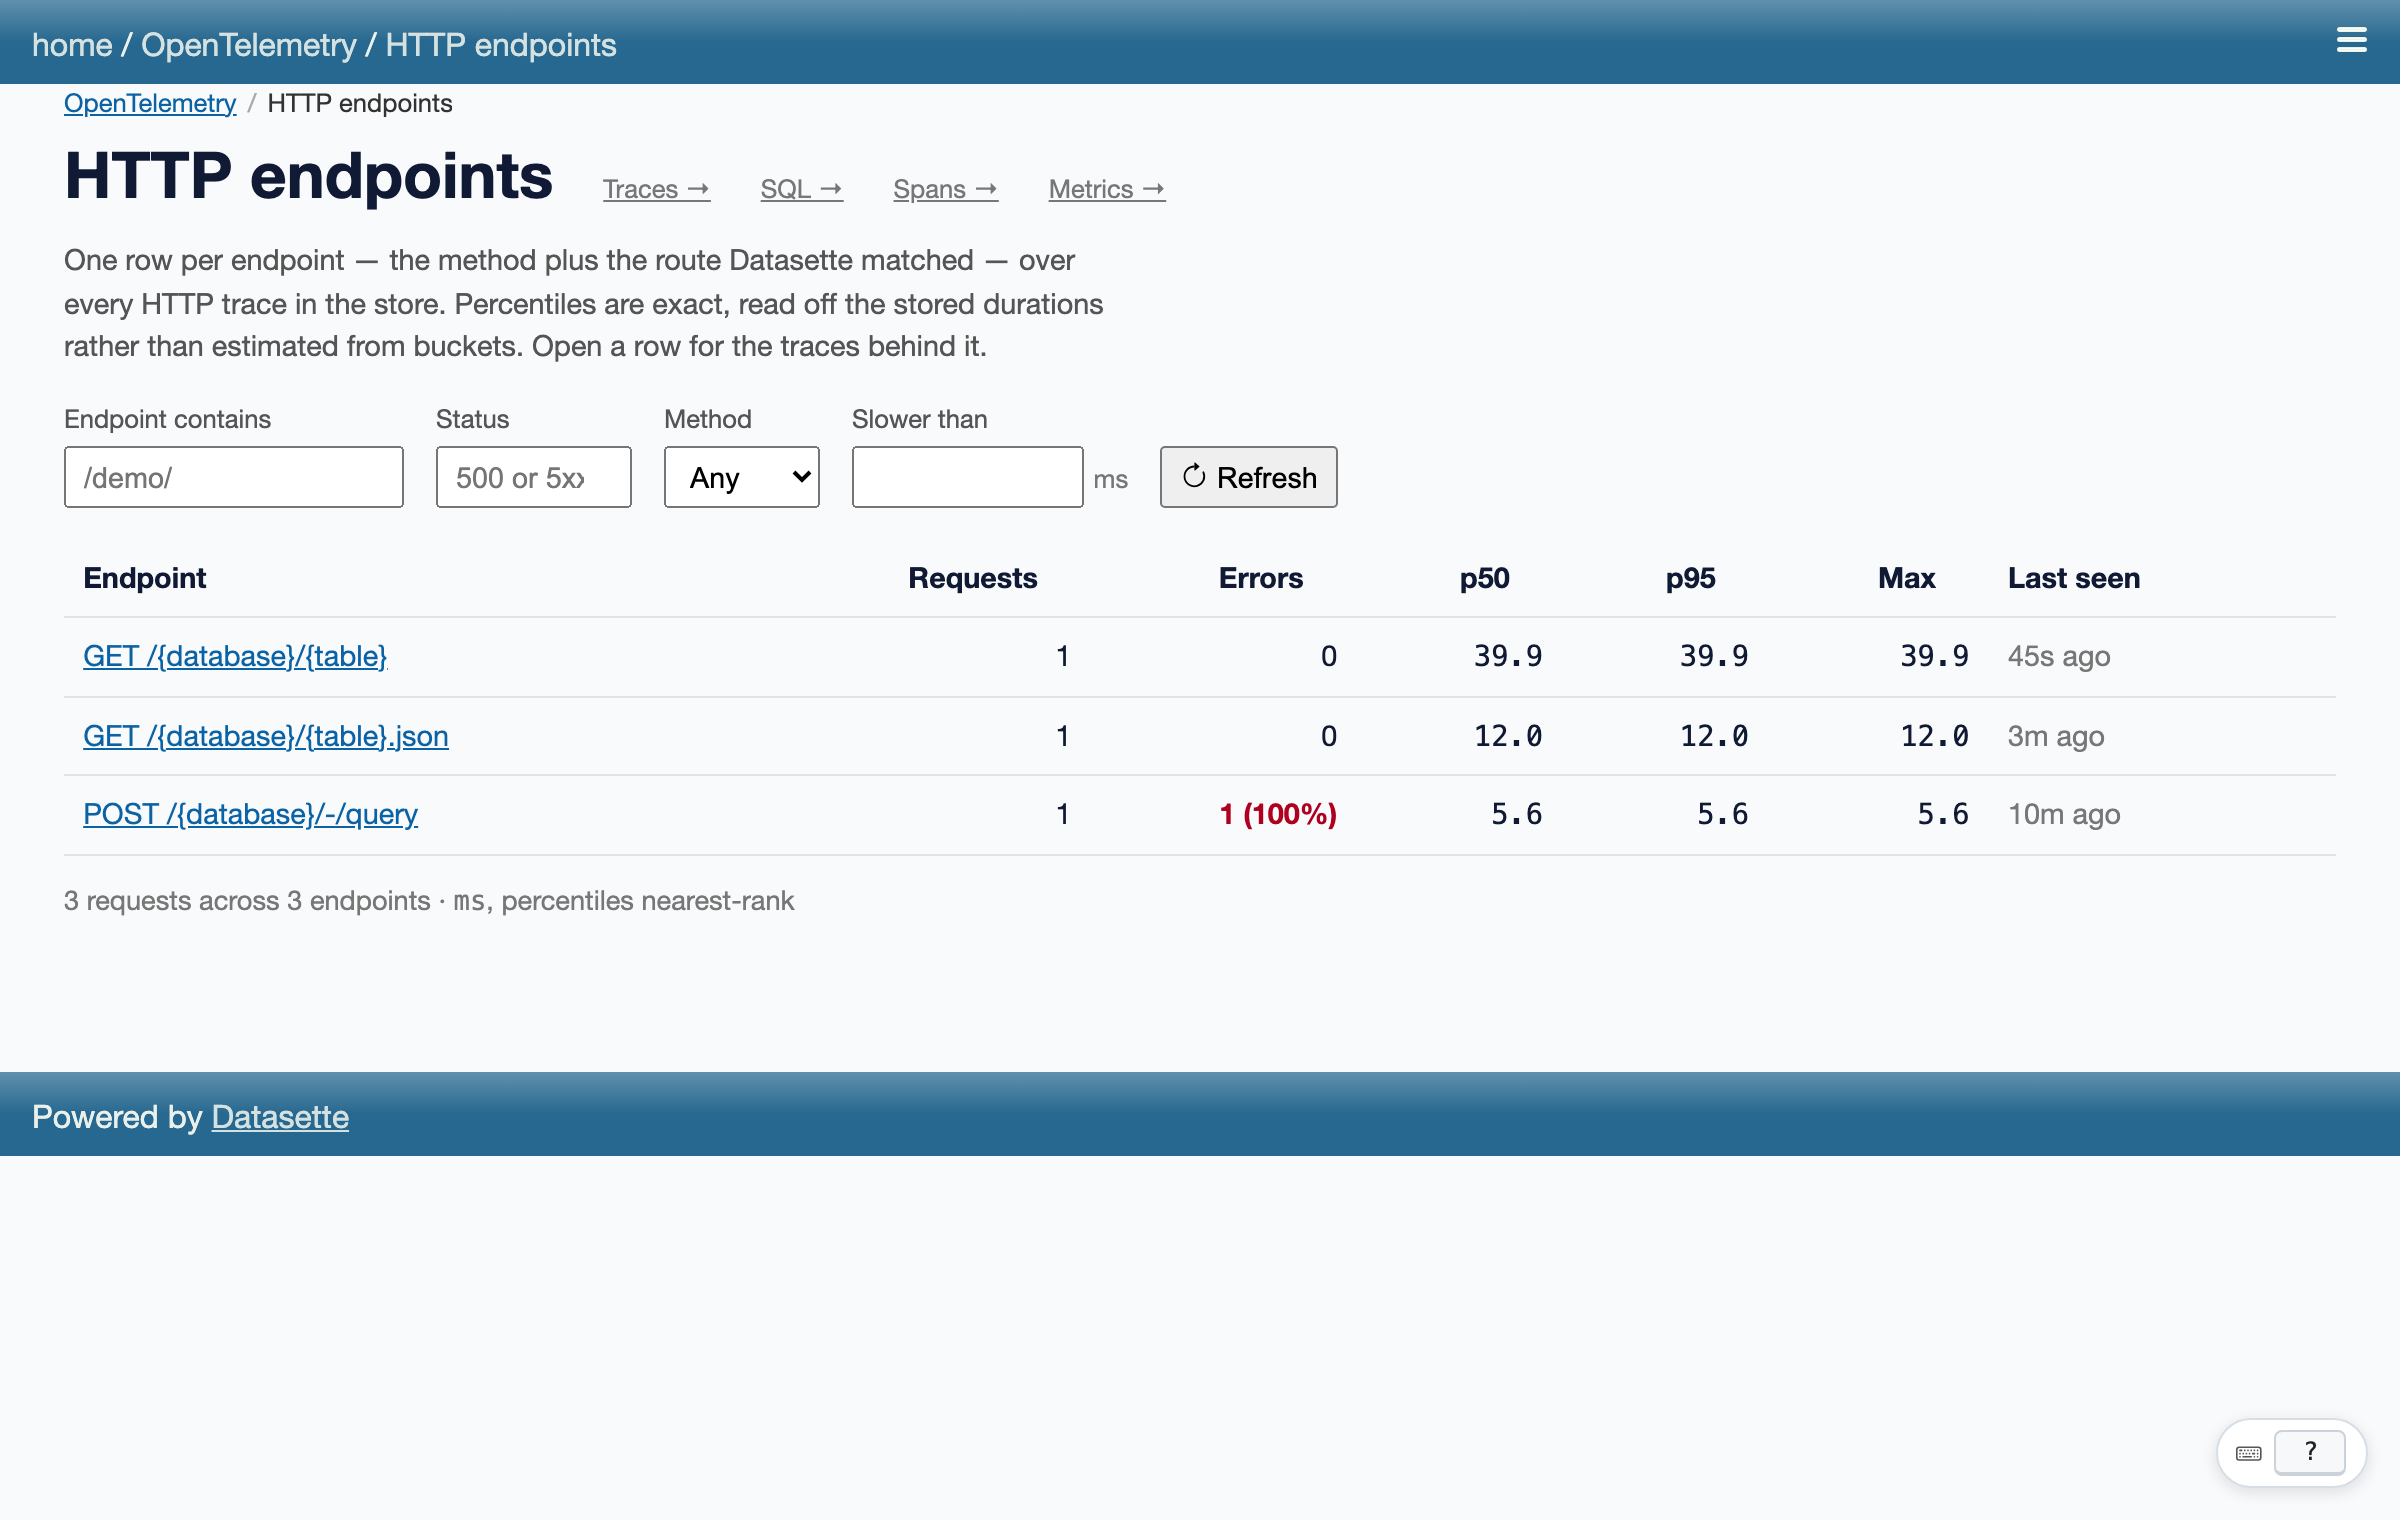
HTTP endpoints (/-/otel/http) groups requests by method and route, with request counts, errors, and exact p50/p95/max durations. A row opens the traces behind it.
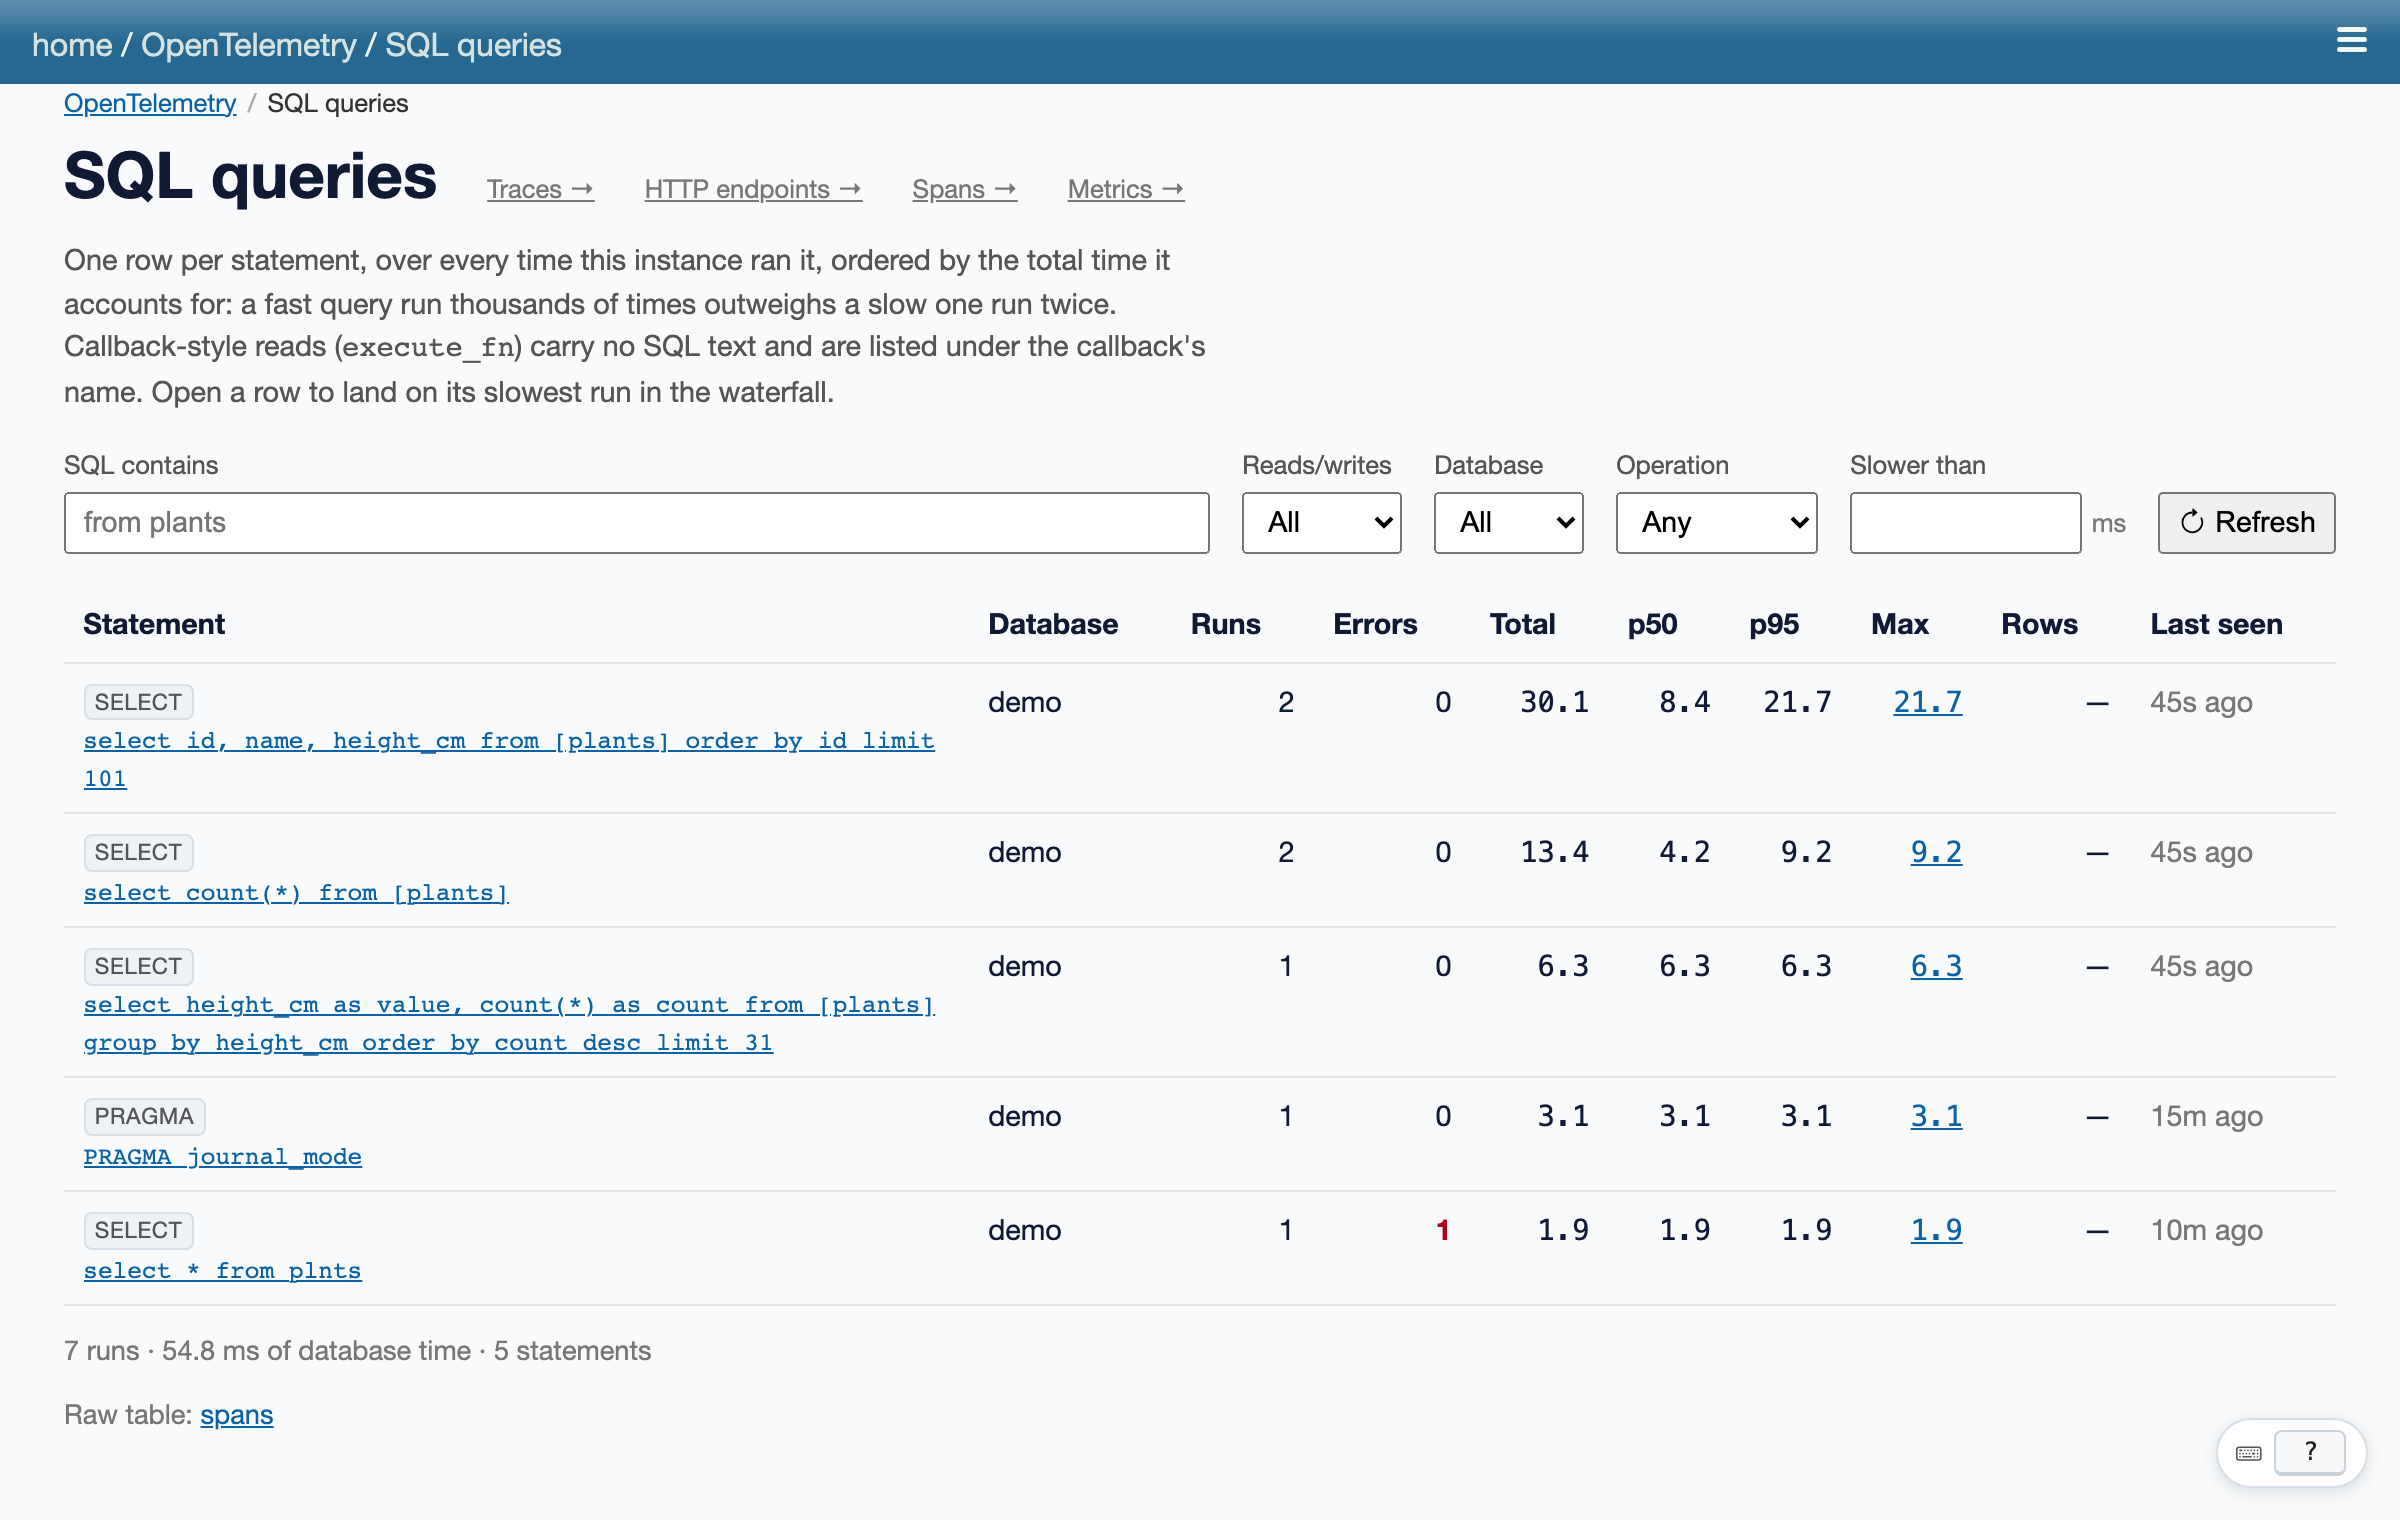
SQL queries (/-/otel/sql) groups statements by database, ordered by total time. A cheap query that runs ten thousand times can cost more than a slow one that runs twice, and this is where that shows up. Reads and writes are told apart, and callback-style reads like execute_fn() are counted under the callback's name.
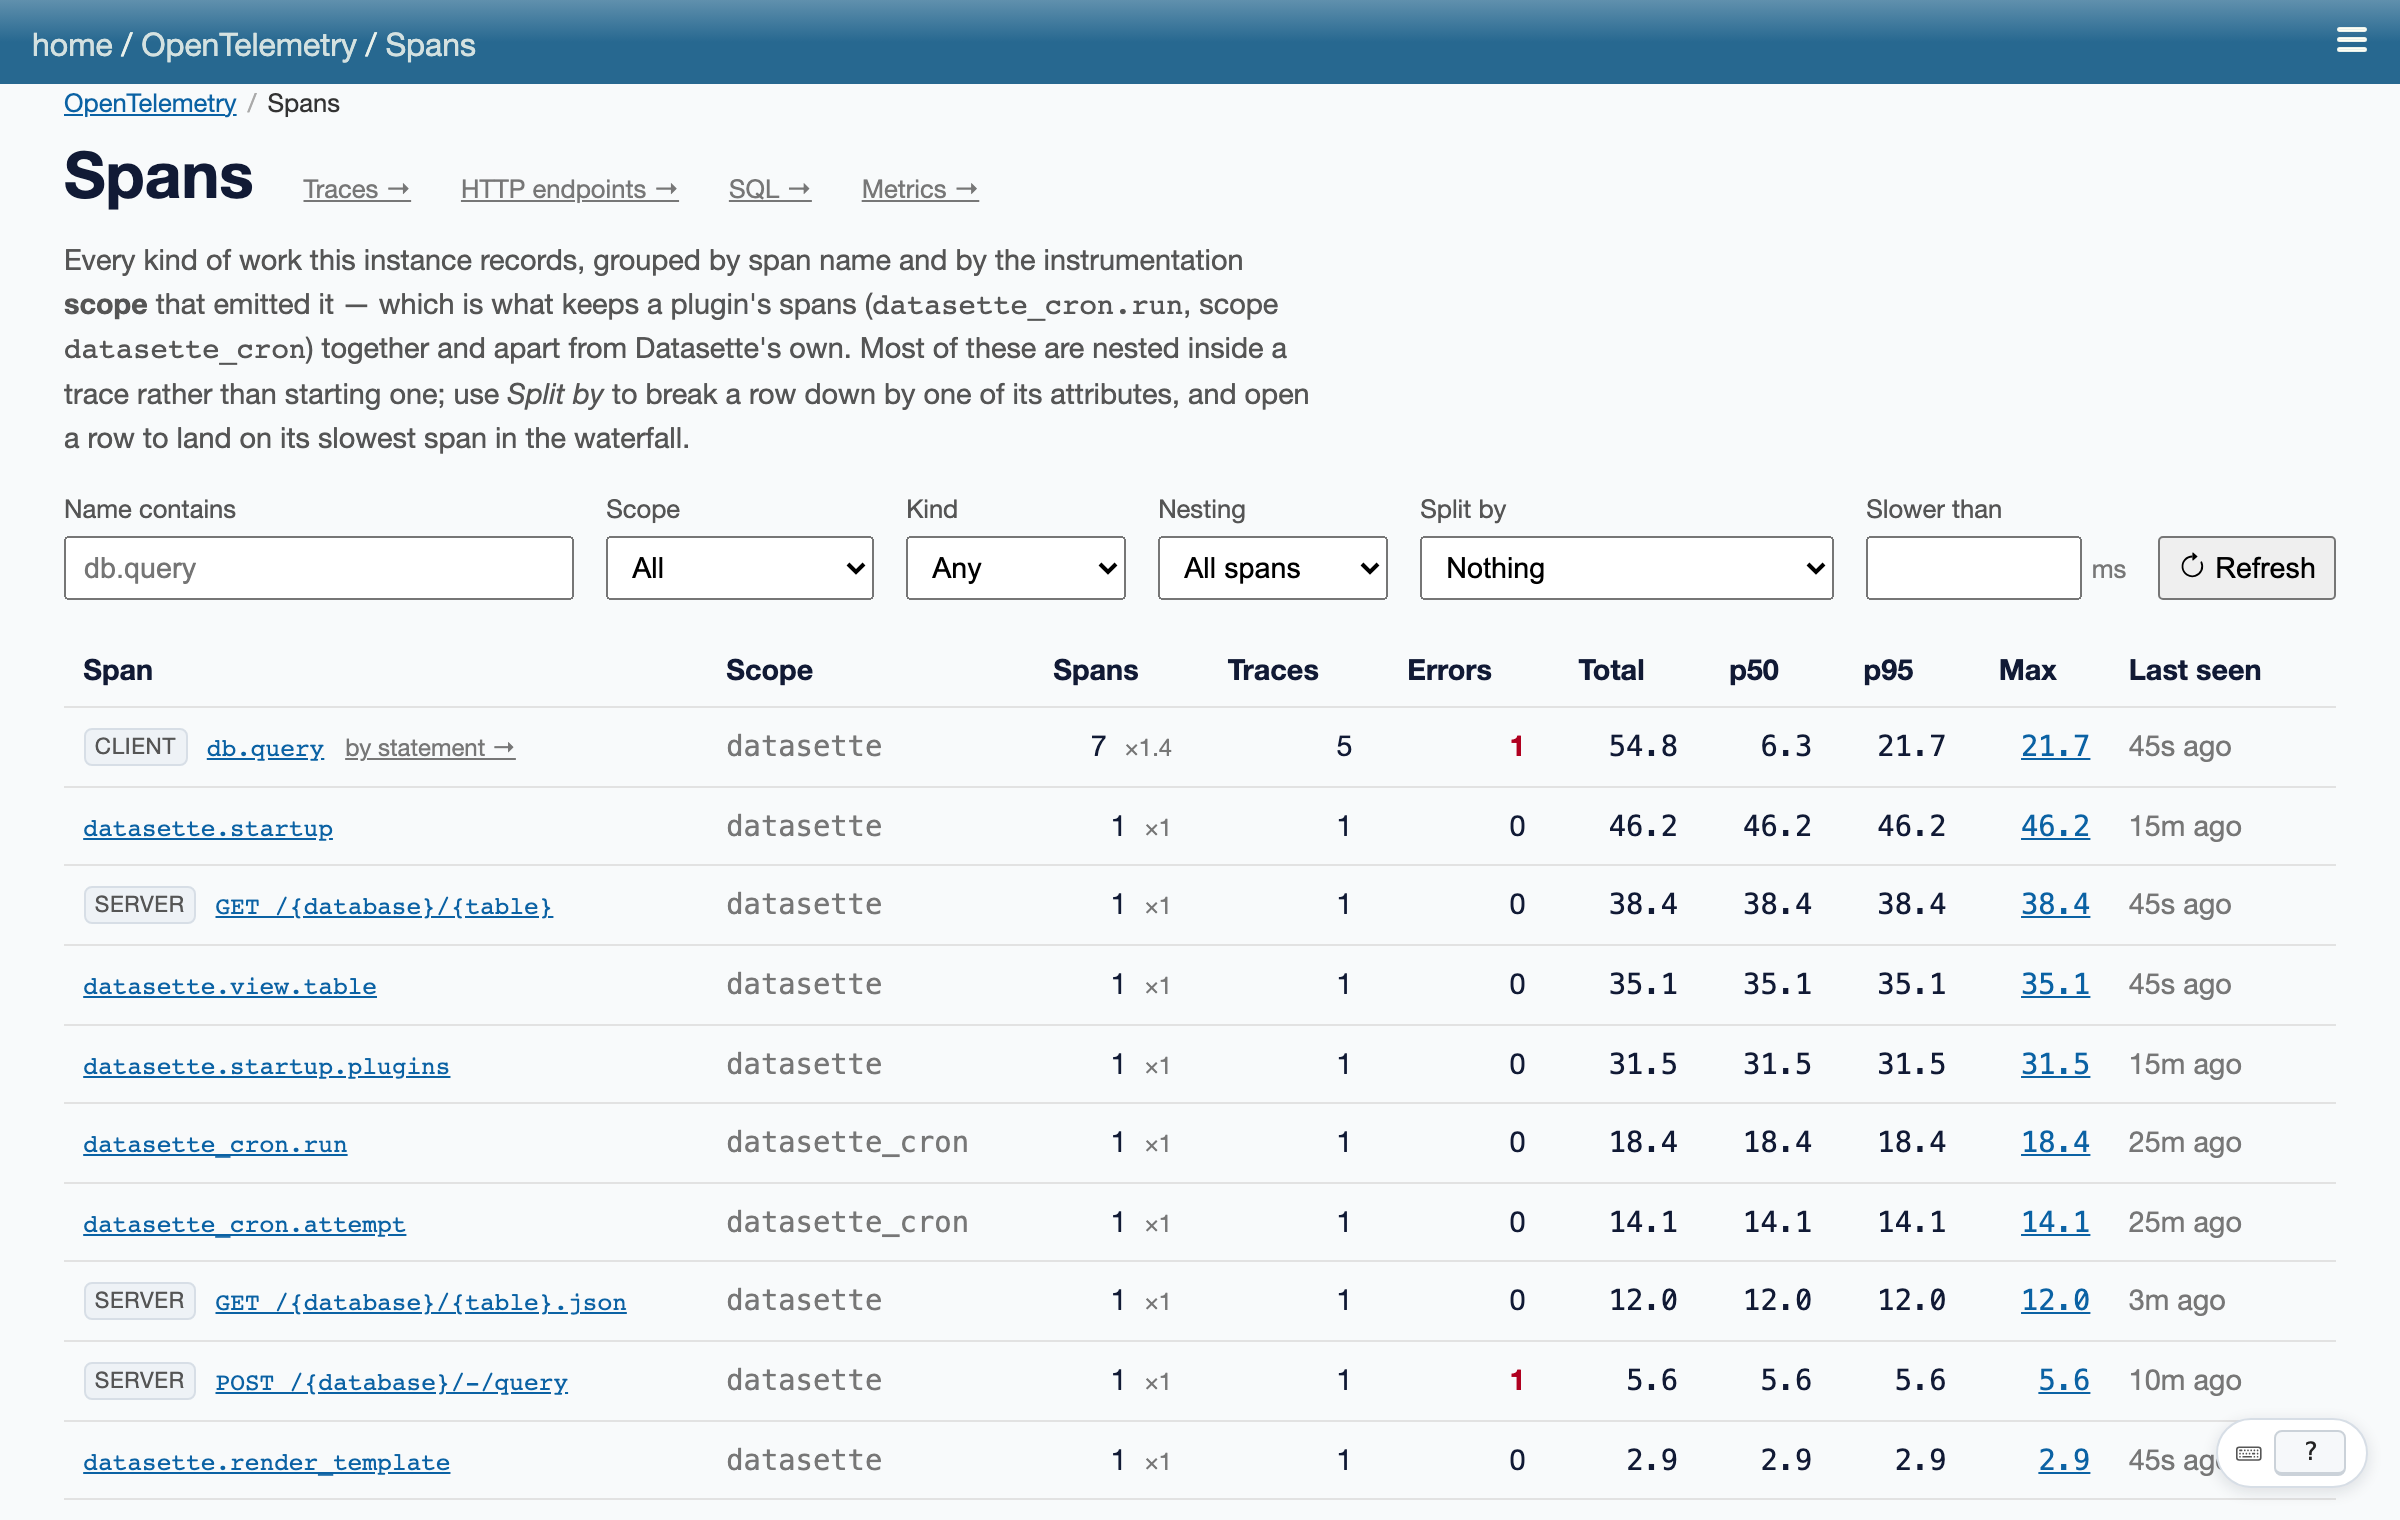
Spans (/-/otel/spans) lists every kind of span recorded, grouped by name and the library or plugin that emitted it. Plugins that add their own spans show up here without any setup. ?split_by=<attribute> breaks a row down by an attribute's values, for example a datasette_cron.run span split by task. A row opens the matching spans with a duration scatter plot of all of them.
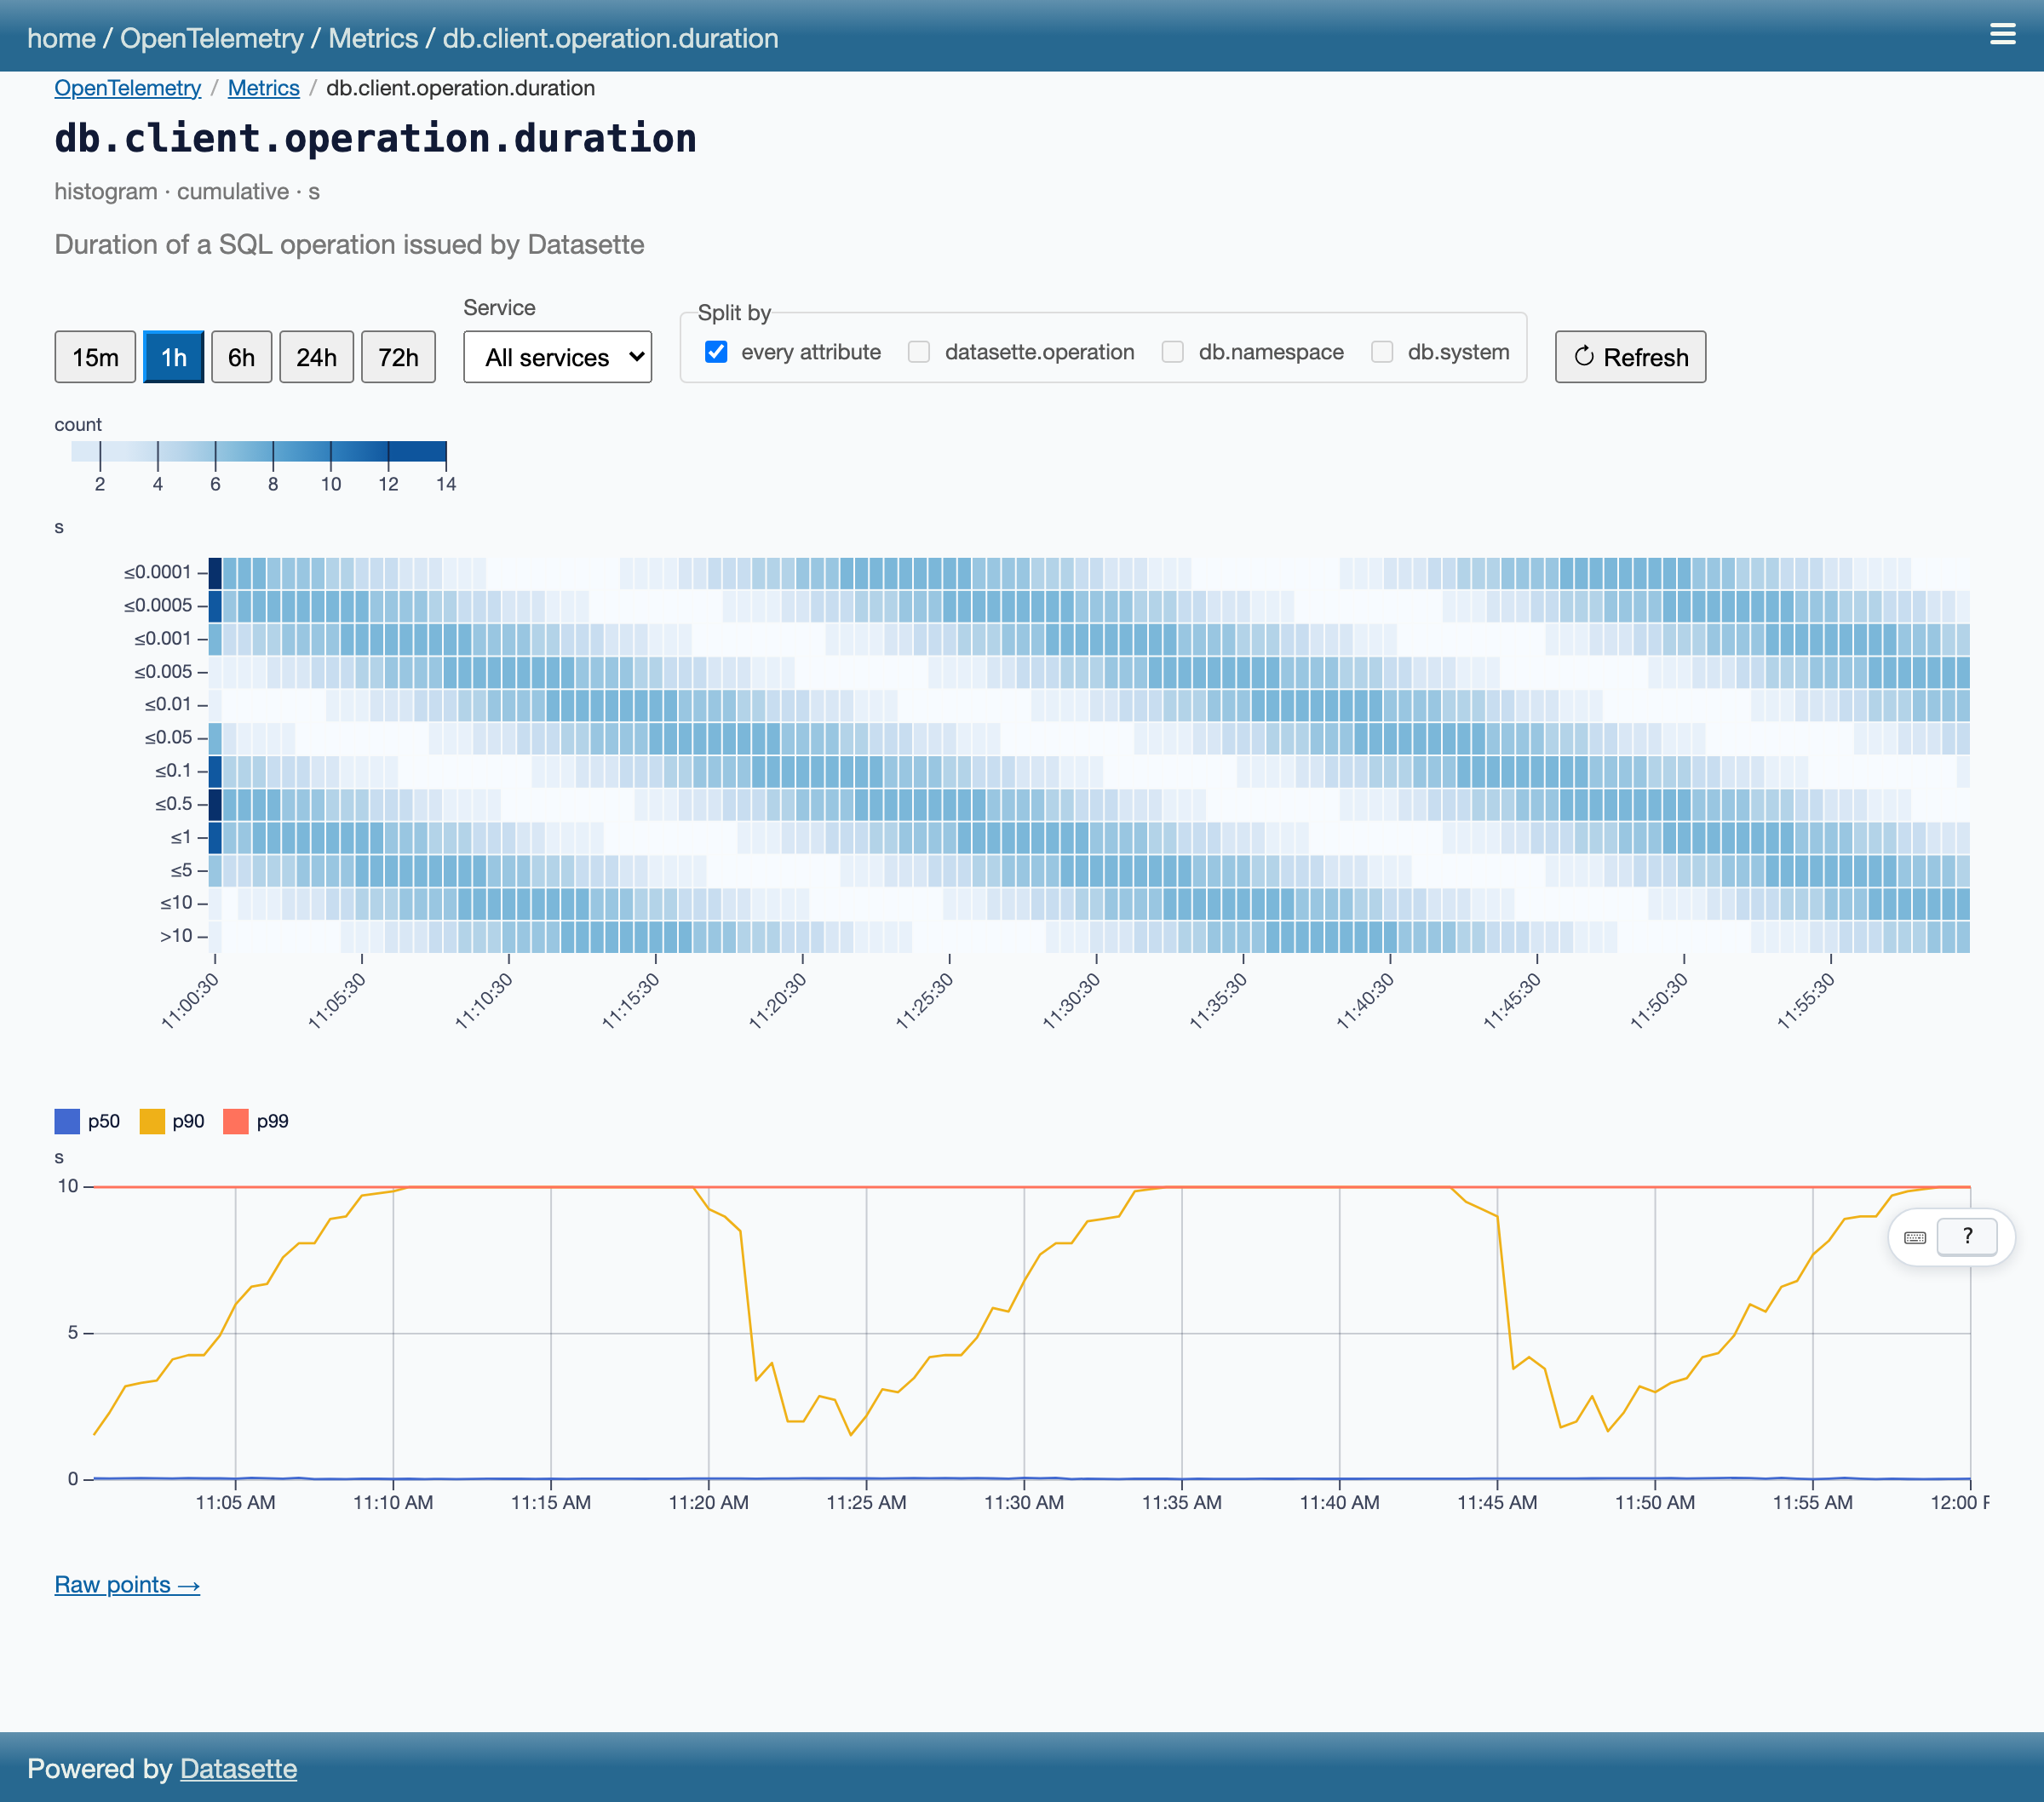
Metrics (/-/otel/metrics) lists every stored metric, and each one has a chart page: lines for gauges and counters, with a per-second rate for counters, and a heatmap plus p50/p90/p99 lines for histograms. Metrics are stored once a minute.
Every page can be driven from the keyboard: press ? for the shortcuts.
The data behind all of this is in ordinary Datasette tables (traces, spans, metrics, metric_points in the otel database), so facets, the JSON API and your own SQL work on it too.
Privacy and permissions
The store holds the text of every SQL query Datasette runs. On a public instance that includes SQL typed by visitors, literals and all, as well as URL paths and other request details. Datasette never records SQL parameter values, only how many there were. Treat otel.db with the same care as your databases.
So the viewer and the raw tables are private by default. Viewing either requires the datasette-otel-viewer permission, which --root has. To grant it to an actor:
# datasette.yaml
permissions:
  datasette-otel-viewer:
    id: alex
public_viewer: true opens the viewer pages and their JSON API to everyone. The raw otel tables stay private even then.
Reference
Options
# datasette.yaml
plugins:
  datasette-otel-viewer:
    retention_hours: 24
    service_name: my-datasette
| option | default | description |
|---|---|---|
self_traces |
true |
Store the spans this instance emits. false leaves an existing store browsable without adding to it. |
self_metrics |
true |
Store this instance's metrics. |
public_viewer |
false |
Open the viewer pages and API to everyone. The raw tables stay private. |
retention_hours |
72 |
Whole traces and metric points older than this are deleted. |
max_spans |
100000 |
Past this many spans, the oldest whole traces are deleted. |
max_metric_points |
100000 |
Past this many metric points, the oldest are deleted. |
db_path |
otel.db |
SQLite file for the store, created if missing. |
db_name |
otel |
Name the store is served under, as in /otel/spans. |
service_name |
datasette |
service.name on stored spans and metrics. |
Unknown options and invalid values fail at startup, e.g. Error: Invalid plugins.datasette-otel-viewer config: public_veiwer: Extra inputs are not permitted.
Some behavior to be aware of:
- Deletes happen at most once a minute, a whole trace at a time, so a trace is never shown with some of its spans missing.
- Spans take a second or two to show up. They're written by a background task about once a second, and once more when Datasette shuts down.
- One-off commands such as
datasette --getdon't write anything.
Using alongside other OpenTelemetry setups
To store its own spans, the plugin has to install the OpenTelemetry TracerProvider itself, when it is first imported. Writing a span to the store runs SQL, and that SQL would produce more spans to store, forever. The plugin's provider drops spans from its own writes, and only a provider it installed can do that. If another provider is already installed, for example because Datasette runs under opentelemetry-instrument, the plugin prints a warning and stops storing spans. The viewer keeps working on whatever is already in the store.
Metrics don't have that problem. If another MeterProvider is already installed, the plugin adds its reader to that one and keeps storing metrics.
With datasette-otel-file-exporter or datasette-otel-prometheus installed too, whichever plugin loads first installs its provider, and that decides what works:
- datasette-otel-file-exporter: if this plugin loads first, the exporter adds itself to this plugin's provider and both work. If the exporter loads first, spans are exported to files but not stored here.
- datasette-otel-prometheus: if it loads first, this plugin adds its reader to its provider and both work. If this plugin loads first, Prometheus is served no metrics.
Both cases print a warning to stderr at startup.
Development
uv sync && npm install --prefix frontend
just types      # regenerate TypeScript types from the Python models
just frontend   # build the frontend into the package
just test       # pytest
just dev        # a demo instance on :8012
just shots      # regenerate the screenshots in docs/screenshots/
For hot reload, run just frontend-dev in one terminal and just dev-with-hmr in another. NOTES.md has the longer design notes, and CLAUDE.md has a map of the code.
Release files for datasette-otel-viewer 0.1.0a1
For a detailed explanation of source distributions (sdists) and built distributions (wheels), please see the package formats documentation.
Source distribution (sdist)
| File | Size | Uploaded | |
|---|---|---|---|
| datasette_otel_viewer-0.1.0a1.tar.gz | 237.6 kB | Details |
Built distribution (wheel)
| File | Interpreter | ABI | Platform | Reset |
|---|---|---|---|---|
| datasette_otel_viewer-0.1.0a1-py3-none-any.whl | Python 3 | none | any | Details |
Total release size: 465.4 kB
Release files / datasette_otel_viewer-0.1.0a1.tar.gz
| Download URL | datasette_otel_viewer-0.1.0a1.tar.gz |
|---|---|
| Size | 237.6 kB |
| Tags | Source |
|
SHA-256 checksum How to use checksums |
53b5426ac5e3b2f81967373712f779afc258b49913442f7c5f272e57f950e188
|
|
BLAKE2b-256 checksum How to use checksums |
d7ce35f365b58f5be3e2bd2012e65d50d37b3b9500840fd5ad7e396a0f7e6e0b
|
| Upload date | |
|
Uploaded using Trusted Publishing? What is trusted publishing? |
Yes |
| Uploaded via |
twine/7.0.0 CPython/3.13.14
|
Provenance
Provenance describes where a file came from. On PyPI, provenance is shared via attestations, which provide a verifiable record of the build or publishing details. View details, limitations and caveats.


PyPI Publish Attestation
PyPI verified that this artifact, at this checksum, originated from the publisher listed below.
Signed by GitHub Actions, verified by PyPI on Sep 25, 2026.
Transparency logRelease files / datasette_otel_viewer-0.1.0a1-py3-none-any.whl
| Download URL | datasette_otel_viewer-0.1.0a1-py3-none-any.whl |
|---|---|
| Size | 227.9 kB |
| Tags | Python 3 |
|
SHA-256 checksum How to use checksums |
f374276340aa5e7d5de5be0b413f476c23fa24168438d89c89c0053967baa124
|
|
BLAKE2b-256 checksum How to use checksums |
d5ab3c7fd81bc0ca033cb43d9076f65c89b925598cea0ce0192ba20b3e3b8e0c
|
| Upload date | |
|
Uploaded using Trusted Publishing? What is trusted publishing? |
Yes |
| Uploaded via |
twine/7.0.0 CPython/3.13.14
|
Provenance
Provenance describes where a file came from. On PyPI, provenance is shared via attestations, which provide a verifiable record of the build or publishing details. View details, limitations and caveats.
PyPI Publish Attestation
PyPI verified that this artifact, at this checksum, originated from the publisher listed below.
Signed by GitHub Actions, verified by PyPI on Sep 25, 2026.
Transparency log












