Seeing is important. `datatour` - allows you to see your data in it's native dimension. Currently implemented as a `plotly` scatter plot projected from it's original dimension in the 2D on the screen with timeline animation inspired by GrandTour and common sense.
Verified details
These details have been verified by PyPIProject links
GitHub Statistics
Maintainers

Project description
DataTour
datatour


DataTour
Seeing is important. datatour - allows you to see your data in its native dimension.
Currently implemented as a plotly scatter plot projected from its original dimension in the 2D on the screen with timeline animation inspired by GrandTour and common sense.
Installation
Available via pip:
pip install datatour
Usage
If you have array of feature vectors f: shape(shape)==(n_smpl, n_dim), you can create data tour object, and display it:
from datatour import DataTour as dt

ndv = dt(f)
ndv.display()
By default, selects randomly n_subsample=500 samples for efficiency reason.
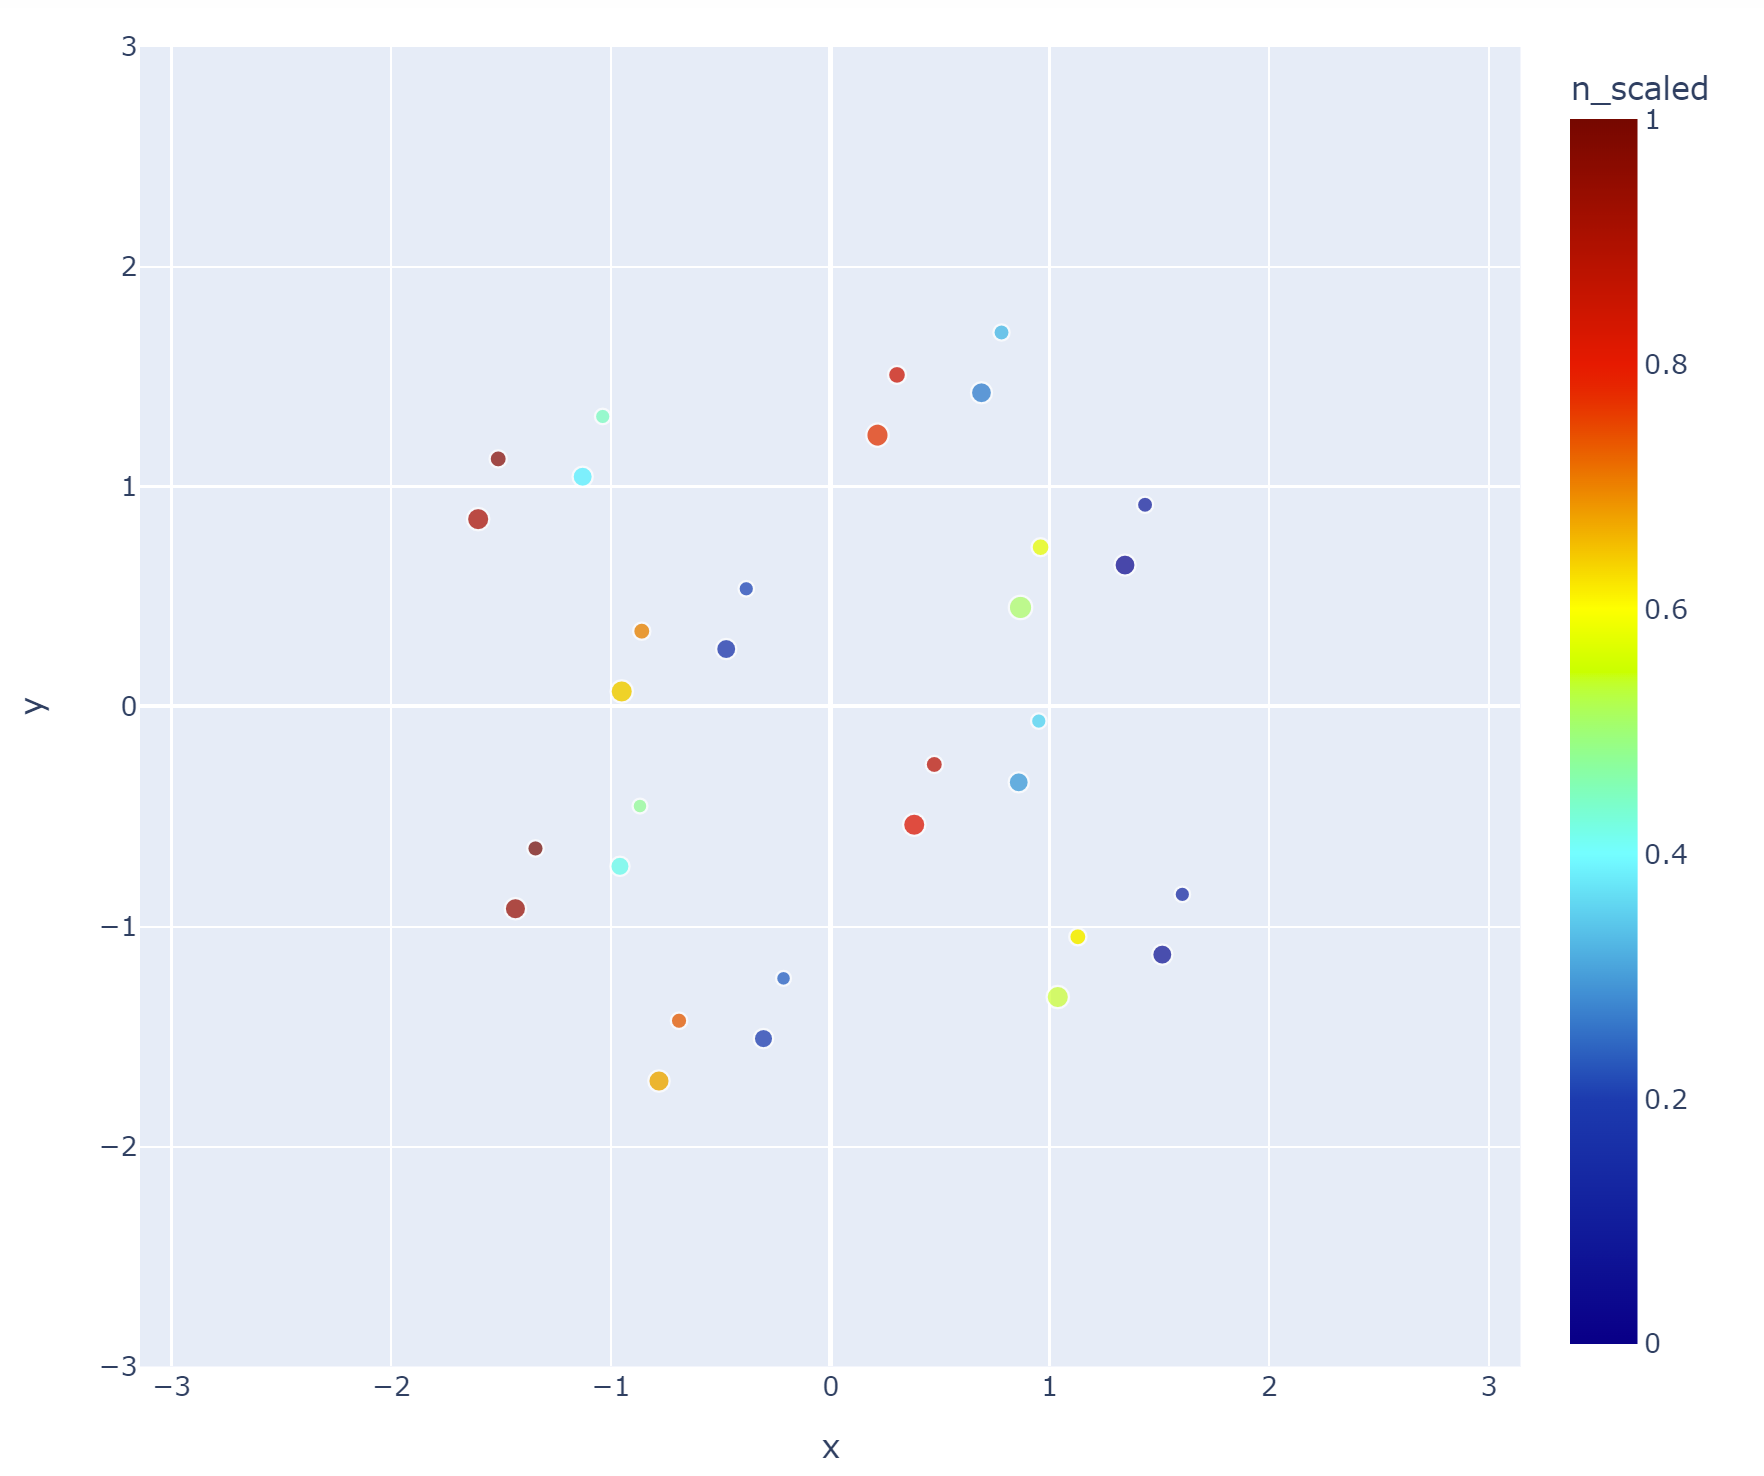
To visualize vector field vf of the same dimension (in the same feature space):
ndv = dt(f, vf)
ndv.display_quiver(color='z_scaled')
Also check examples:
dt().display()
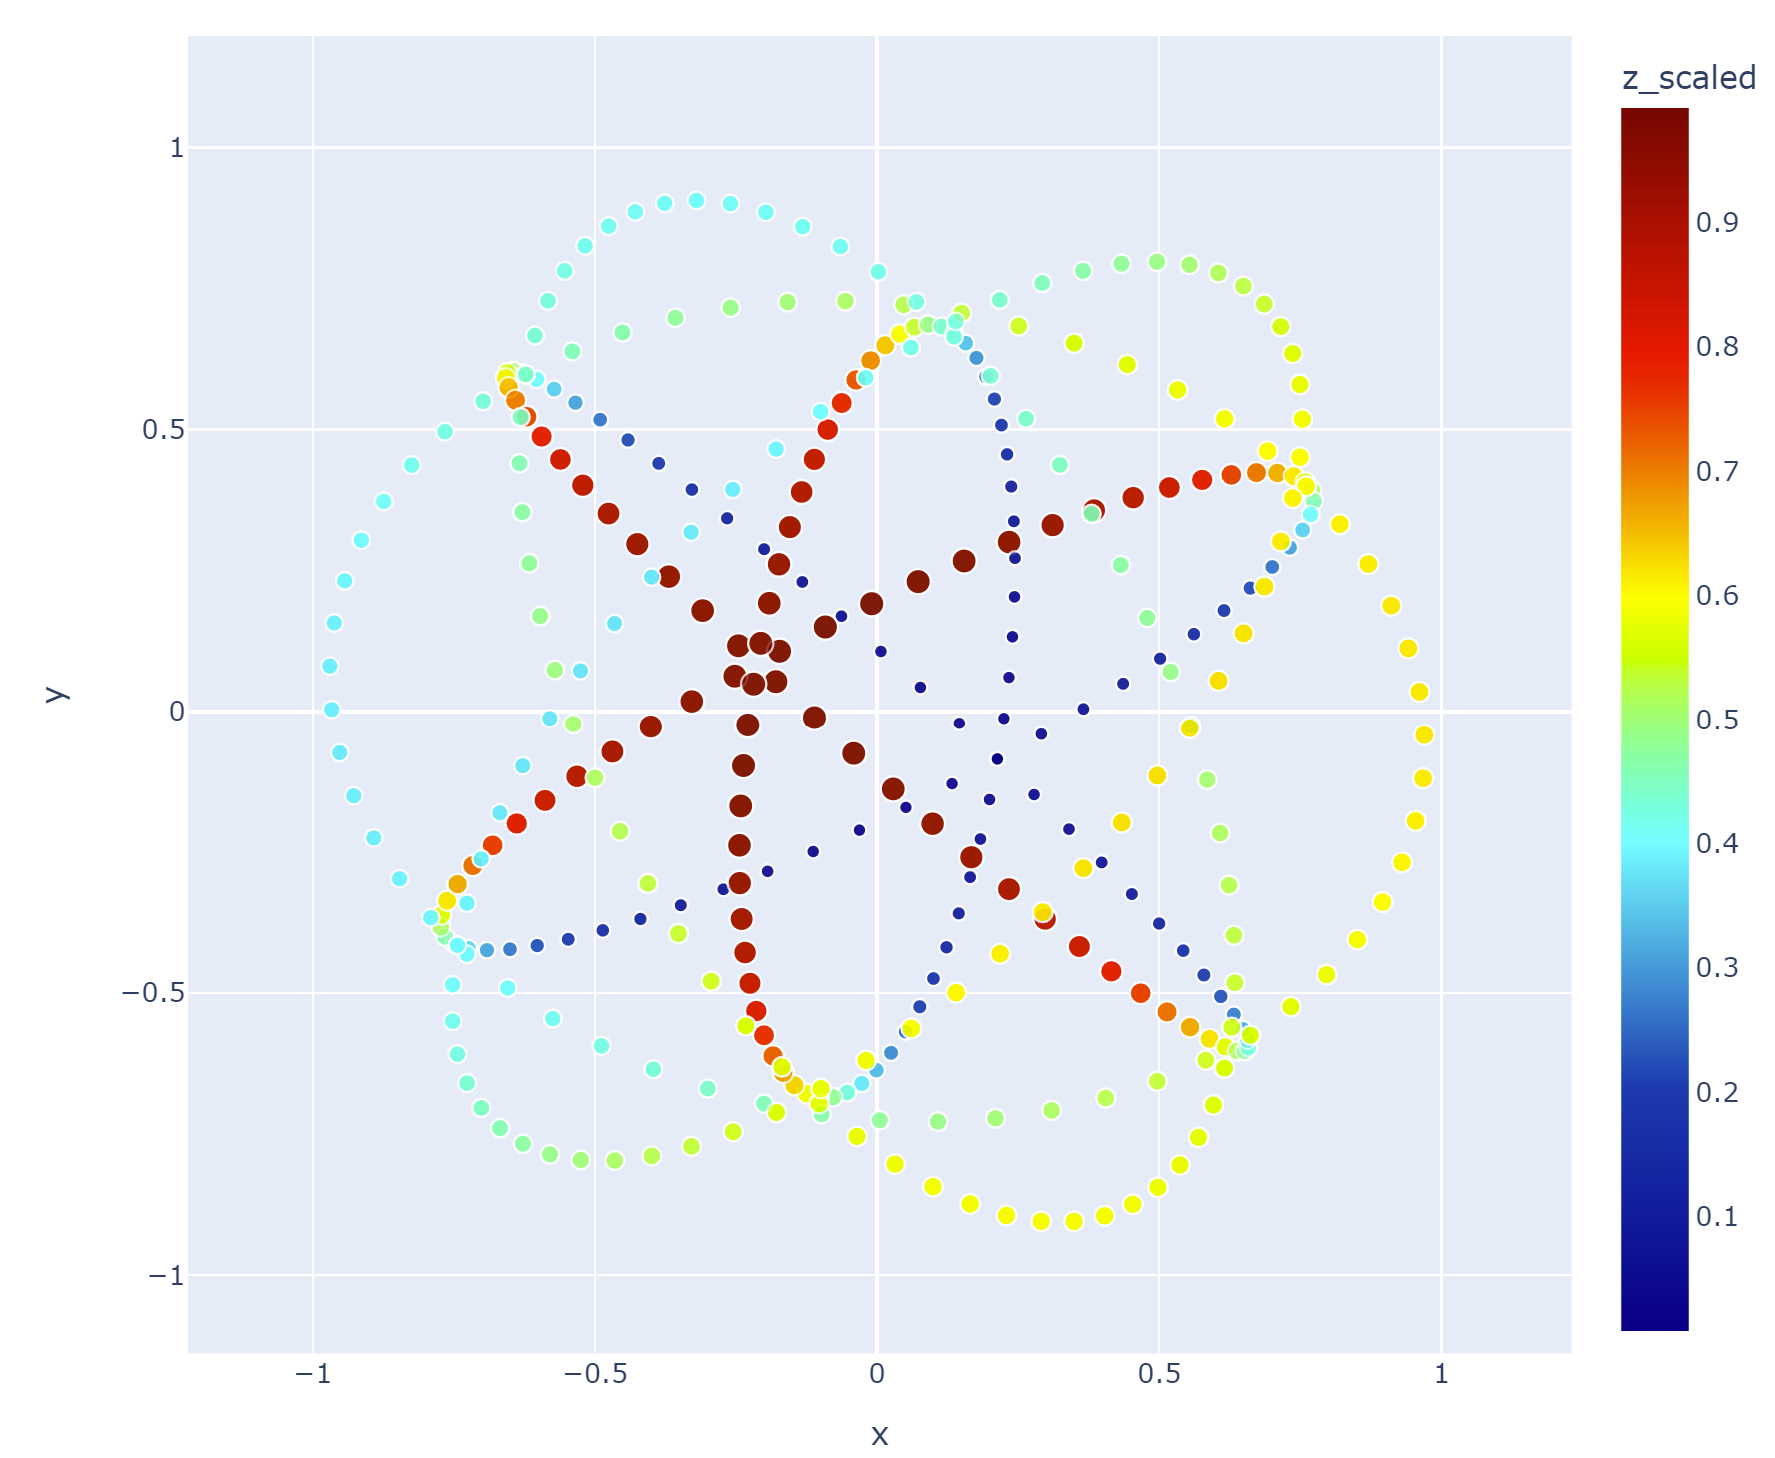
ndv = dt(example='sphere', n_subsample=0)
ndv.display(color='z_scaled')
Installation
Available via pip:
pip install datatour
Usage
If you have array of feature vectors f: shape(shape)==(n_smpl, n_dim), you can create data tour object, and display it:
from datatour import DataTour as dt

ndv = dt(f)
ndv.display()
By default, selects randomly n_subsample=500 samples for efficiency reason.
To visualize vector field vf of the same dimension (in the same feature space):
ndv = dt(f, vf)
ndv.display_quiver(color='z_scaled')
Also check examples:
dt().display()
ndv = dt(example='sphere', n_subsample=0)
ndv.display(color='z_scaled')
Licence
Distributed under BSD 3 licence
Project details
Verified details
These details have been verified by PyPIProject links
GitHub Statistics
Maintainers


Download files
Download the file for your platform. If you're not sure which to choose, learn more about installing packages.
Source Distribution
Built Distribution
Filter files by name, interpreter, ABI, and platform.
If you're not sure about the file name format, learn more about wheel file names.
Copy a direct link to the current filters
File details
Details for the file datatour-0.2.9.tar.gz.
File metadata
- Download URL: datatour-0.2.9.tar.gz
- Upload date:
- Size: 1.3 MB
- Tags: Source
- Uploaded using Trusted Publishing? Yes
- Uploaded via: twine/6.1.0 CPython/3.13.7
File hashes
| Algorithm | Hash digest | |
|---|---|---|
| SHA256 |
c1bfbd41fef69923d60eb8143c65649d4157910f3500a8f004b080f2cb12639a
|
|
| MD5 |
8b3c56b2a03bd639ffdd92be80644656
|
|
| BLAKE2b-256 |
56735f2a23497df6ee1e5b1af3d8bec16ea058555341a0f2eeaf2c830a4e4fd1
|
Provenance
The following attestation bundles were made for datatour-0.2.9.tar.gz:
Publisher:
ci.yml on neworldemancer/datatour_pkg
-
Statement:
-
Statement type:
https://in-toto.io/Statement/v1 -
Predicate type:
https://docs.pypi.org/attestations/publish/v1 -
Subject name:
datatour-0.2.9.tar.gz -
Subject digest:
c1bfbd41fef69923d60eb8143c65649d4157910f3500a8f004b080f2cb12639a - Sigstore transparency entry: 843956084
- Sigstore integration time:
-
Permalink:
neworldemancer/datatour_pkg@58024b113b7ffd67a983bb68a75d97ebc0db834d -
Branch / Tag:
refs/tags/v0.2.9 - Owner: https://github.com/neworldemancer
-
Access:
public
-
Token Issuer:
https://token.actions.githubusercontent.com -
Runner Environment:
github-hosted -
Publication workflow:
ci.yml@58024b113b7ffd67a983bb68a75d97ebc0db834d -
Trigger Event:
push
-
Statement type:
File details
Details for the file datatour-0.2.9-py3-none-any.whl.
File metadata
- Download URL: datatour-0.2.9-py3-none-any.whl
- Upload date:
- Size: 12.3 kB
- Tags: Python 3
- Uploaded using Trusted Publishing? Yes
- Uploaded via: twine/6.1.0 CPython/3.13.7
File hashes
| Algorithm | Hash digest | |
|---|---|---|
| SHA256 |
7943e1bc42f07bb5de9b117819525c481ef200dbd925d333505e35b6029d8e35
|
|
| MD5 |
50a2c68bd53d5a0449c915a30e869fd9
|
|
| BLAKE2b-256 |
dfaa874d8dac7db52f5a4b3edee48aff573d3a7154cb6f0f0a07b42af7c5b378
|
Provenance
The following attestation bundles were made for datatour-0.2.9-py3-none-any.whl:
Publisher:
ci.yml on neworldemancer/datatour_pkg
-
Statement:
-
Statement type:
https://in-toto.io/Statement/v1 -
Predicate type:
https://docs.pypi.org/attestations/publish/v1 -
Subject name:
datatour-0.2.9-py3-none-any.whl -
Subject digest:
7943e1bc42f07bb5de9b117819525c481ef200dbd925d333505e35b6029d8e35 - Sigstore transparency entry: 843956086
- Sigstore integration time:
-
Permalink:
neworldemancer/datatour_pkg@58024b113b7ffd67a983bb68a75d97ebc0db834d -
Branch / Tag:
refs/tags/v0.2.9 - Owner: https://github.com/neworldemancer
-
Access:
public
-
Token Issuer:
https://token.actions.githubusercontent.com -
Runner Environment:
github-hosted -
Publication workflow:
ci.yml@58024b113b7ffd67a983bb68a75d97ebc0db834d -
Trigger Event:
push
-
Statement type:


