Debug probe Model Context Protocol server for AI agents and developer tooling
Verified details
These details have been verified by PyPIProject links
GitHub Statistics
Maintainers

Project description
Debug Probe MCP Server


A stateful debug probe Model Context Protocol (MCP) server for developer tooling and AI agents. Works out of the box with Claude Code and any MCP-compatible runtime. Communicates over stdio and drives on-chip debug probes (J-Link first, OpenOCD and pyOCD planned) to flash, debug, and inspect embedded targets.
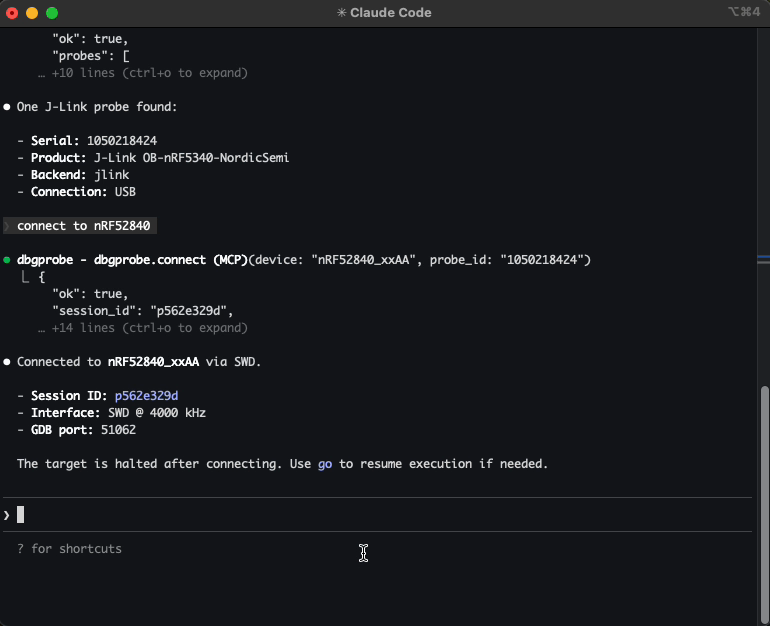
Example: Let Claude Code list attached J-Link probes, connect to your nRF52840, flash a new firmware, read memory, and reset the target — all conversationally.
Demo
Video walkthrough — connecting to a J-Link probe, flashing firmware, loading ELF and SVD for symbol-aware debugging, RTT logging, and breakpoints.
Why this exists
If you've ever typed J-Link Commander commands by hand, copy-pasted memory addresses between a datasheet and a terminal, re-flashed the same firmware 20 times during a debug session, and juggled multiple tool windows — this is for you.
You have a microcontroller on a debug probe. You want an AI agent to interact with it — connect, flash firmware, read/write memory, reset, halt, resume. This server makes that possible.
It gives any MCP-compatible agent a full set of debug probe tools. The agent calls these tools, gets structured JSON back, and reasons about what to do next — without you manually driving JLinkExe for every operation.
What agents can do with it:
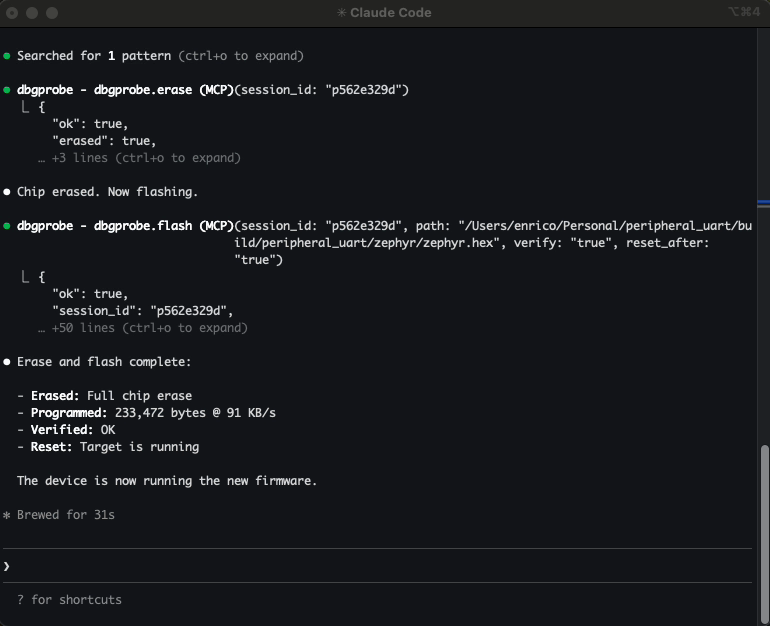
- Flash and iterate — build firmware, flash it, reset, check behavior — all in one conversation
- Inspect memory — read peripheral registers, check RAM contents, verify flash writes
- Debug interactively — halt, step, set breakpoints, inspect state, resume
- Automate test flows — flash → reset → read output → validate
- Multi-probe setups — connect to multiple probes simultaneously, each with its own session
Who is this for?
- Embedded engineers — faster iteration: flash, debug, inspect memory conversationally
- Hobbyists and makers — interact with microcontrollers without learning JLinkExe command syntax
- QA and test engineers — automated flash-and-test sequences across multiple boards
- Researchers — systematic exploration of embedded systems, register inspection
Quickstart (Claude Code)
pip install dbgprobe-mcp-server

# Register the MCP server with Claude Code
claude mcp add dbgprobe -- dbgprobe_mcp

# Or with explicit J-Link path
claude mcp add dbgprobe \
  -e DBGPROBE_JLINK_PATH=/Applications/SEGGER/JLink/JLinkExe \
  -- dbgprobe_mcp
Then in Claude Code, try:
"List attached debug probes, connect to the J-Link, and read 16 bytes from address 0x20000000."
Supported backends
| Backend | Status | Probe hardware |
|---|---|---|
| J-Link | Working (v0) | SEGGER J-Link (EDU, EDU Mini, PLUS, PRO, etc.) |
| OpenOCD | Planned | ST-Link, CMSIS-DAP, and many others |
| pyOCD | Planned | CMSIS-DAP, ST-Link, J-Link (via pyOCD) |
The server is backend-agnostic — tool names (dbgprobe.*) stay the same regardless of which probe you use.
J-Link requirements
Install the SEGGER J-Link Software Pack. The server auto-detects JLinkExe on PATH or in common install locations:
- macOS:
/Applications/SEGGER/JLink/ - Linux:
/opt/SEGGER/JLink/,/usr/bin/ - Windows:
C:\Program Files\SEGGER\JLink\
Or set DBGPROBE_JLINK_PATH to point to the executable directly.
This project is not affiliated with or sponsored by SEGGER. J-Link is used because it's widely available and well-supported.
Tools
| Category | Tools |
|---|---|
| Probe | dbgprobe.probes.list, dbgprobe.connect, dbgprobe.erase, dbgprobe.disconnect, dbgprobe.reset, dbgprobe.halt, dbgprobe.go, dbgprobe.step, dbgprobe.status, dbgprobe.flash, dbgprobe.mem.read, dbgprobe.mem.write, dbgprobe.breakpoint.set, dbgprobe.breakpoint.clear, dbgprobe.breakpoint.list |
| Introspection | dbgprobe.connections.list |
| ELF | dbgprobe.elf.attach, dbgprobe.elf.info, dbgprobe.elf.lookup, dbgprobe.elf.symbols |
| SVD | dbgprobe.svd.attach, dbgprobe.svd.info, dbgprobe.svd.read, dbgprobe.svd.write, dbgprobe.svd.set_field, dbgprobe.svd.update_fields, dbgprobe.svd.list_peripherals, dbgprobe.svd.list_registers, dbgprobe.svd.list_fields, dbgprobe.svd.describe |
| RTT | dbgprobe.rtt.start, dbgprobe.rtt.stop, dbgprobe.rtt.read, dbgprobe.rtt.write, dbgprobe.rtt.status |
| Plugins | dbgprobe.plugin.list, dbgprobe.plugin.template, dbgprobe.plugin.load, dbgprobe.plugin.reload |
| Tracing | dbgprobe.trace.status, dbgprobe.trace.tail |
See docs/tools.md for full schemas and examples.
Install (development)
# Editable install from repo root
pip install -e ".[test]"

# Or with uv
uv pip install -e ".[test]"
Add to Claude Code
# Standard setup
claude mcp add dbgprobe -- dbgprobe_mcp

# With default target device
claude mcp add dbgprobe \
  -e DBGPROBE_JLINK_DEVICE=nRF52840_xxAA \
  -- dbgprobe_mcp

# Debug logging
claude mcp add dbgprobe -e DBGPROBE_MCP_LOG_LEVEL=DEBUG -- dbgprobe_mcp
MCP is a protocol. Claude Code is one MCP client; other agent runtimes can also connect to this server.
Environment variables
Server
| Variable | Default | Description |
|---|---|---|
DBGPROBE_BACKEND |
jlink |
Debug probe backend. Future: openocd, pyocd. |
DBGPROBE_MCP_LOG_LEVEL |
WARNING |
Python log level (DEBUG, INFO, WARNING, ERROR). Logs go to stderr. |
DBGPROBE_MCP_TRACE |
enabled | JSONL tracing of every tool call. Set to 0, false, or no to disable. |
DBGPROBE_MCP_TRACE_PAYLOADS |
disabled | Include memory data payloads in traced args (stripped by default). |
DBGPROBE_MCP_TRACE_MAX_BYTES |
16384 |
Max payload chars before truncation (only when TRACE_PAYLOADS is on). |
DBGPROBE_MCP_PLUGINS |
disabled | Plugin policy: all or comma-separated plugin names (e.g. nrf52,stm32). |
J-Link backend
| Variable | Default | Description |
|---|---|---|
DBGPROBE_JLINK_PATH |
auto-detect | Explicit path to JLinkExe (or JLink.exe on Windows). |
DBGPROBE_JLINK_GDBSERVER_PATH |
auto-detect | Explicit path to JLinkGDBServerCLExe. |
DBGPROBE_JLINK_DEVICE |
(none) | Default target device string (e.g. nRF52840_xxAA). Can be overridden per-session. |
DBGPROBE_INTERFACE |
SWD |
Debug interface: SWD or JTAG. |
DBGPROBE_SPEED_KHZ |
4000 |
Interface clock speed in kHz. |
DBGPROBE_GDB_TRACE |
disabled | Log all GDB RSP packets to file. Set to 1, true, or yes to enable. |
DBGPROBE_GDB_TRACE_FILE |
/tmp/gdb_trace.log |
Path for GDB RSP trace log (only when GDB_TRACE is on). |
ELF Support
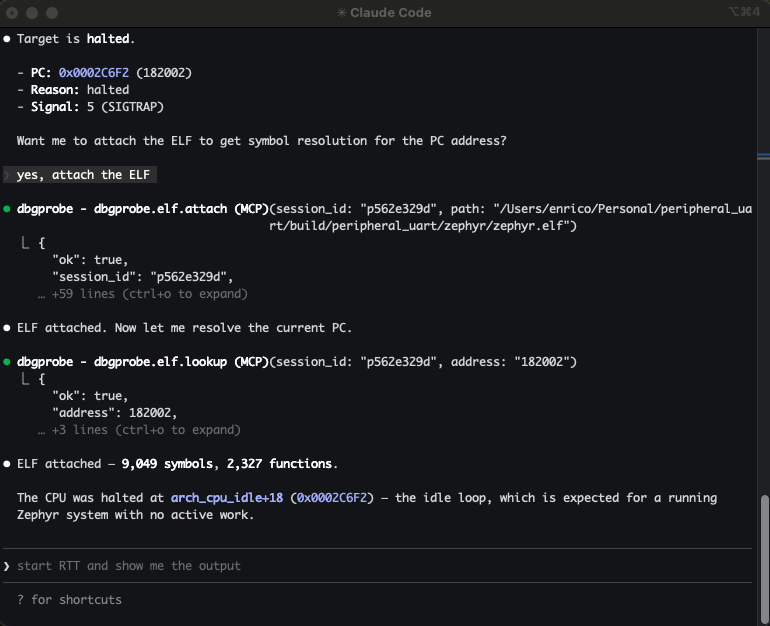
Attach an ELF file to a session to enable symbol-aware debugging:
- Symbol lookup — resolve function names to addresses and vice versa
- Breakpoints by name —
breakpoint.set(symbol="main")instead of raw addresses - Auto-enriched responses —
status,step, andhaltincludesymbol+symbol_offsetwhen an ELF is attached - Flash integration — flashing an
.elfauto-attaches it; flashing.hex/.binauto-reloads a previously attached ELF; sibling.elffiles are suggested via hints
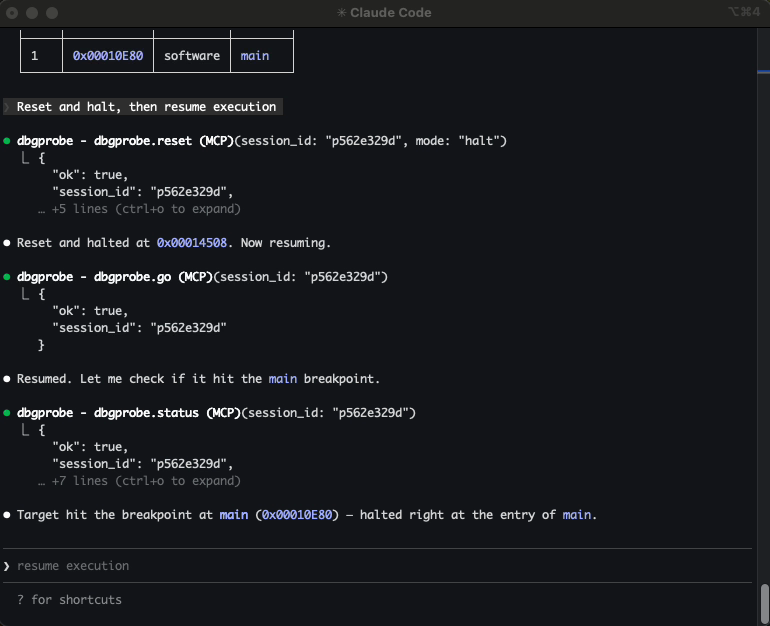
> "Attach the ELF, set a breakpoint on main, run, and show me where it halted."
The agent calls elf.attach, breakpoint.set(symbol="main"), go, then status — and gets back "halted at main+0" instead of a raw hex address.
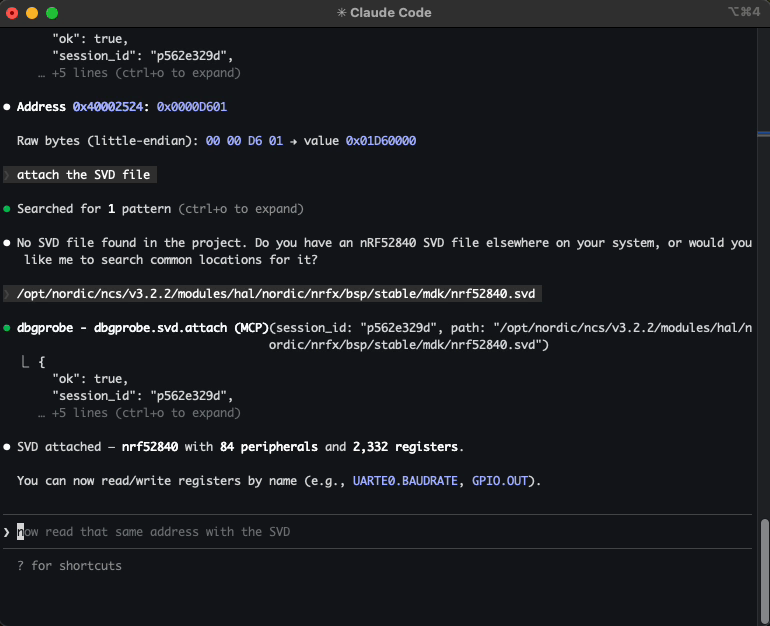
SVD Support
Attach an SVD (System View Description) file to a session to enable register-level peripheral access:
- Named register reads —
svd.read("GPIO.OUT")returns the raw value and all decoded fields with enum names - Field-level reads —
svd.read("GPIO.PIN_CNF[3].PULL")returns the field value and enum name ("PullUp") - Safe field writes —
svd.set_field("GPIO.PIN_CNF[3].PULL", "PullUp")does read-modify-write - Batch field updates —
svd.update_fields("GPIO.PIN_CNF[3]", {"DIR": "Output", "PULL": "PullUp"})— one read, one write - Raw register writes —
svd.write("GPIO.OUT", 0x01)— full register, no RMW - Discovery — list peripherals, registers, fields; describe with enums
- Auto-decode on mem.read — when an SVD is attached and
mem.readhits a known register address, the response includes decoded fields
> "Attach the SVD, read GPIO.PIN_CNF[3], and set PULL to PullUp."
The agent calls svd.attach, svd.read("GPIO.PIN_CNF[3]"), then svd.set_field("GPIO.PIN_CNF[3].PULL", "PullUp") — and gets back decoded field values instead of raw hex.
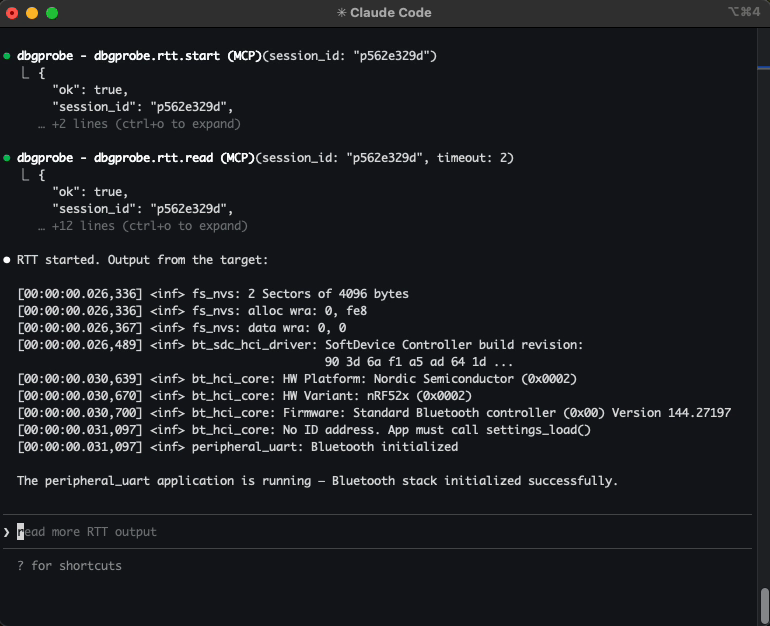
RTT (Real-Time Transfer)
Start, stop, read, and write to SEGGER RTT channels. The agent can stream target log output and send data to the device — useful for debugging firmware that prints over RTT instead of UART.
> "Start RTT and show me the output."
For repetitive flows — read device ID, run a self-test sequence, validate calibration — you can package them as plugins: Python modules that expose custom tools the agent can call directly. Enable with DBGPROBE_MCP_PLUGINS=all. See the nrf52_info example.
Tracing
Every tool call is traced to .dbgprobe_mcp/traces/trace.jsonl and an in-memory ring buffer (last 2000 events). Tracing is on by default — set DBGPROBE_MCP_TRACE=0 to disable.
Use dbgprobe.trace.status and dbgprobe.trace.tail to inspect the trace without reading the file directly.
Try without an agent
You can test the server interactively using the MCP Inspector:
npx @modelcontextprotocol/inspector python -m dbgprobe_mcp_server
Roadmap / TODO
- OpenOCD backend — support ST-Link, CMSIS-DAP, and other probes via OpenOCD subprocess
- pyOCD backend — native Python probe access via pyOCD library
- Multi-core support — target specific cores on multi-core SoCs
- Cortex-A/R support — ARM-mode breakpoints (
kind=4); currently Thumb-only (Cortex-M)
Known limitations
- Single-client only. The server handles one MCP session at a time (stdio transport).
- RTT channel 0 only. RTT support is limited to channel 0 (terminal). Multi-channel RTT is a future enhancement.
- Flash clears breakpoints. Flashing new firmware invalidates breakpoints (the code at those addresses may have changed). The session stays alive but breakpoints are cleared.
- Cortex-M only. Breakpoints use Thumb-mode (
kind=2). Cortex-A/R targets (ARM-mode,kind=4) are not yet supported. - Instruction-level step only.
dbgprobe.stepsingle-steps one CPU instruction. Source-level stepping (step into/over/out) is not supported.
Safety
This server connects an AI agent to real debug hardware. That's the point — and it means the stakes are higher than pure-software tools.
Plugins execute arbitrary code. When plugins are enabled, the agent can create and run Python code on your machine with full server privileges. Review agent-generated plugins before loading them.
Writes affect real hardware. A bad memory write or flash operation can brick a device, wipe calibration data, or trigger unintended behavior. Consider what the agent can reach.
Use tool approval deliberately. When your MCP client prompts you to approve a tool call, consider whether you want to allow it once or always.
This software is provided as-is under the MIT License. You are responsible for what the agent does with your hardware.
License
This project is licensed under the MIT License — see LICENSE for details.
Project details
Verified details
These details have been verified by PyPIProject links
GitHub Statistics
Maintainers


Download files
Download the file for your platform. If you're not sure which to choose, learn more about installing packages.
Source Distribution
Built Distribution
Filter files by name, interpreter, ABI, and platform.
If you're not sure about the file name format, learn more about wheel file names.
Copy a direct link to the current filters
File details
Details for the file dbgprobe_mcp_server-0.1.0.tar.gz.
File metadata
- Download URL: dbgprobe_mcp_server-0.1.0.tar.gz
- Upload date:
- Size: 637.5 kB
- Tags: Source
- Uploaded using Trusted Publishing? Yes
- Uploaded via: twine/6.1.0 CPython/3.13.7
File hashes
| Algorithm | Hash digest | |
|---|---|---|
| SHA256 |
e03125edc6500a502a251405eb5f314c0ec384724bdc4d4075169319817eaed6
|
|
| MD5 |
cff98e6be6b7f3c39cf359a64a50d7da
|
|
| BLAKE2b-256 |
3b405a988814d0ba6f814994cd4f95b1e72c9cf26de7c68910c079df52906595
|
Provenance
The following attestation bundles were made for dbgprobe_mcp_server-0.1.0.tar.gz:
Publisher:
cicd.yml on es617/dbgprobe-mcp-server
-
Statement:
-
Statement type:
https://in-toto.io/Statement/v1 -
Predicate type:
https://docs.pypi.org/attestations/publish/v1 -
Subject name:
dbgprobe_mcp_server-0.1.0.tar.gz -
Subject digest:
e03125edc6500a502a251405eb5f314c0ec384724bdc4d4075169319817eaed6 - Sigstore transparency entry: 1008254694
- Sigstore integration time:
-
Permalink:
es617/dbgprobe-mcp-server@1fef7c9beae9b2bd29fc189e59b00919b7c52b3f -
Branch / Tag:
refs/tags/v0.1.0 - Owner: https://github.com/es617
-
Access:
public
-
Token Issuer:
https://token.actions.githubusercontent.com -
Runner Environment:
github-hosted -
Publication workflow:
cicd.yml@1fef7c9beae9b2bd29fc189e59b00919b7c52b3f -
Trigger Event:
push
-
Statement type:
File details
Details for the file dbgprobe_mcp_server-0.1.0-py3-none-any.whl.
File metadata
- Download URL: dbgprobe_mcp_server-0.1.0-py3-none-any.whl
- Upload date:
- Size: 65.7 kB
- Tags: Python 3
- Uploaded using Trusted Publishing? Yes
- Uploaded via: twine/6.1.0 CPython/3.13.7
File hashes
| Algorithm | Hash digest | |
|---|---|---|
| SHA256 |
128160a45d7a7a84c522f89fafd22b64b66c8fc4f583d947988e3c25309b44f1
|
|
| MD5 |
32c2e16b5705dedbe5e7446b938b3fe7
|
|
| BLAKE2b-256 |
fe2748b8ee3810efa9be2adf3d0bcf6b201b8c02c23ffc8e7c4178c5e17e24c9
|
Provenance
The following attestation bundles were made for dbgprobe_mcp_server-0.1.0-py3-none-any.whl:
Publisher:
cicd.yml on es617/dbgprobe-mcp-server
-
Statement:
-
Statement type:
https://in-toto.io/Statement/v1 -
Predicate type:
https://docs.pypi.org/attestations/publish/v1 -
Subject name:
dbgprobe_mcp_server-0.1.0-py3-none-any.whl -
Subject digest:
128160a45d7a7a84c522f89fafd22b64b66c8fc4f583d947988e3c25309b44f1 - Sigstore transparency entry: 1008254698
- Sigstore integration time:
-
Permalink:
es617/dbgprobe-mcp-server@1fef7c9beae9b2bd29fc189e59b00919b7c52b3f -
Branch / Tag:
refs/tags/v0.1.0 - Owner: https://github.com/es617
-
Access:
public
-
Token Issuer:
https://token.actions.githubusercontent.com -
Runner Environment:
github-hosted -
Publication workflow:
cicd.yml@1fef7c9beae9b2bd29fc189e59b00919b7c52b3f -
Trigger Event:
push
-
Statement type:


