Python library for implementing dead band

Project description
📦 dead_band


A Python library leveraging Cython for the implementation of deadband algorithms and related techniques, with the objective of optimizing data throughput and minimizing unnecessary data processing.
Installation
Linux (Ubuntu/Debian)
# Install gcc, make, and Python headers
sudo apt update
sudo apt install build-essential python3-dev

# Install the library
pip install dead-band
Windows
:: Install C++ build tools from:
:: https://visualstudio.microsoft.com/visual-cpp-build-tools/
:: Select "Desktop development with C++" during setup

:: After installation, restart your computer if needed

:: Then install the library
pip install dead-band
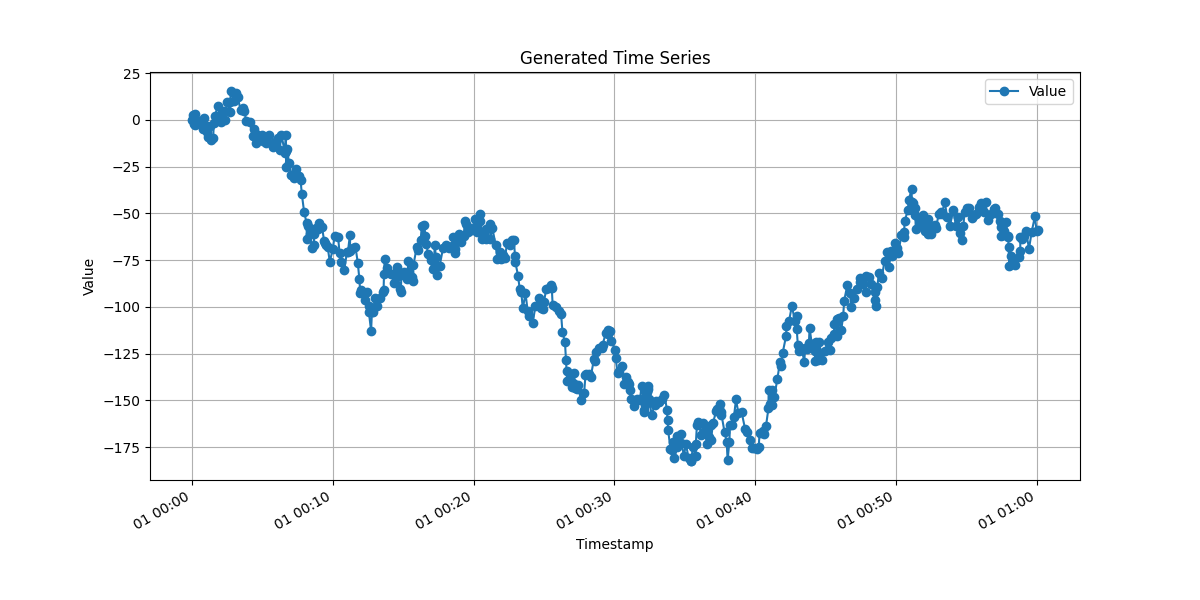
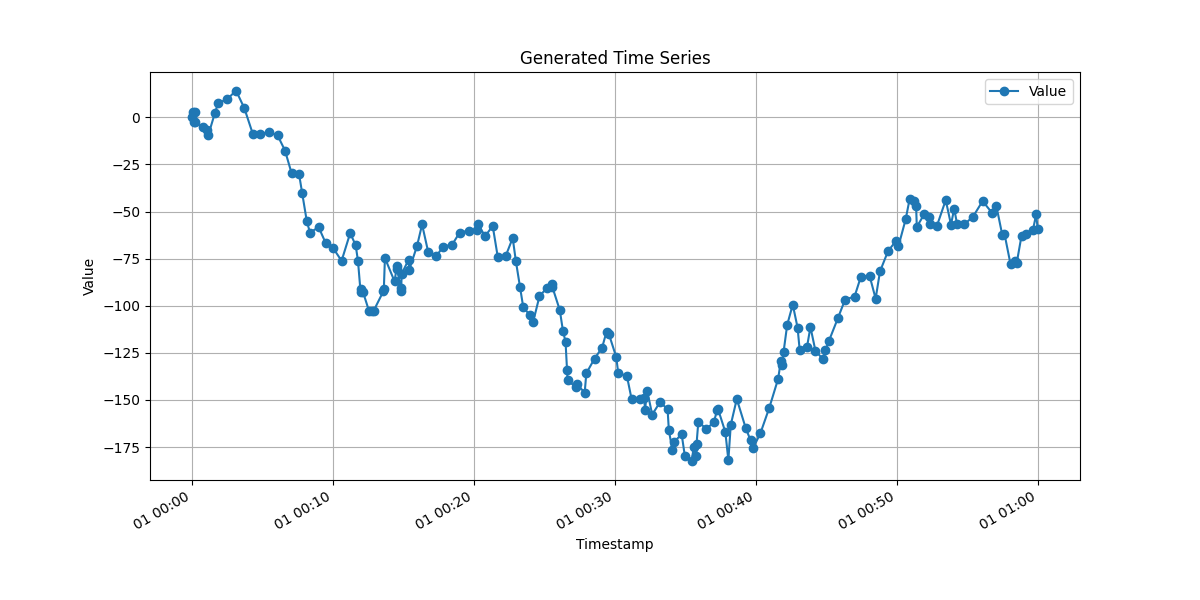
Examples: Before and After Deadband Processing
Raw Data
Compressed Data
How it works
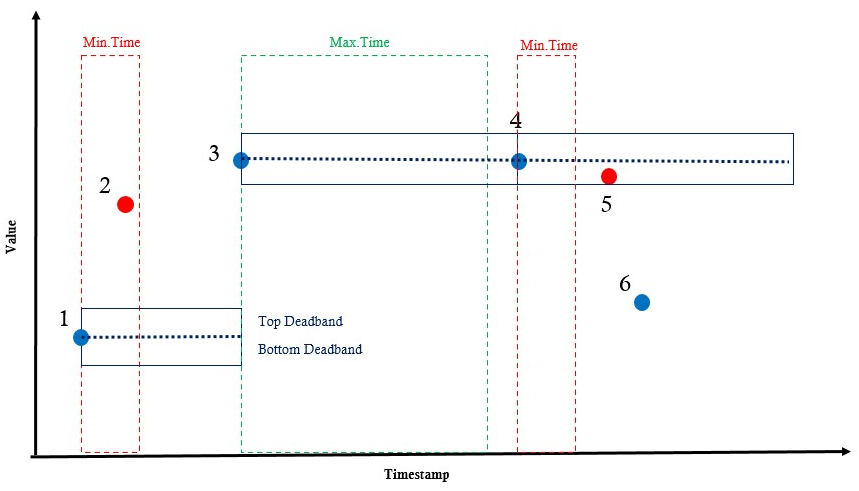
- Point 1: The first point is always saved.
- Point 2: Not saved, as the time difference is less than the minimum time interval.
- Point 3: Saved, as the value difference is greater than the deadband value.
- Point 4: Saved, as the time difference is greater than the maximum time interval.
- Point 5: Not saved, as the value difference is less than the deadband value.
- Point 6: Saved, as the value difference is greater than the deadband value.
Usage
Function apply_deadband
apply_deadband (series, deadband_value, max_time_interval, min_time_interval=0, time_unit='s', deadband_type='abs', save_on_quality_change=True, use_cython=True)

Applies a deadband filter to a time series, considering value variation, time intervals (in selectable units), and optional quality changes.

Args:
    series (list): List of tuples (value: float, timestamp: datetime.datetime, quality: Optional[int]). Quality can be omitted (value, timestamp) or included (value, timestamp, quality).
    deadband_value (float): Deadband threshold (absolute value or percentage, depending on deadband_type).
    max_time_interval (float): Maximum time interval (unit defined by time_unit) to force saving a new point.
    min_time_interval (float): Minimum time interval (unit defined by time_unit) to allow saving a new point even with small variation. Default is 0.
    time_unit (str): Unit for time intervals: 's' (seconds), 'ms' (milliseconds), or 'us' (microseconds). Default is 's'.
    deadband_type (str): 'abs' for absolute deadband or 'percent' for percentage-based deadband. Default is 'abs'.
    save_on_quality_change (bool): If True, saves a point whenever the quality changes compared to the last saved point. Only used when quality is provided in the series. Default is True.
    use_cython (bool): If True, uses the Cython implementation for performance. Default is True.

Returns:
    list: New list of tuples with the same structure as input (with or without quality) after applying the deadband filter.
Simple Usage
import pandas as pd
from datetime import datetime
from dead_band import apply_deadband

# 1. Create sample data
data = [
    (10.0, datetime(2023,1,1,12,0), 1),
    (10.2, datetime(2023,1,1,12,5), 1),
    (10.5, datetime(2023,1,1,12,10), 2),  # Quality change
    (10.5, datetime(2023,1,1,12,15), 2),
    (10.8, datetime(2023,1,1,12,20), 2),  # Variation > deadband
    (10.8, datetime(2023,1,1,12,25), 2),
    (10.8, datetime(2023,1,1,12,30), 3)   # Quality change
]

# 2. Apply deadband filter
filtered_data = apply_deadband(
    series=data,
    deadband_value=0.3,          # 0.3 unit deadband
    max_time_interval=1800,      # Force record every 30 minutes
    min_time_interval=300,       # Minimum 5 minutes between records
    time_unit='s',               # Time unit in seconds
    deadband_type='abs',         # Absolute deadband
    save_on_quality_change=True  # Save when quality changes
)

# 3. Convert to DataFrames
original_df = pd.DataFrame(data, columns=['value', 'timestamp', 'quality'])
filtered_df = pd.DataFrame(filtered_data, columns=['value', 'timestamp', 'quality'])

print("Original:", len(original_df), "points")
print("Filtered:", len(filtered_df), "points")
Expected Output
Original: 7 points
Filtered: 4 points
Multiples pathnames Usage
import pandas as pd
from datetime import datetime
from dead_band import apply_deadband

# 1. Create sample data with two different pathnames
data = [
    # Pathname "TAG001"
    (15.0, datetime(2023,1,1,8,0), 1, "TAG001"),
    (15.1, datetime(2023,1,1,8,5), 1, "TAG001"),
    (15.4, datetime(2023,1,1,8,10), 1, "TAG001"),  # Variation > deadband
    (15.4, datetime(2023,1,1,8,15), 2, "TAG001"),  # Quality change
    (15.4, datetime(2023,1,1,8,20), 2, "TAG001"),

    # Pathname "TAG002"
    (22.0, datetime(2023,1,1,8,0), 1, "TAG002"),
    (22.3, datetime(2023,1,1,8,5), 1, "TAG002"),  # Variation > deadband
    (22.3, datetime(2023,1,1,8,10), 1, "TAG002"),
    (22.8, datetime(2023,1,1,8,15), 1, "TAG002"),  # Variation > deadband
    (22.8, datetime(2023,1,1,8,20), 2, "TAG002")   # Quality change
]

# 2. Convert to DataFrame
df = pd.DataFrame(data, columns=['value', 'timestamp', 'quality', 'pathname'])

# 3. Apply deadband for each pathname
results = []
for pathname, group in df.groupby('pathname'):
    # Prepare data in (value, timestamp, quality) format
    series_data = group[['value', 'timestamp', 'quality']].values.tolist()

    # Apply filter
    filtered = apply_deadband(
        series=series_data,
        deadband_value=0.2,
        max_time_interval=600,  # 10 minutes
        save_on_quality_change=True
    )

    # Add pathname back to results
    filtered_df = pd.DataFrame(filtered, columns=['value', 'timestamp', 'quality'])
    filtered_df['pathname'] = pathname
    results.append(filtered_df)

# 4. Combine all results
final_df = pd.concat(results, ignore_index=True)

print("Results by pathname:")
print(final_df.groupby('pathname').size())

# Optional: Quick visualization
print("Filtered data:")
print(final_df.sort_values(['pathname', 'timestamp']))
Expected Output
Results by pathname:
pathname
TAG001    3
TAG002    4
Filtered data:
   value           timestamp  quality pathname
0   15.0 2023-01-01 08:00:00        1    TAG001
1   15.4 2023-01-01 08:10:00        1    TAG001
2   15.4 2023-01-01 08:15:00        2    TAG001
3   22.0 2023-01-01 08:00:00        1    TAG002
4   22.3 2023-01-01 08:05:00        1    TAG002
5   22.8 2023-01-01 08:15:00        1    TAG002
6   22.8 2023-01-01 08:20:00        2    TAG002
Benchmarks
| Environment | Hardware | Python Version | Points (Before → After) | CSV Size (Before → After) | Reduction | Duration |
|---|---|---|---|---|---|---|
| Ubuntu 24.04 LTS | Ryzen 5 3500x | Python 3.12 | 4,188,267 → 1,609,190 | 196.74MB → 75.59MB | ~60% | 1.0708s |
| Ubuntu 24.04 LTS | EC2 - t2.small | Python 3.12 | 4,188,267 → 1,609,190 | 196.74MB → 75.59MB | ~60% | 1.4055s |
Note:
The ~60% reduction in data volume was achieved using the selected parameters for the deadband filter. This percentage may vary depending on the chosen threshold and dataset characteristics.
Release history Release notifications | RSS feed


Download files
Download the file for your platform. If you're not sure which to choose, learn more about installing packages.
Source Distribution
dead_band-1.1.4.tar.gz
(72.6 kB
view details)
File details
Details for the file dead_band-1.1.4.tar.gz.
File metadata
- Download URL: dead_band-1.1.4.tar.gz
- Upload date:
- Size: 72.6 kB
- Tags: Source
- Uploaded using Trusted Publishing? No
- Uploaded via: poetry/2.1.3 CPython/3.12.10 Linux/6.11.0-1013-azure
File hashes
| Algorithm | Hash digest | |
|---|---|---|
| SHA256 |
65075a62fa071dfbd2ec0d4e3469a086d83f178af56290685035e0f5e550816c
|
|
| MD5 |
d5048319f14ebdd751662dd8c9d7074e
|
|
| BLAKE2b-256 |
f7ead121c1c5e4a521e355253143da8552e7914e87cbbb8a474f041d92f9aaa1
|


