Plotting time-series graphs in scipy's dendrogram

Project description
Scipy’s dendrogram for agglomerative clustering requires extensive customizations to make it more informative. This package wraps scipy’s dendrogram with two customizations:
Timeseries graph at the side
Distance labels and cluster split points
Installation
pip install dendrogram-tsExamples
Plot by Maximum Clusters
from dendrogram_ts import maxclust_draw

plt.style.use('seaborn-whitegrid')
plt.figure(figsize=(8,5));

maxclust_draw(df, 'ward', 'euclidean', max_cluster=10, ts_hspace=2)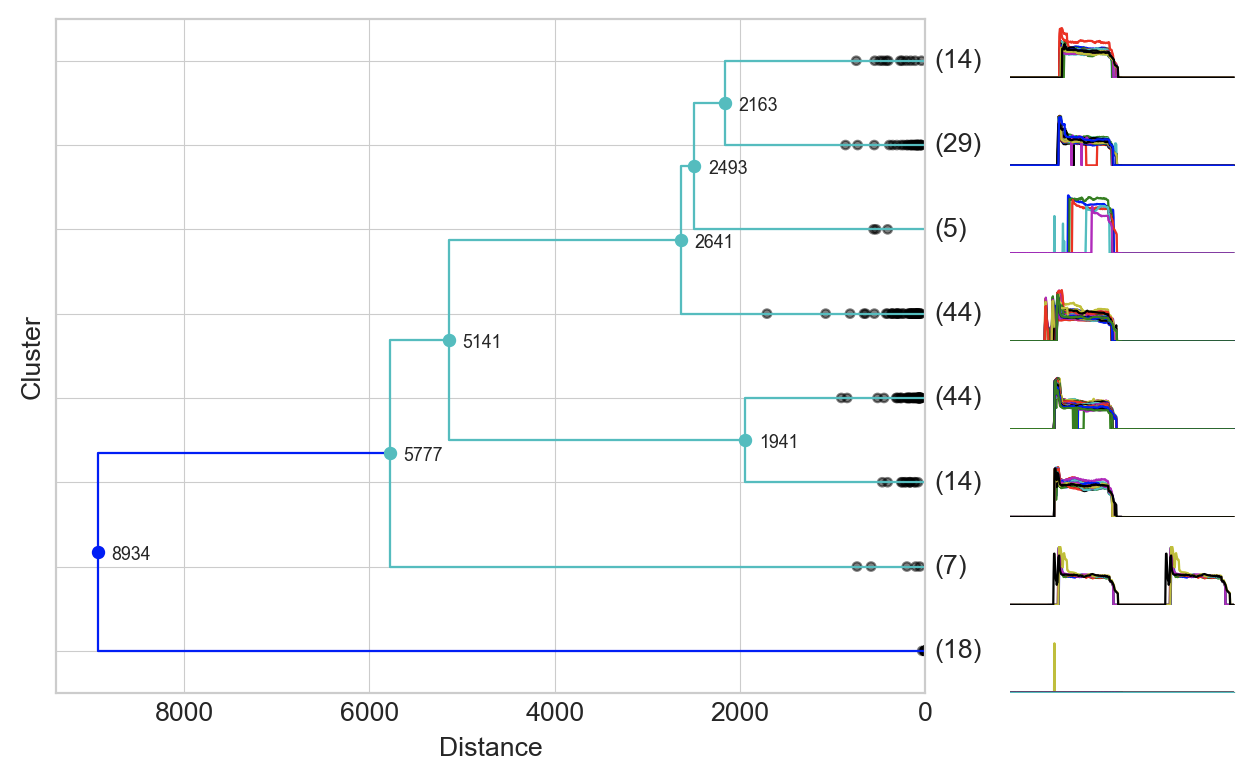
Plot by Color Threshold
from dendrogram_ts import colorclust_draw
import matplotlib as mpl

mpl.rcParams['lines.linewidth'] = 1
plt.style.use('seaborn-white')
plt.figure(figsize=(12,10))

colorclust_draw(df, method='ward', metric='euclidean', color_threshold=5200, ts_hspace=1)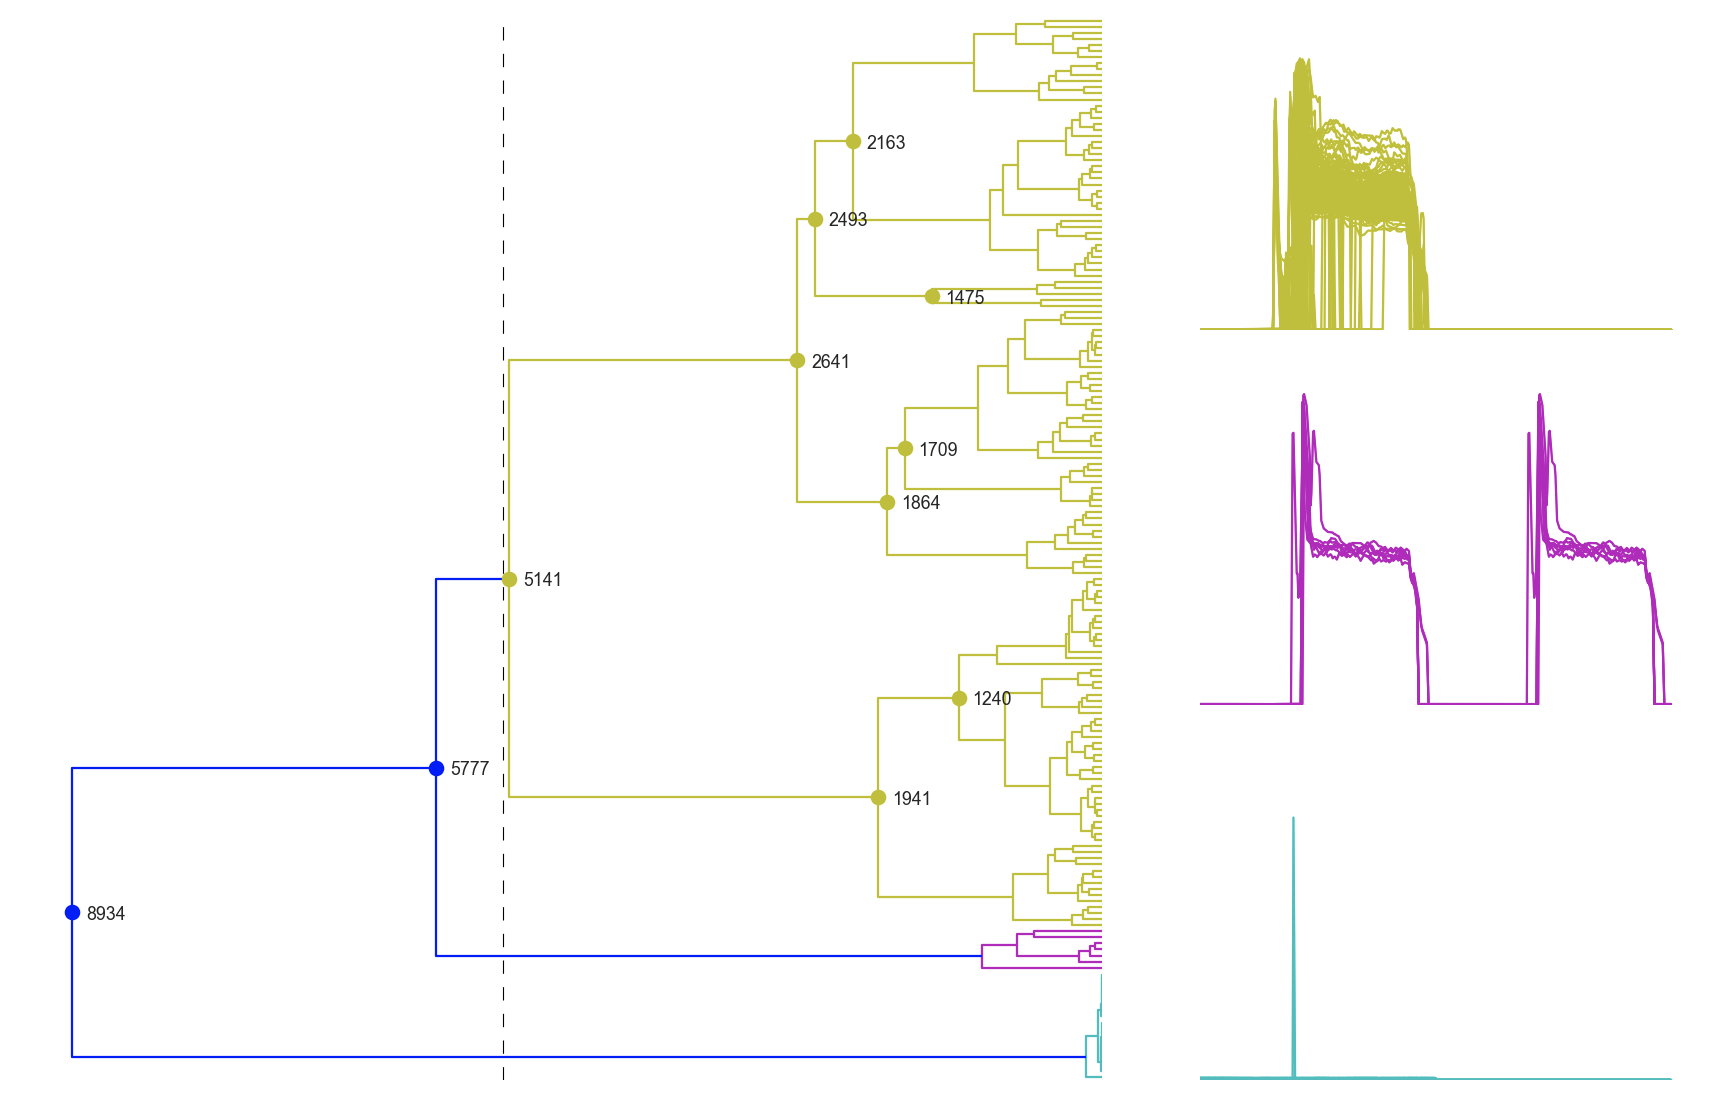
Plot All Clusters
from dendrogram_ts import allclust_draw

plt.style.use('seaborn-whitegrid')
plt.figure(figsize=(12,10))

allclust_draw(df, 'ward', 'euclidean', ts_hspace=5)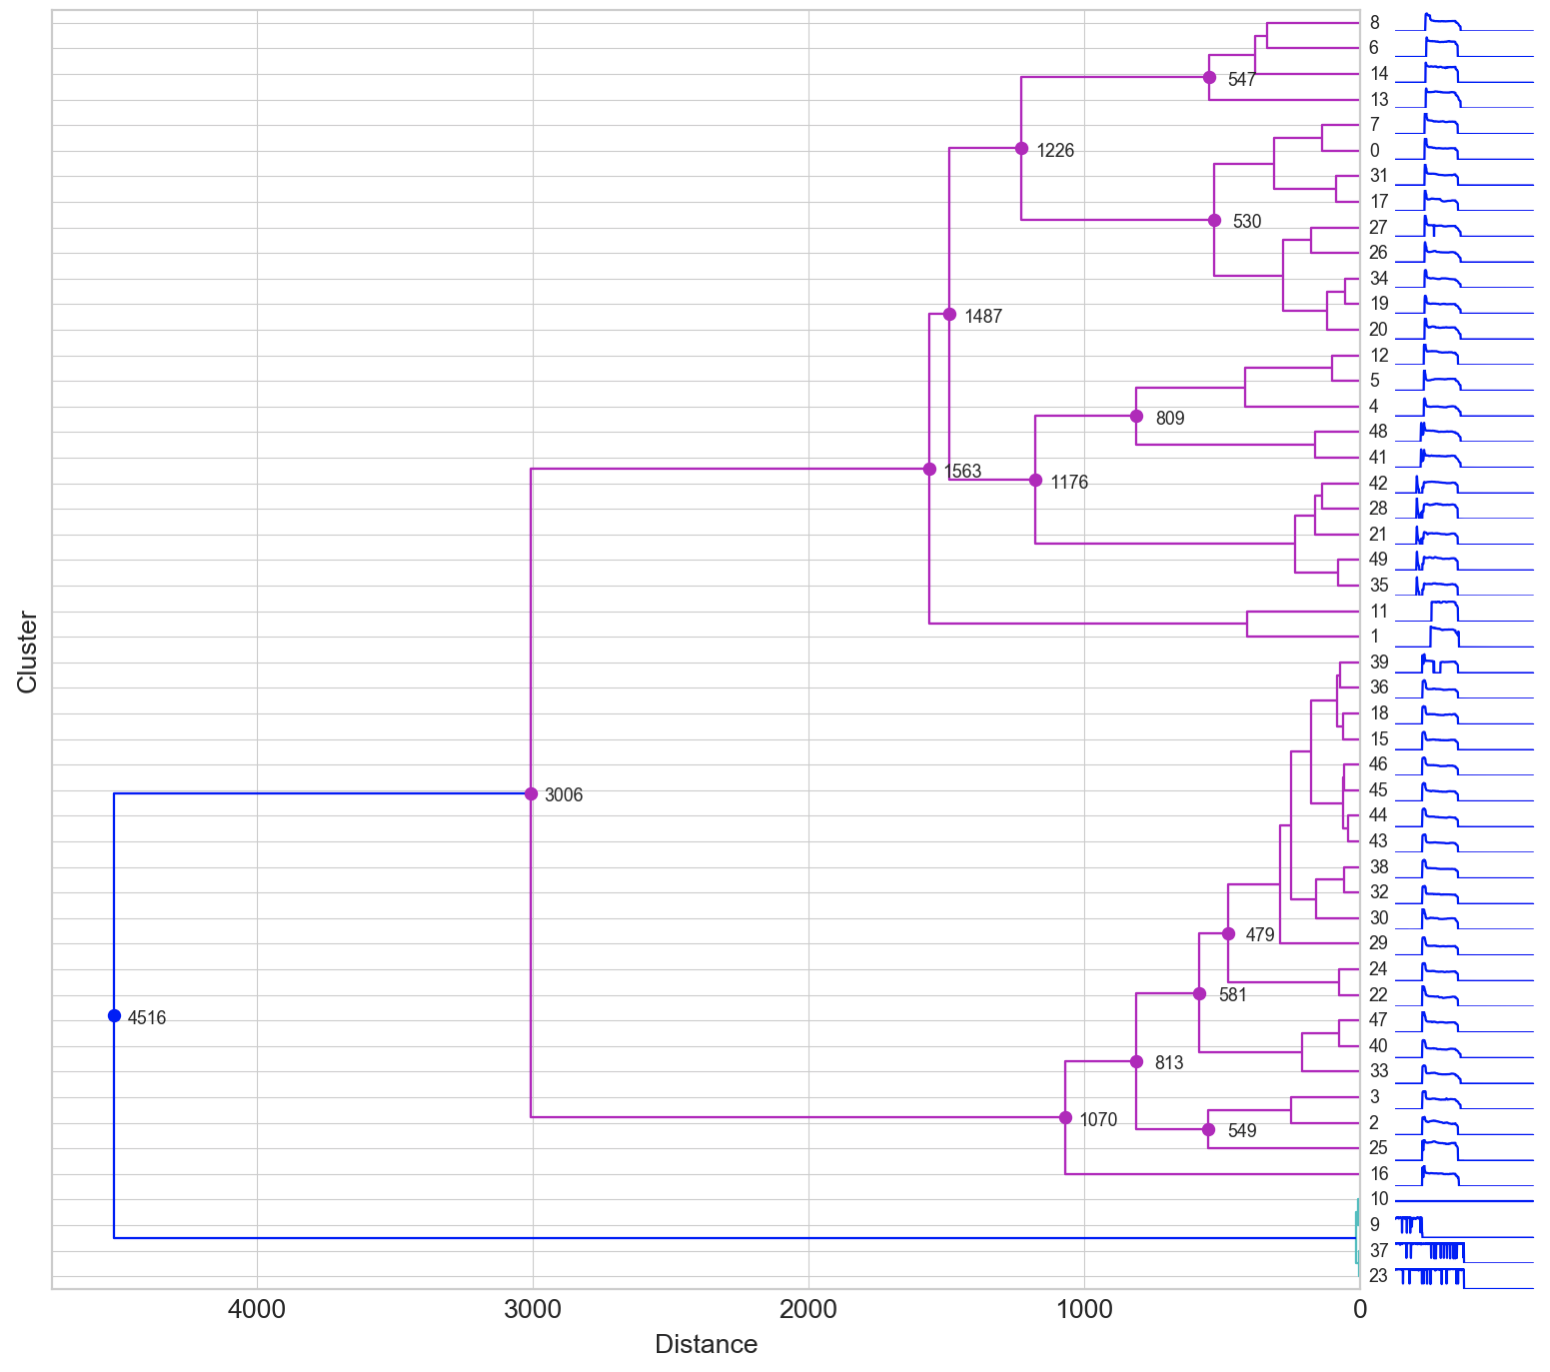
Release history Release notifications | RSS feed


Download files
Download the file for your platform. If you're not sure which to choose, learn more about installing packages.
Source Distribution
dendrogram_ts-0.1.2.tar.gz
(5.3 kB
view details)
File details
Details for the file dendrogram_ts-0.1.2.tar.gz.
File metadata
- Download URL: dendrogram_ts-0.1.2.tar.gz
- Upload date:
- Size: 5.3 kB
- Tags: Source
- Uploaded using Trusted Publishing? No
- Uploaded via: twine/3.4.1 importlib_metadata/3.10.0 pkginfo/1.6.1 requests/2.24.0 requests-toolbelt/0.9.1 tqdm/4.50.2 CPython/3.8.5
File hashes
| Algorithm | Hash digest | |
|---|---|---|
| SHA256 |
8a7297e8cdd3dae8cabd3d92b7b46bca5f318f4ba0b8ddec0c4a5027f850dff0
|
|
| MD5 |
b0875239268f7021c23f51386a057e4d
|
|
| BLAKE2b-256 |
3937dd46ad233286ca53f53a9956305318f9a0ca59bc5d88a3b465a633c876ab
|


