
depictr (Python)






Documentation and example gallery: https://pablobernabeu.github.io/depictr-py/
A unified, colourblind-safe toolkit for publication-ready statistical visualisation, built on plotnine.
This is the Python twin of the R package of the same name, which offers the same workflow on top of ggplot2. The two share a design and nearly all of an API, and the Status section below records where this one has yet to catch up.
Gallery
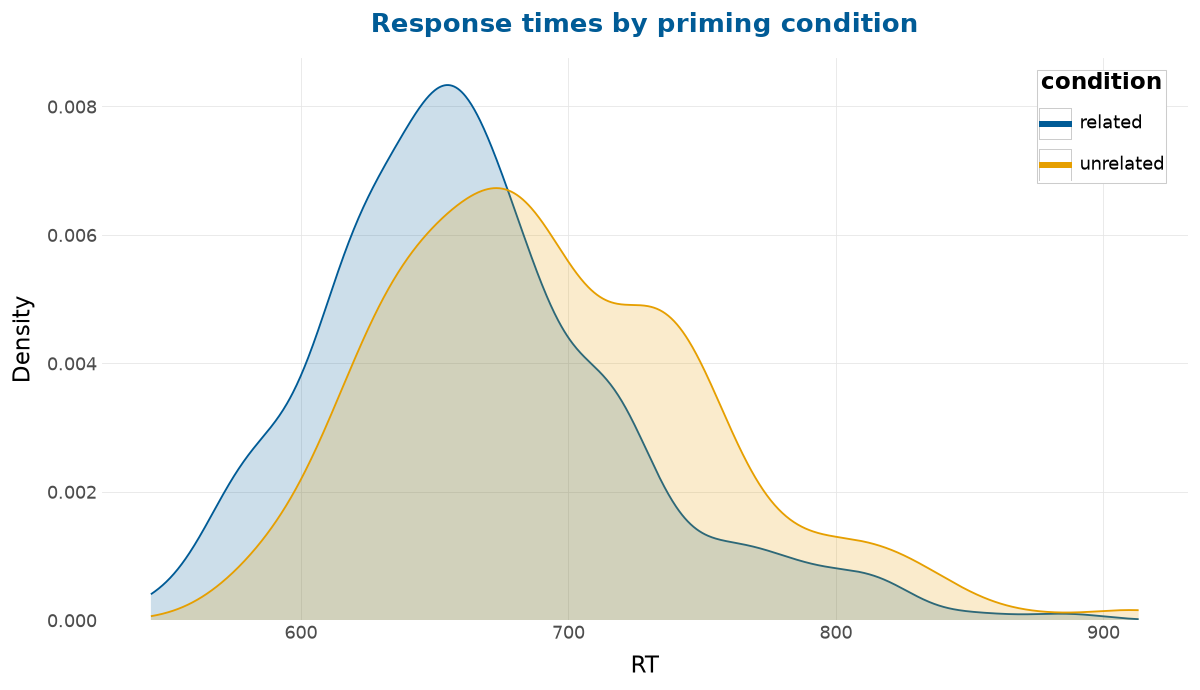
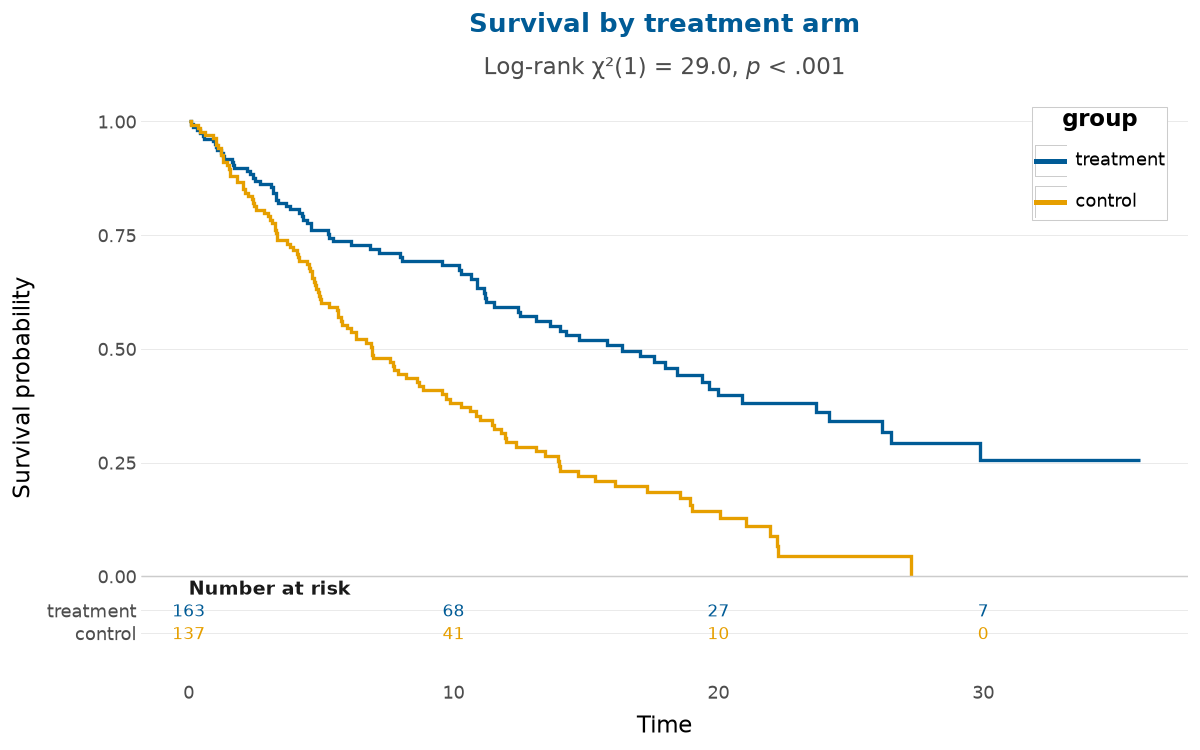
A grouped density (the default palette is the colourblind-safe Okabe-Ito set) and Kaplan-Meier survival curves with a log-rank test and a number-at-risk table, both from a single function call:
There is more in the example gallery.
These two use a couple of extra options (a title, legend_inside) shown in the
Getting started
guide, while the short tour below keeps its calls minimal.
What it is for
Python already has an excellent plot for almost any statistical task, but those plots live in different packages with different defaults. A single figure set for a paper might draw on seaborn, scikit-learn, statsmodels, lifelines and ArviZ, each with its own look, its own API and its own colour scheme, and only one of those defaults to colourblind-safe colours. Making the set consistent and accessible then means repeating the same theming by hand on every plot.
depictr does that work once. It gives the whole workflow one theme, one
colourblind-safe palette and one calling convention, and returns plotnine
objects you can keep extending with +. Where a specialist package already
computes a quantity well, depictr delegates to it and redraws the result under
the shared theme, so you keep the trusted computation and gain a coherent,
accessible figure.
Accessibility by default
The default palette is the Okabe-Ito set, and the package puts that choice to a test. It ships a simulator of colour-vision deficiency based on the model of Machado, Oliveira and Fernandes (2009), and a CIE-Lab distance test that measures how far apart the palette's colours stay under each deficiency:
import depictr as dp

dp.palette_safety()
# {'min_delta_e': ..., 'by_condition': {'normal': ..., 'protan': ...,
#  'deutan': ..., 'tritan': ...}, 'worst_condition': ..., 'worst_pair': ...,
#  'safe': True, 'threshold': 5.0}
The guarantee belongs to the eight Okabe-Ito colours. A plot with more than
eight groups has to interpolate between them, and the interpolated colours no
longer clear the distance threshold, so depictr_palette warns when it is asked
for a ninth. Facet the groups, or map them to the sequential ramp, when a figure
needs more.
A safe palette is not a safe figure, though. Once a plot has been extended with
your own scale, shrunk to fit a journal column, or asked to distinguish groups by
colour alone, the palette's guarantee no longer describes what a reader will see.
check_figure audits the plot you are about to submit and reports what it
measured beside the threshold it was measured against, so each verdict can be
argued with:
p = dp.explore_distribution(dp.lexical_decision(), "RT", group="condition")
dp.check_figure(p, width_cm=8.9)
It measures colour separability under each dichromacy and in greyscale, the smallest text size at the width the figure will be printed at, the WCAG contrast of text and geometry against their backgrounds, and whether any distinction rests on colour alone. One limitation belongs here, beside the claim it qualifies. The colourblind-safety guarantee covers hue confusion alone, and in greyscale the palette's orange and sky blue differ by only 0.79 in CIE lightness, so they print as the same grey. A figure that may be printed in black and white wants fewer groups, a sequential palette, or a redundant shape or line type.
Installation
depictr is on PyPI:
pip install depictr            # core (plotnine, pandas, numpy, matplotlib, scipy)
pip install depictr[all]       # plus the optional computation back-ends
The classification and survival plots delegate to scikit-learn and lifelines,
each an optional dependency installed only when your plots need it
(depictr[classification], depictr[survival]). The model and time-series
plots delegate to statsmodels, which plotnine itself requires, so it arrives
with the core install. The depictr[models] extra remains to pin the tested
statsmodels floor.
The development version comes from GitHub:
pip install git+https://github.com/pablobernabeu/depictr-py
A short tour
import depictr as dp

# Exploratory analysis
ld = dp.lexical_decision()
dp.explore_distribution(ld, "RT", group="condition", kind="both")

wb = dp.wellbeing_survey()
dp.correlation_heatmap(wb)
dp.missingness_map(wb)

# Model estimates: a fitted model OR a tidy data frame
import statsmodels.formula.api as smf
# Q() quotes "yield" because it is a Python keyword.
fit = smf.ols('Q("yield") ~ fertiliser + rainfall + soil_ph + treatment',
              dp.crop_yield()).fit()
dp.coefficient_plot(fit)

# Classification: computed by scikit-learn, themed by depictr
ct = dp.clinical_trial()
dp.roc_curve_plot(ct["adverse_event"], ct["biomarker"])

# Survival: Kaplan-Meier with a log-rank test, in one call
dp.survival_plot(ct["time"], ct["event"], group=ct["arm"])
Every function returns a plotnine object, so the usual grammar-of-graphics extensions apply:
from plotnine import labs

dp.roc_curve_plot(ct["adverse_event"], ct["biomarker"]) + labs(title="Adverse event")
The web app
A Streamlit app provides a gallery and a low-friction way to try the package. It loads one of the bundled datasets (or a CSV you upload), draws the chosen plot, shows the exact Python call that produced it, and offers a colourblind-vision toggle that re-renders the figure as each deficiency would be seen. The app lives in the repository rather than the wheel, so run it from a clone:
git clone https://github.com/pablobernabeu/depictr-py
cd depictr-py
pip install -e ".[app]"
streamlit run app/streamlit_app.py
Function families
The exported functions fall into families that follow the stages of an analysis.
| Family | Functions |
|---|---|
| Theme and palette | theme_depictr, scale_colour_depictr, scale_fill_depictr, depictr_palette, legend_inside |
| Accessibility | check_figure, palette_safety, simulate_cvd |
| Exploratory analysis | explore_distribution, explore_categorical, explore_bivariate, scatter_trend, correlation_heatmap, missingness_map, ecdf_plot, ridgeline_plot, dumbbell_plot, outlier_plot, group_comparison_plot, raincloud_plot, explore_pairs |
| Estimation and tables | estimation_plot (single- or two-panel Gardner-Altman), summary_table |
| Model estimates | coefficient_plot, tidy_estimates, effects_plot, interaction_plot, compare_models, random_effects_plot, posterior_plot, frequentist_bayesian_plot, power_curve_plot |
| Diagnostics | qq_plot, influence_plot, vif_plot, binned_residual_plot, residual_diagnostics_plot, model_report |
| Classification | roc_curve_plot, pr_curve_plot, confusion_matrix_plot, calibration_plot, gain_plot, lift_plot, threshold_plot |
| Multivariate | pca_plot, scree_plot, cluster_plot, dendrogram_plot, silhouette_plot |
| Survival | survival_plot (with an optional number-at-risk table) |
| Time series | acf_plot, decompose_plot, seasonal_plot, timeseries_plot |
| Composition | arrange_plots, save_plot |
Status
This is an early release, but coverage is broad. The colourblind-safe theme, the
accessibility check and most of the R package's plotting functions across every
family (EDA, estimation, model estimates, diagnostics, classification,
multivariate, survival and time series) are in place and tested. Multi-panel
composites are built on arrange_plots, which uses plotnine's native plot
composition, and they include the four-panel residual_diagnostics_plot, the
model_report dashboard, the two-panel Gardner-Altman estimation_plot, the
frequentist-over-Bayesian overlay and the survival number-at-risk table.
A few known limitations remain. Compositions in plotnine have no figure-level
title, so a grid carries its titles on each panel (the survival and estimation
composites place the title on their top panel). survival_plot does not yet
draw the confidence band or censor marks the R package draws, though its
conf_level argument is accepted for future use. Seven functions from the R
package have yet to be ported: optimizer_fixef_plot (there is no direct
statsmodels equivalent of lme4::allFit), k_diagnostic, palette_preview,
model_fit_table, ts_forecast, the label helper format_terms and the
session-wide settings of depictr_options. The monthly_sales dataset is also
R-only, so the time-series examples here build their own series.
Relationship to the R package
The two are siblings, with no shared codebase. The R package is built on ggplot2 and this one on plotnine, and the design is common to both. Each gives the whole workflow one accessible theme, takes its input either as a fitted model or as a data frame, and returns plot objects that stay extensible.
Citation
The About page carries the
preferred citation with a BibTeX entry and a short note on the developer, and
the repository ships
CITATION.cff
for the Cite this repository button on GitHub.
Licence
MIT. See LICENSE.
Contributing
Issues and pull requests are welcome. The contributing guide describes the development setup and the conventions the package follows, and everyone taking part is asked to honour the Code of Conduct.
1 maintainer

Metadata
1 maintainer
Release files for depictr 0.3.0
For a detailed explanation of source distributions (sdists) and built distributions (wheels), please see the package formats documentation.
Source distribution (sdist)
| File | Size | Uploaded | |
|---|---|---|---|
| depictr-0.3.0.tar.gz | 282.5 kB | Details |
Built distribution (wheel)
| File | Interpreter | ABI | Platform | Reset |
|---|---|---|---|---|
| depictr-0.3.0-py3-none-any.whl | Python 3 | none | any | Details |
Total release size: 367.7 kB
Release files / depictr-0.3.0.tar.gz
| Download URL | depictr-0.3.0.tar.gz |
|---|---|
| Size | 282.5 kB |
| Tags | Source |
|
SHA-256 checksum How to use checksums |
94ec34e8115889aac7de9a629c583fc757bb5a32b7241d1c998689b2d137db70
|
|
BLAKE2b-256 checksum How to use checksums |
f00de0b6c1c7b50f1b42d862b5cf22f7267b7f32b8a6d8e511804b197284459b
|
| Upload date | |
|
Uploaded using Trusted Publishing? What is trusted publishing? |
Yes |
| Uploaded via |
twine/7.0.0 CPython/3.13.14
|
Provenance
Provenance describes where a file came from. On PyPI, provenance is shared via attestations, which provide a verifiable record of the build or publishing details. View details, limitations and caveats.


PyPI Publish Attestation
PyPI verified that this artifact, at this checksum, originated from the publisher listed below.
Signed by GitHub Actions, verified by PyPI on Sep 24, 2026.
Transparency logRelease files / depictr-0.3.0-py3-none-any.whl
| Download URL | depictr-0.3.0-py3-none-any.whl |
|---|---|
| Size | 85.2 kB |
| Tags | Python 3 |
|
SHA-256 checksum How to use checksums |
208a3882f172bf132244dc3eb65905dc77cc501ceb52d9fd39fd1958ad9ec531
|
|
BLAKE2b-256 checksum How to use checksums |
570162c6a78c2095dfa6a85464129afb0517372d8407a576123c40fb199d5b64
|
| Upload date | |
|
Uploaded using Trusted Publishing? What is trusted publishing? |
Yes |
| Uploaded via |
twine/7.0.0 CPython/3.13.14
|
Provenance
Provenance describes where a file came from. On PyPI, provenance is shared via attestations, which provide a verifiable record of the build or publishing details. View details, limitations and caveats.
PyPI Publish Attestation
PyPI verified that this artifact, at this checksum, originated from the publisher listed below.
Signed by GitHub Actions, verified by PyPI on Sep 24, 2026.
Transparency log













