
DeProjPy
deprojpy is a Python implementation of the core matlab project DeProj workflow: deproject segmented epithelial cell contours onto a height-map surface, compute 3D cell geometry, and estimate distances on the deprojected surface.
The goal is not GUI parity with MATLAB. The focus is a scriptable Python API for deprojection, feature measurement, plotting, and surface-distance calculations.
Installation
Install from PyPI:
python -m pip install deprojpy
For development, clone the repository and install it in editable mode:
git clone https://github.com/zen-laboratory/DeProjPy.git
cd DeProjPy
python -m pip install -e ".[test]"
python -m pytest
The label-image workflow uses the published companion labelimage-tools
package, which is installed automatically with DeProjPy. To install or upgrade
it explicitly:
python -m pip install "labelimage-tools[all]"
Quick start: DeProj-style mask input
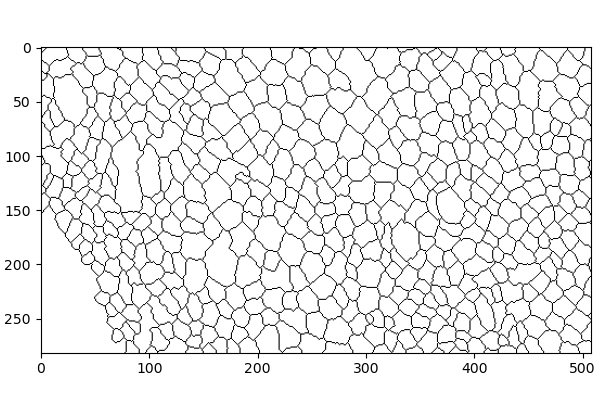
The MATLAB-style workflow starts from a binary-like segmentation mask and a height map. In the mask image, cell interiors are non-zero and cell borders are zero-valued ridges.
import deprojpy as dp

mask, heightmap = dp.load_tiff_pair("samples/Segmentation-2.tif", "samples/HeightMap-2.tif")
result = dp.from_heightmap(mask, heightmap,
    pixel_size=0.183, voxel_depth=1.0, units="µm",
    invert_z=True, inpaint_zeros=True, prune_zeros=True)

df = result.to_dataframe()
result.to_csv("measurements.csv")
Returned boundaries, centers, and junction centroids use geometric (x, y, z) order in physical units. Input images still use normal image indexing (row, column).
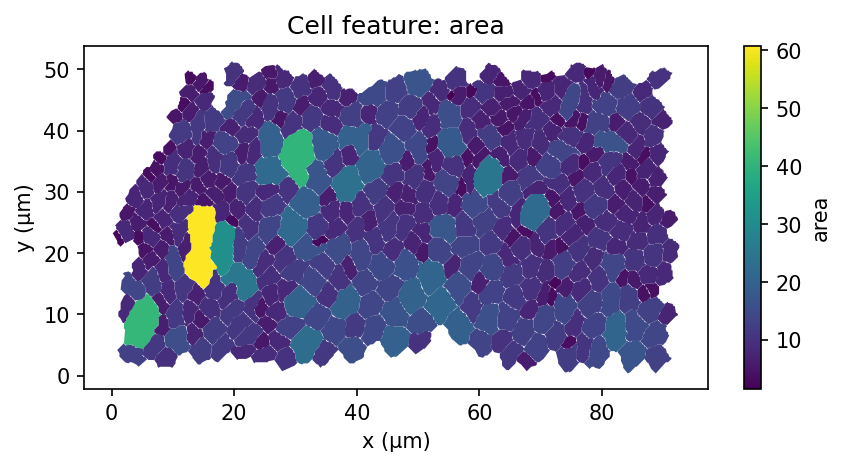
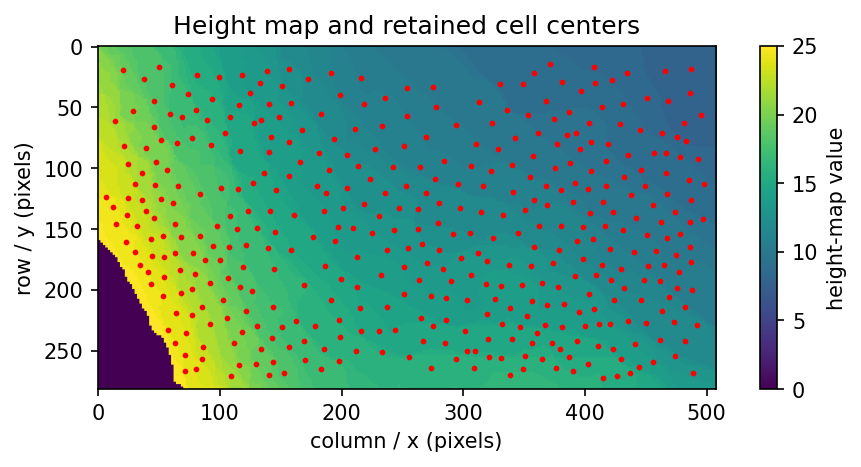
Plot a scalar feature on the deprojected cell polygons:
fig, ax = dp.plotting.plot_feature_map(result, "area")
fig, ax = dp.plotting.plot_heightmap_with_centers(heightmap, result)
Why deproject?
Measurements made directly on the 2D segmentation image can underestimate cell geometry when the tissue surface is curved or tilted. DeProjPy measures cell contours after lifting them onto the height-map surface, so quantities such as area and perimeter are reported in surface-corrected physical units.
A useful diagnostic is the relative area difference between the deprojected surface area and the original projected 2D area:
fig, ax = dp.plotting.plot_relative_error_map(result, 'area')
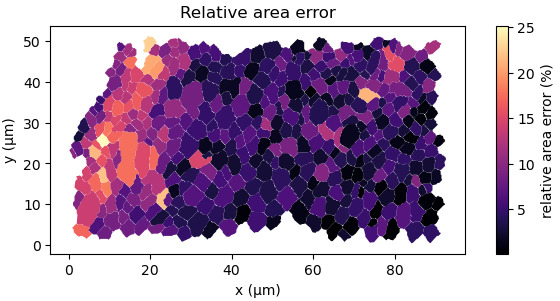
Positive values indicate cells whose surface-corrected area is larger than their projected 2D area. This is the geometric correction DeProj is designed to make visible and measurable.
Alternative input: labeled segmentations
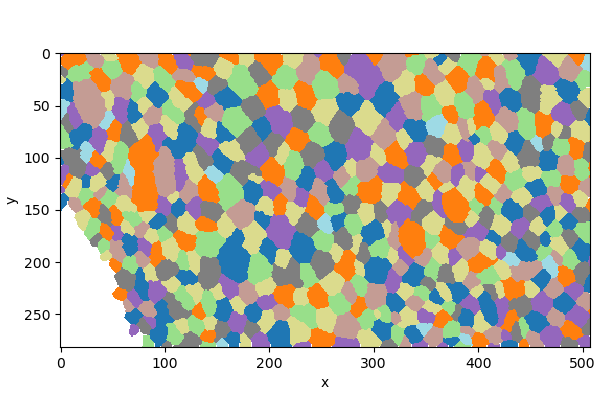
DeProjPy is modernized compared to the Matlab version, as it can also start from an integer label image, where each cell has a unique label and background is zero. This is useful for outputs from segmentation pipelines that already return labels rather than DeProj-style ridge masks, such as FishFeats.
| DeProj-style mask | Label image |
|---|---|
from_heightmap(mask, heightmap, ...) |
from_labels(labels, heightmap, ...) |
| Cell interiors are non-zero; borders are zero. | All pixels in a cell share a unique integer label; background is zero. |
import deprojpy as dp

labels, heightmap = dp.load_label_heightmap_pair("samples/Labels-2.tif", "samples/HeightMap-2.tif")
result = dp.from_labels(labels, heightmap,
    pixel_size=0.183, voxel_depth=1.0, units="µm",
    invert_z=True, inpaint_zeros=True, prune_zeros=True)

df = result.to_dataframe()
The label workflow returns the same kind of DeprojResult as the mask workflow. Original label IDs are preserved as source_label when available.
Surface distances
DeProjPy introduces new reusable tools for distances constrained to a surface.
There are two main distance ideas:
- straight surface distance: sample the surface along the straight segment in
xyand measure the lifted 3D polyline; - graph geodesic distance: build a sparse surface graph and compute shortest paths on the graph. This is an approximation to the continuous geodesic.
For plotting paths on the fitted DeProj cell-contour surface, build the calculator from cell boundaries:
import numpy as np
from deprojpy.surface_distance import SurfaceDistanceCalculator, SurfaceGraph

centers = df[["center_x", "center_y"]].to_numpy()

calc = SurfaceDistanceCalculator.from_cell_boundaries(result)
d_straight = calc.straight_distance(centers[10], centers[200], input_units="physical")

graph = SurfaceGraph.from_calculator(calc, step="auto", connectivity="16")
d_graph, path_px = graph.distance(centers[10], centers[200],
    input_units="physical", return_path=True)
For all-pairs straight surface distances between cell centers:
D = calc.straight_pairwise_distances(centers, input_units="physical")
Graph paths are returned in pixel coordinates, matching graph nodes. To plot them in 3D, sample the calculator surface and convert xy back to physical units:
path_z = calc.sample_height(path_px, input_units="pixel")
path_xyz = np.column_stack([path_px * result.pixel_size, path_z])
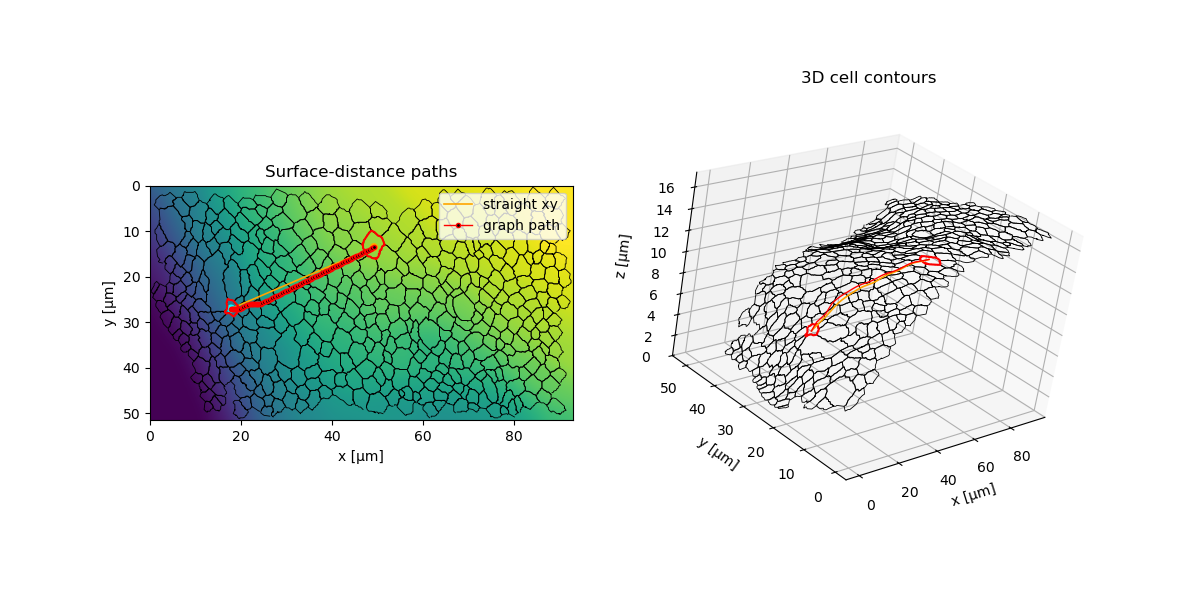
Use SurfaceDistanceCalculator.from_result(...) when you want distances on the prepared height-map surface. Use SurfaceDistanceCalculator.from_cell_boundaries(...) when you want paths and distances on the fitted surface represented by the deprojected cell contours.
What is in a result?
A DeprojResult contains:
result.epicells: oneEpiCellper retained cell;result.to_dataframe(): a tabular summary of cell features;result.prepared_heightmap: the height map used for deprojection;- deprojected boundaries, centers, junctions, and geometry in physical units.
The most common workflow is:
result = dp.from_heightmap(mask, heightmap, ...)
df = result.to_dataframe()
or:
result = dp.from_labels(labels, heightmap, ...)
df = result.to_dataframe()
More examples
See docs/cookbook.md and the scripts in examples/ for copy-pastable workflows covering plotting, diagnostics, label inputs, exports, curvature maps, and surface distances.
Validation status
The Python implementation is tested with synthetic invariants and the original DeProj sample images. It is not yet certified against MATLAB golden outputs.
With the original sample files, expected smoke-check values include:
- image shape
(282, 508); - 426 retained cells;
- finite positive cell areas and perimeters.
License
DeProjPy is distributed under the BSD 3-Clause license. It is partly a Python implementation/port of the core workflow from the original BSD-licensed MATLAB DeProj project. This package does not imply endorsement by the original authors or institutions.
1 maintainer

Metadata
1 maintainer
Release files for deprojpy 0.1.1
For a detailed explanation of source distributions (sdists) and built distributions (wheels), please see the package formats documentation.
Source distribution (sdist)
| File | Size | Uploaded | |
|---|---|---|---|
| deprojpy-0.1.1.tar.gz | 53.5 kB | Details |
Built distribution (wheel)
| File | Interpreter | ABI | Platform | Reset |
|---|---|---|---|---|
| deprojpy-0.1.1-py3-none-any.whl | Python 3 | none | any | Details |
Total release size: 103.7 kB
Release files / deprojpy-0.1.1.tar.gz
| Download URL | deprojpy-0.1.1.tar.gz |
|---|---|
| Size | 53.5 kB |
| Tags | Source |
|
SHA-256 checksum How to use checksums |
24a76c40404d0b5b9045d2f782e296c101c6d5bd64fea66c1bd49310e5204f84
|
|
BLAKE2b-256 checksum How to use checksums |
7b4f694dc01695005862564cfe7d3ce3e21e9ccd6bdc52ed0e20e1afa77c113f
|
| Upload date | |
|
Uploaded using Trusted Publishing? What is trusted publishing? |
Yes |
| Uploaded via |
twine/7.0.0 CPython/3.13.14
|
Provenance
Provenance describes where a file came from. On PyPI, provenance is shared via attestations, which provide a verifiable record of the build or publishing details. View details, limitations and caveats.


PyPI Publish Attestation
PyPI verified that this artifact, at this checksum, originated from the publisher listed below.
Signed by GitHub Actions, verified by PyPI on Sep 18, 2026.
Transparency logRelease files / deprojpy-0.1.1-py3-none-any.whl
| Download URL | deprojpy-0.1.1-py3-none-any.whl |
|---|---|
| Size | 50.1 kB |
| Tags | Python 3 |
|
SHA-256 checksum How to use checksums |
be559299b1569449f0a5ea221414c3ef18727cf89636181891012ce294e1714a
|
|
BLAKE2b-256 checksum How to use checksums |
ff34ce2bb0fb26d07f37b8cce89026a138ec4afa96e07515d1d8fb22ac625018
|
| Upload date | |
|
Uploaded using Trusted Publishing? What is trusted publishing? |
Yes |
| Uploaded via |
twine/7.0.0 CPython/3.13.14
|
Provenance
Provenance describes where a file came from. On PyPI, provenance is shared via attestations, which provide a verifiable record of the build or publishing details. View details, limitations and caveats.
PyPI Publish Attestation
PyPI verified that this artifact, at this checksum, originated from the publisher listed below.
Signed by GitHub Actions, verified by PyPI on Sep 18, 2026.
Transparency log













