
deskplot — Plotly charts in native desktop windows


deskplot is a Python library that displays Plotly charts in native desktop windows instead of browser tabs. Every chart opens in its own non-blocking OS window with a terminal-style dark theme, a custom toolbar, a dark/light theme toggle, crosshair cursor, and one-click PNG export — all from a single fig.show() call.
If you have ever searched for "how to show a Plotly chart in a window without a browser", "Plotly desktop app", "Plotly native window Python", or "Plotly dark theme terminal charts" — this is that library.
import deskplot

fig = deskplot.ChartFigure()
fig.add_scatter(x=[1, 2, 3, 4], y=[10, 4, 12, 8], name="Series A")
fig.set_title("My First deskplot Chart")
fig.show()   # opens a native desktop window — your script keeps running
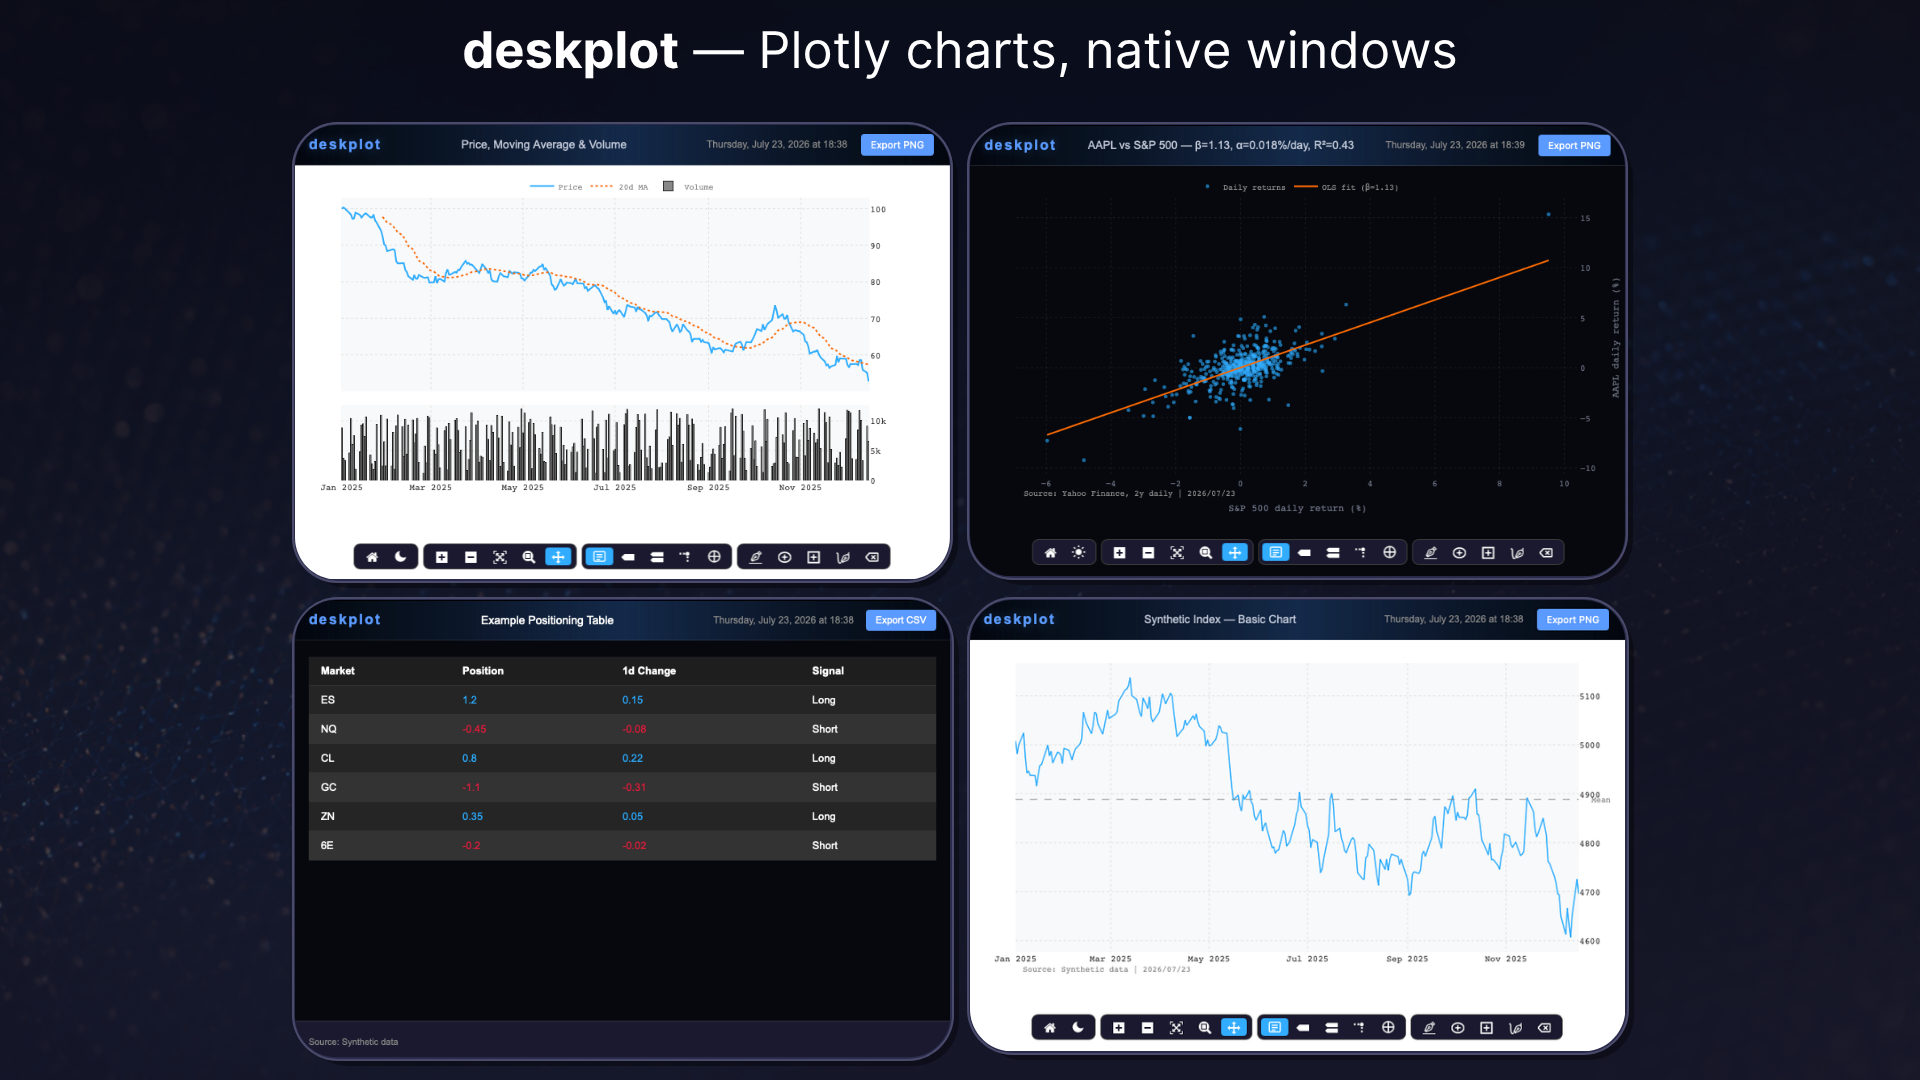
Four native windows from the bundled examples: dark and light theme (toggled in-window), subplots, a regression scatter, and the interactive table viewer — each with the branded header bar, one-click export, and grouped toolbar.
Who is this for?
deskplot is for people who build models, not GUIs.
- Quant researchers and analysts who live in Python scripts and notebooks — run the model, call
fig.show(), and the chart is on your screen in a real window, not buried in tab number forty-seven. - Anyone who publishes their research — newsletter authors, independent strategists, desk-note writers. Brand the header bar once, click Export PNG, and every chart you share carries your name and looks like it came off a trading terminal.
- Backtesters and tinkerers who want ten charts open side by side — each window is its own process, so open as many as the model demands and keep coding while they stay up.
- Model builders who outgrew
plt.show()— use deskplot as the display layer of your local research terminal. Swap matplotlib's static viewer for native windows you can resize, zoom, hover, and arrange across monitors: your model callsfig.show()for every chart it produces, all of them stay open and interactive, and the script never blocks waiting for a window to close.
If your workflow is build → look → screenshot → share, deskplot removes every step between "the DataFrame is ready" and "the chart is in your publication."
Why deskplot?
Plotly's default fig.show() dumps your chart into a browser tab: no window management, no consistent styling, and your charts get lost between fifty other tabs. The alternatives are heavy — Dash means running a web server; Qt/Tkinter embedding means writing GUI boilerplate.
deskplot gives you a third option: a real desktop chart viewer in one line of Python.
- Native windows, not browser tabs — each chart opens in its own OS window via pywebview
- Non-blocking — windows run in separate processes; your script, REPL, or Jupyter kernel keeps running, and you can open as many chart windows as you want
- Terminal-style dark theme — a finance-terminal look (dark background, monospace fonts, dotted grid) applied automatically to every figure
- Dark/light theme toggle — switch themes inside the open window; all axes restyle correctly, including multi-axis and subplot figures
- Custom toolbar — grouped, bottom-centered mode bar: zoom, pan, unified tooltip, spike lines, crosshair cursor, and drawing tools (trend lines, rectangles, freehand)
- One-click PNG export — exports the full window including the branded header bar (chart captured via
Plotly.toImage, header composited with vendored html2canvas) - Brandable header bar — put your own name, colors, and attribution on every chart window with one
deskplot.configure()call - Interactive DataFrame tables — display any pandas DataFrame as a sortable dark-themed table with CSV export
- Browser fallback — no pywebview installed? Same HTML opens in your default browser. Nothing breaks.
- Offline-safe — Plotly.js and html2canvas are embedded into the generated HTML; no CDN calls at render time
Installation
pip install deskplot            # browser-fallback mode (plotly + pandas only)
pip install "deskplot[native]"  # + pywebview for native desktop windows
pip install "deskplot[image]"   # + kaleido for save_image() static export
Python 3.10+. Works on macOS out of the box; on Windows pywebview uses the built-in WebView2 runtime; on Linux it needs GTK or Qt (see pywebview's installation guide).
Quickstart
A chart in a native window
import deskplot

fig = deskplot.ChartFigure()
fig.add_scatter(x=dates, y=prices, name="SPX", line=dict(color="#00ACFF"))
fig.add_hline_with_label(y=5000, label="Resistance", line_color="#e4003a")
fig.set_title("S&P 500")
fig.add_source_annotation("My Data Vendor")
fig.show()
ChartFigure subclasses plotly.graph_objects.Figure, so everything you already know about Plotly works unchanged — every trace type, layout option, and subplot spec.
Subplots and dual axes
fig = deskplot.ChartFigure.create_subplots(
    rows=2, cols=1, shared_xaxes=True, row_heights=[0.7, 0.3],
    specs=[[{"secondary_y": True}], [{}]],
)
fig.add_scatter(x=x, y=price, name="Price", row=1, col=1)
fig.add_bar(x=x, y=volume, name="Volume", row=2, col=1)
fig.show(title="Price & Volume")
Scatter regression: AAPL vs S&P 500
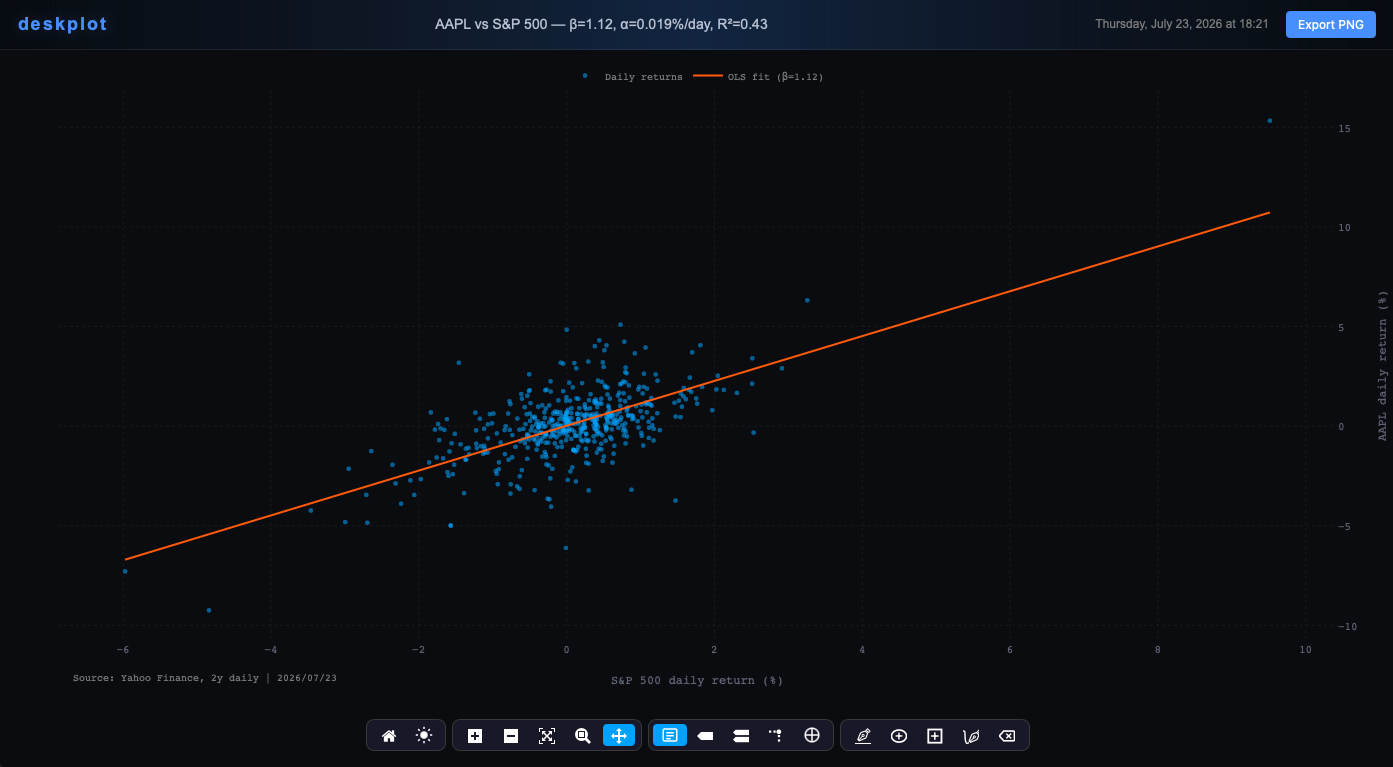
A beta regression of AAPL daily returns on the S&P 500, fetched with yfinance (synthetic fallback when offline):
import numpy as np
import deskplot

# x = S&P 500 daily returns (%), y = AAPL daily returns (%)
beta, alpha = np.polyfit(x, y, 1)
r_squared = np.corrcoef(x, y)[0, 1] ** 2
line_x = np.linspace(x.min(), x.max(), 100)

fig = deskplot.ChartFigure()
fig.add_scatter(x=x, y=y, mode="markers", name="Daily returns",
                marker=dict(color="#00ACFF", size=5, opacity=0.55))
fig.add_scatter(x=line_x, y=alpha + beta * line_x, mode="lines",
                name=f"OLS fit (β={beta:.2f})", line=dict(color="#FF6B00", width=2))
fig.update_layout(xaxis_title="S&P 500 daily return (%)",
                  yaxis_title="AAPL daily return (%)")
fig.set_title(f"AAPL vs S&P 500 — β={beta:.2f}, α={alpha:.3f}%/day, R²={r_squared:.2f}")
fig.add_source_annotation("Yahoo Finance, 2y daily")
fig.show()
Full runnable version: examples/05_regression_aapl_spx.py.
A pandas DataFrame as an interactive table
import deskplot
import pandas as pd

df = pd.DataFrame({"Asset": ["ES", "NQ", "CL"], "Position": [1.2, -0.4, 0.8]})
deskplot.show_table(df, title="Positioning", source="Internal model")
Sortable columns, alternating row colors, negative numbers in red, positive in blue, and an Export CSV button.
Brand it as your own
import deskplot

deskplot.configure(
    brand="ACME RESEARCH",          # header bar text
    brand_secondary="MACRO DESK",   # optional second label
    color_primary="#00C853",        # brand accent color
    source="ACME Research",         # default source attribution
    export_prefix="acme_chart",     # exported file names
)
Every window now carries your identity — useful for research shops, newsletters, and anyone publishing screenshots of their charts.
How it works
fig.show() renders the figure to a standalone HTML file (Plotly.js embedded, custom header and toolbar injected), then launches a small viewer script in a subprocess that displays it with pywebview. Because each window is its own process:
- your Python script continues immediately (non-blocking),
- windows survive after the script exits,
- multiple windows never interfere with each other or with your main process.
Without pywebview, the same HTML opens via webbrowser — identical rendering, just in a tab.
Configuration reference
| Option | Default | Description |
|---|---|---|
brand |
"deskplot" |
Primary text in the window header bar |
brand_secondary |
"" |
Secondary header text (hidden when empty) |
color_primary |
"#5b9aff" |
Brand text + button accent color |
color_secondary |
"#e0e0e0" |
Secondary brand text color |
color_accent |
"#5b9aff" |
Drawing-tool accent (trend lines, shapes) |
source |
"" |
Default source attribution (hidden when empty) |
auto_source |
False |
Auto-add the source annotation on show() when source is set; per-figure override via fig.show(source=True/False) |
chart_title |
"Interactive Chart" |
Fallback chart window title |
table_title |
"Data Table" |
Fallback table window title |
export_prefix |
"chart" |
Filename prefix for PNG/CSV exports |
window_title_format |
"{brand} - {title}" |
Native window title format |
log_prefix |
"[deskplot]" |
Prefix for console messages |
axis_tick_font_size |
11 |
Font size of x/y axis tick labels |
axis_title_font_size |
12 |
Font size of x/y axis titles |
Set options before creating figures — they are applied when a ChartFigure is constructed.
deskplot vs. alternatives
| deskplot | Plotly fig.show() |
Dash | Qt/Tk embedding | |
|---|---|---|---|---|
| Native desktop window | ✅ | ❌ browser tab | ❌ browser | ✅ |
| One-line usage | ✅ | ✅ | ❌ app + server | ❌ GUI boilerplate |
| Non-blocking / multi-window | ✅ | ✅ (tabs) | ❌ | depends |
| Styled dark theme out of the box | ✅ | ❌ | ❌ | ❌ |
| In-window theme toggle, crosshair, branded export | ✅ | ❌ | build it yourself | build it yourself |
| Extra runtime | pywebview (optional) | none | Flask server | Qt/Tk |
Limitations
- The bundled theme is dark-first; the in-window toggle provides a light view, but there is no standalone light
.pltstyle.jsonyet. - Native windows require a desktop session — on headless servers use the browser fallback or
fig.to_html(). - On Linux, pywebview needs GTK or Qt system packages.
- Each window embeds Plotly.js (~5 MB HTML temp file) for offline safety.
Credits & attribution
- Built on Plotly.py and pywebview.
- The
.pltstyle.jsontheming format and the grouped-toolbar concept are inspired by OpenBB Terminal (MIT). - html2canvas 1.4.1 (MIT) is vendored for header-inclusive PNG export.
deskplot was extracted from an internal systematic-macro research toolchain, where it renders positioning models and backtest dashboards daily.
Contributing
Issues and pull requests are welcome — see CONTRIBUTING.md.
License
1 maintainer

Metadata
1 maintainer
Release files for deskplot 0.2.0
For a detailed explanation of source distributions (sdists) and built distributions (wheels), please see the package formats documentation.
Source distribution (sdist)
| File | Size | Uploaded | |
|---|---|---|---|
| deskplot-0.2.0.tar.gz | 956.0 kB | Details |
Built distribution (wheel)
| File | Interpreter | ABI | Platform | Reset |
|---|---|---|---|---|
| deskplot-0.2.0-py3-none-any.whl | Python 3 | none | any | Details |
Total release size: 1.0 MB
Release files / deskplot-0.2.0.tar.gz
| Download URL | deskplot-0.2.0.tar.gz |
|---|---|
| Size | 956.0 kB |
| Tags | Source |
|
SHA-256 checksum How to use checksums |
90f40b48ecd662d6ba626677d875377c01a2a728d4715b9698695174d6fc677d
|
|
BLAKE2b-256 checksum How to use checksums |
c202435f8e6942d173f63b4db938cb208f24a28324a3e62d17463bfc31ba8dc2
|
| Upload date | |
|
Uploaded using Trusted Publishing? What is trusted publishing? |
Yes |
| Uploaded via |
twine/6.1.0 CPython/3.13.14
|
Provenance
Provenance describes where a file came from. On PyPI, provenance is shared via attestations, which provide a verifiable record of the build or publishing details. View details, limitations and caveats.


PyPI Publish Attestation
PyPI verified that this artifact, at this checksum, originated from the publisher listed below.
Signed by GitHub Actions, verified by PyPI on Jul 23, 2026.
Transparency logRelease files / deskplot-0.2.0-py3-none-any.whl
| Download URL | deskplot-0.2.0-py3-none-any.whl |
|---|---|
| Size | 74.9 kB |
| Tags | Python 3 |
|
SHA-256 checksum How to use checksums |
5c0455fe38f8500135871e44ec0f01f8805c642f3a6ad309127999767f5ed51e
|
|
BLAKE2b-256 checksum How to use checksums |
4e73585f7ddecf06b8ba2a24fdc9454a028fd93b0d02ad4fbd53ccbd45327d65
|
| Upload date | |
|
Uploaded using Trusted Publishing? What is trusted publishing? |
Yes |
| Uploaded via |
twine/6.1.0 CPython/3.13.14
|
Provenance
Provenance describes where a file came from. On PyPI, provenance is shared via attestations, which provide a verifiable record of the build or publishing details. View details, limitations and caveats.
PyPI Publish Attestation
PyPI verified that this artifact, at this checksum, originated from the publisher listed below.
Signed by GitHub Actions, verified by PyPI on Jul 23, 2026.
Transparency log













