
df2img: Save a Pandas DataFrame as image




What is it all about?
Have you ever tried to save a pd.DataFrame into an image file? This is not a straightforward process at all. Unfortunately, pandas itself doesn't provide this functionality out of the box.
df2img tries to fill the gap. It is a Python library that greatly simplifies the process of saving a pd.DataFrame into an image file (e.g. png or jpg).
It is a wrapper/convenience function in order to create a plotly Table. That is, one can use plotly's styling function to format the table.
Dependencies
df2img has a limited number of dependencies, namely
pandasplotlykaleido
Documentation
An extensive documentation is available at https://df2img.dev.
Important note
The kaleido dependency is needed to save a pd.DataFrame. Right now there is an
issue when using the latest version of kaleido.
This project requires kaleido==v0.2.1 when you are installing df2img on a
machine other than Windows.
However, when you're on a Windows machine, you must use kaleido==v0.1.0.post1.
The dependency specification in the pyproject.toml file takes care of this.
Quickstart
You can install the package via pip.
pip install df2img
Using uv?
uv add df2img
Let's create a simple pd.DataFrame with some dummy data:
import pandas as pd

import df2img

df = pd.DataFrame(
    data=dict(
        float_col=[1.4, float("NaN"), 250, 24.65],
        str_col=("string1", "string2", float("NaN"), "string4"),
    ),
    index=["row1", "row2", "row3", "row4"],
)
      float_col  str_col
row1       1.40  string1
row2        NaN  string2
row3     250.00      NaN
row4      24.65  string4
Basics
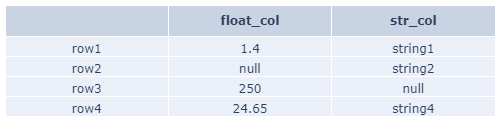
Saving df into a png-file now takes just two lines of code including some styling out of the box.
- First, we create a
plotlyfigure. - Second, we save the figure to disk.
fig = df2img.plot_dataframe(df, fig_size=(500, 140))

df2img.save_dataframe(fig=fig, filename="plot1.png")
Formatting
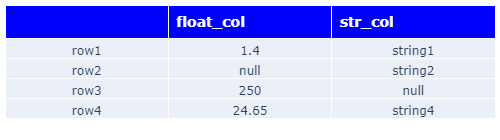
You can control the settings for the header row via the tbl_header input argument. This accepts a regular dict. This dict can comprise various key/value pairs that are also accepted by plotly. All available key/value pairs can be seen at plotly's website at https://plotly.com/python/reference/table/#table-header.
Let's set the header row in a different color and size. Also, let's set the alignment to "left".
fig = df2img.plot_dataframe(
    df,
    tbl_header=dict(
        align="left",
        fill_color="blue",
        font_color="white",
        font_size=14,
    ),
    fig_size=(500, 140),
)
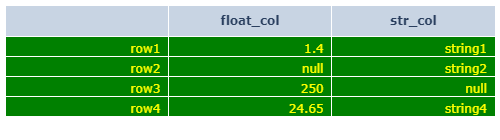
Controlling the table body (cells) is basically the same. Just use the tbl_cells input argument, which happens to be a dict, too.
See https://plotly.com/python/reference/table/#table-cells for all the possible key/value pairs.
Let's print the table cell values in yellow on a green background and align them "right".
fig = df2img.plot_dataframe(
    df,
    tbl_cells=dict(
        align="right",
        fill_color="green",
        font_color="yellow",
    ),
    fig_size=(500, 140),
)
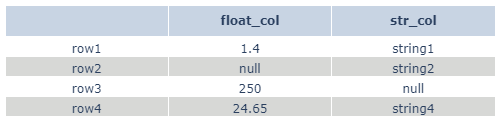
You can alternate row colors for better readability by using the row_fill_color input argument. Using HEX colors is also possible:
fig = df2img.plot_dataframe(
    df,
    row_fill_color=("#ffffff", "#d7d8d6"),
    fig_size=(500, 140),
)
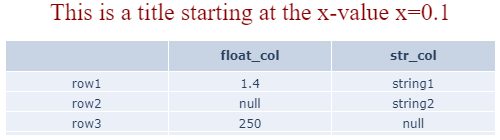
Setting the title will be controlled via the title input argument. You can find the relevant key/value pairs here: https://plotly.com/python/reference/layout/#layout-title.
Let's put the title in a different font and size. In addition, we can control the alignment via the x key/value pair. It sets the x (horizontal) position in normalized coordinates from "0" (left) to "1" (right).
  fig = df2img.plot_dataframe(
      df,
      title=dict(
          font_color="darkred",
          font_family="Times New Roman",
          font_size=24,
          text="This is a title starting at the x-value x=0.1",
          x=0.1,
          xanchor="left",
      ),
      fig_size=(500, 140),
  )
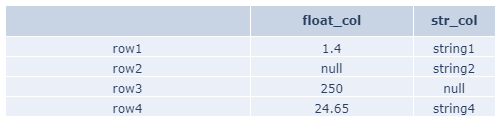
You can also control relative column width via the col_width argument. Let's set the first column's width triple the width of the third column and the second column's width double the width of the third column.
fig = df2img.plot_dataframe(
    df,
    col_width=[3, 2, 1],
    fig_size=(500, 140),
)
Contributing to df2img
If you consider to contribute to df2img, please read the Contributing to df2img section in the documentation. This document is supposed to guide you through the whole process.
1 maintainer

Metadata
1 maintainer
Release files for df2img 0.2.21
For a detailed explanation of source distributions (sdists) and built distributions (wheels), please see the package formats documentation.
Source distribution (sdist)
| File | Size | Uploaded | |
|---|---|---|---|
| df2img-0.2.21.tar.gz | 10.2 kB | Details |
Built distribution (wheel)
| File | Interpreter | ABI | Platform | Reset |
|---|---|---|---|---|
| df2img-0.2.21-py3-none-any.whl | Python 3 | none | any | Details |
Total release size: 18.0 kB
Release files / df2img-0.2.21.tar.gz
| Download URL | df2img-0.2.21.tar.gz |
|---|---|
| Size | 10.2 kB |
| Tags | Source |
|
SHA-256 checksum How to use checksums |
f911c3e5f3cd72a421c276150479d4498f7ffbeb9414da23cbc36732fa7dbe30
|
|
BLAKE2b-256 checksum How to use checksums |
f7114faf62c5d4a7c64f9b953f7c290b696e6f0459b9c54a1085527eecc1d736
|
| Upload date | |
|
Uploaded using Trusted Publishing? What is trusted publishing? |
No |
| Uploaded via |
twine/5.1.1 CPython/3.13.0
|
Release files / df2img-0.2.21-py3-none-any.whl
| Download URL | df2img-0.2.21-py3-none-any.whl |
|---|---|
| Size | 7.7 kB |
| Tags | Python 3 |
|
SHA-256 checksum How to use checksums |
e5999324adcf618510dc9395260069dcfdec9046bc0e9ccdbe6fc0cb6854ef2c
|
|
BLAKE2b-256 checksum How to use checksums |
0e23055cc690d39e00206eba97797b50af0bfc262232d84ba1fcad4ca20628da
|
| Upload date | |
|
Uploaded using Trusted Publishing? What is trusted publishing? |
No |
| Uploaded via |
twine/5.1.1 CPython/3.13.0
|














