dfvue: A minimal GUI for a quick view of csv files
Verified details
These details have been verified by PyPIProject links
GitHub Statistics
Maintainers

Project description
A simple GUI to view csv files


About dfvue
dfvue is a minimal GUI for a quick view of csv files. It uses an input panel similar to Microsoft Excel to check visually that the csv file is read correctly. It provides most options of the pandas.read_csv method to be very versatile on possible csv formats.
dfvue is a Python script that can be called from within Python or as a command line tool. It is not supposed to produce publication-ready plots but rather provide a quick overview of the csv file.
A more complete documentation for dfvue is available from:
Installation
dfvue is an application written in Python. It can be installed with pip:
python -m pip install customtkinter dfvueor via Conda:
conda install -c conda-forge dfvuedfvue uses CustomTkinter if it is installed. CustomTkinter is not on Conda. One can install CustomTkinter with pip on Conda, which works well except for Linux.
Sometimes tkinter is not enabled in the system’s Python version. One has to do, for example, sudo apt install python3-tk on Linux or brew install python3 python-tk on macOS with Homebrew.
We also provide standalone applications for macOS and Windows that come with everything needed to run dfvue including Python:
macOS: dfvue 6.6 Intel and dfvue 6.5.1 ARM for Intel and ARM processors, resp., for macOS 15+ [Sequoia and newer]. The same packages without CustomTkinter are dfvue 6.6 Intel aqua and dfvue 6.5.1 ARM aqua for Intel and ARM processors, respectively.
Windows: dfvue 6.5.1, packaged on Windows 10. The same package without CustomTkinter is dfvue 6.5.1 azure
dfvue > 6.0 on macOS is either for Intel processors or for Apple Silicon (ARM) chips. The apps are notarized by Apple and might take a short while on first opening.
Some people have problems with CustomTkinter’s dropdown menus that do not use scrollbars, e.g. for selecting variables. In this case, uninstall CustomTkinter:
python -m pip uninstall customtkinteror download the standalone package without it. This is less beautiful but uses scrollbars with menus and might work better on your setup.
Quick usage guide
dfvue can be run from the command line:
dfvue csv_file*.csvor from within Python:
from dfvue import dfvue
dfvue('csv_file.csv')
where the csv file is optional. The latter can be left out and csv file(s) can be opened with the “Open File” button from within dfvue.
Note, dfvue uses the TkAgg backend of matplotlib. It must be called before any other call to matplotlib. This also means that you cannot launch it from within iPython if it was launched with –pylab. It can be called from within a standard iPython, though, or using ipython –gui tk.
General layout
On opening, dfvue presents currently only one panel for producing scatter/line plots. Here is the look in macOS light mode (higher resolution images can be found in the documentation):
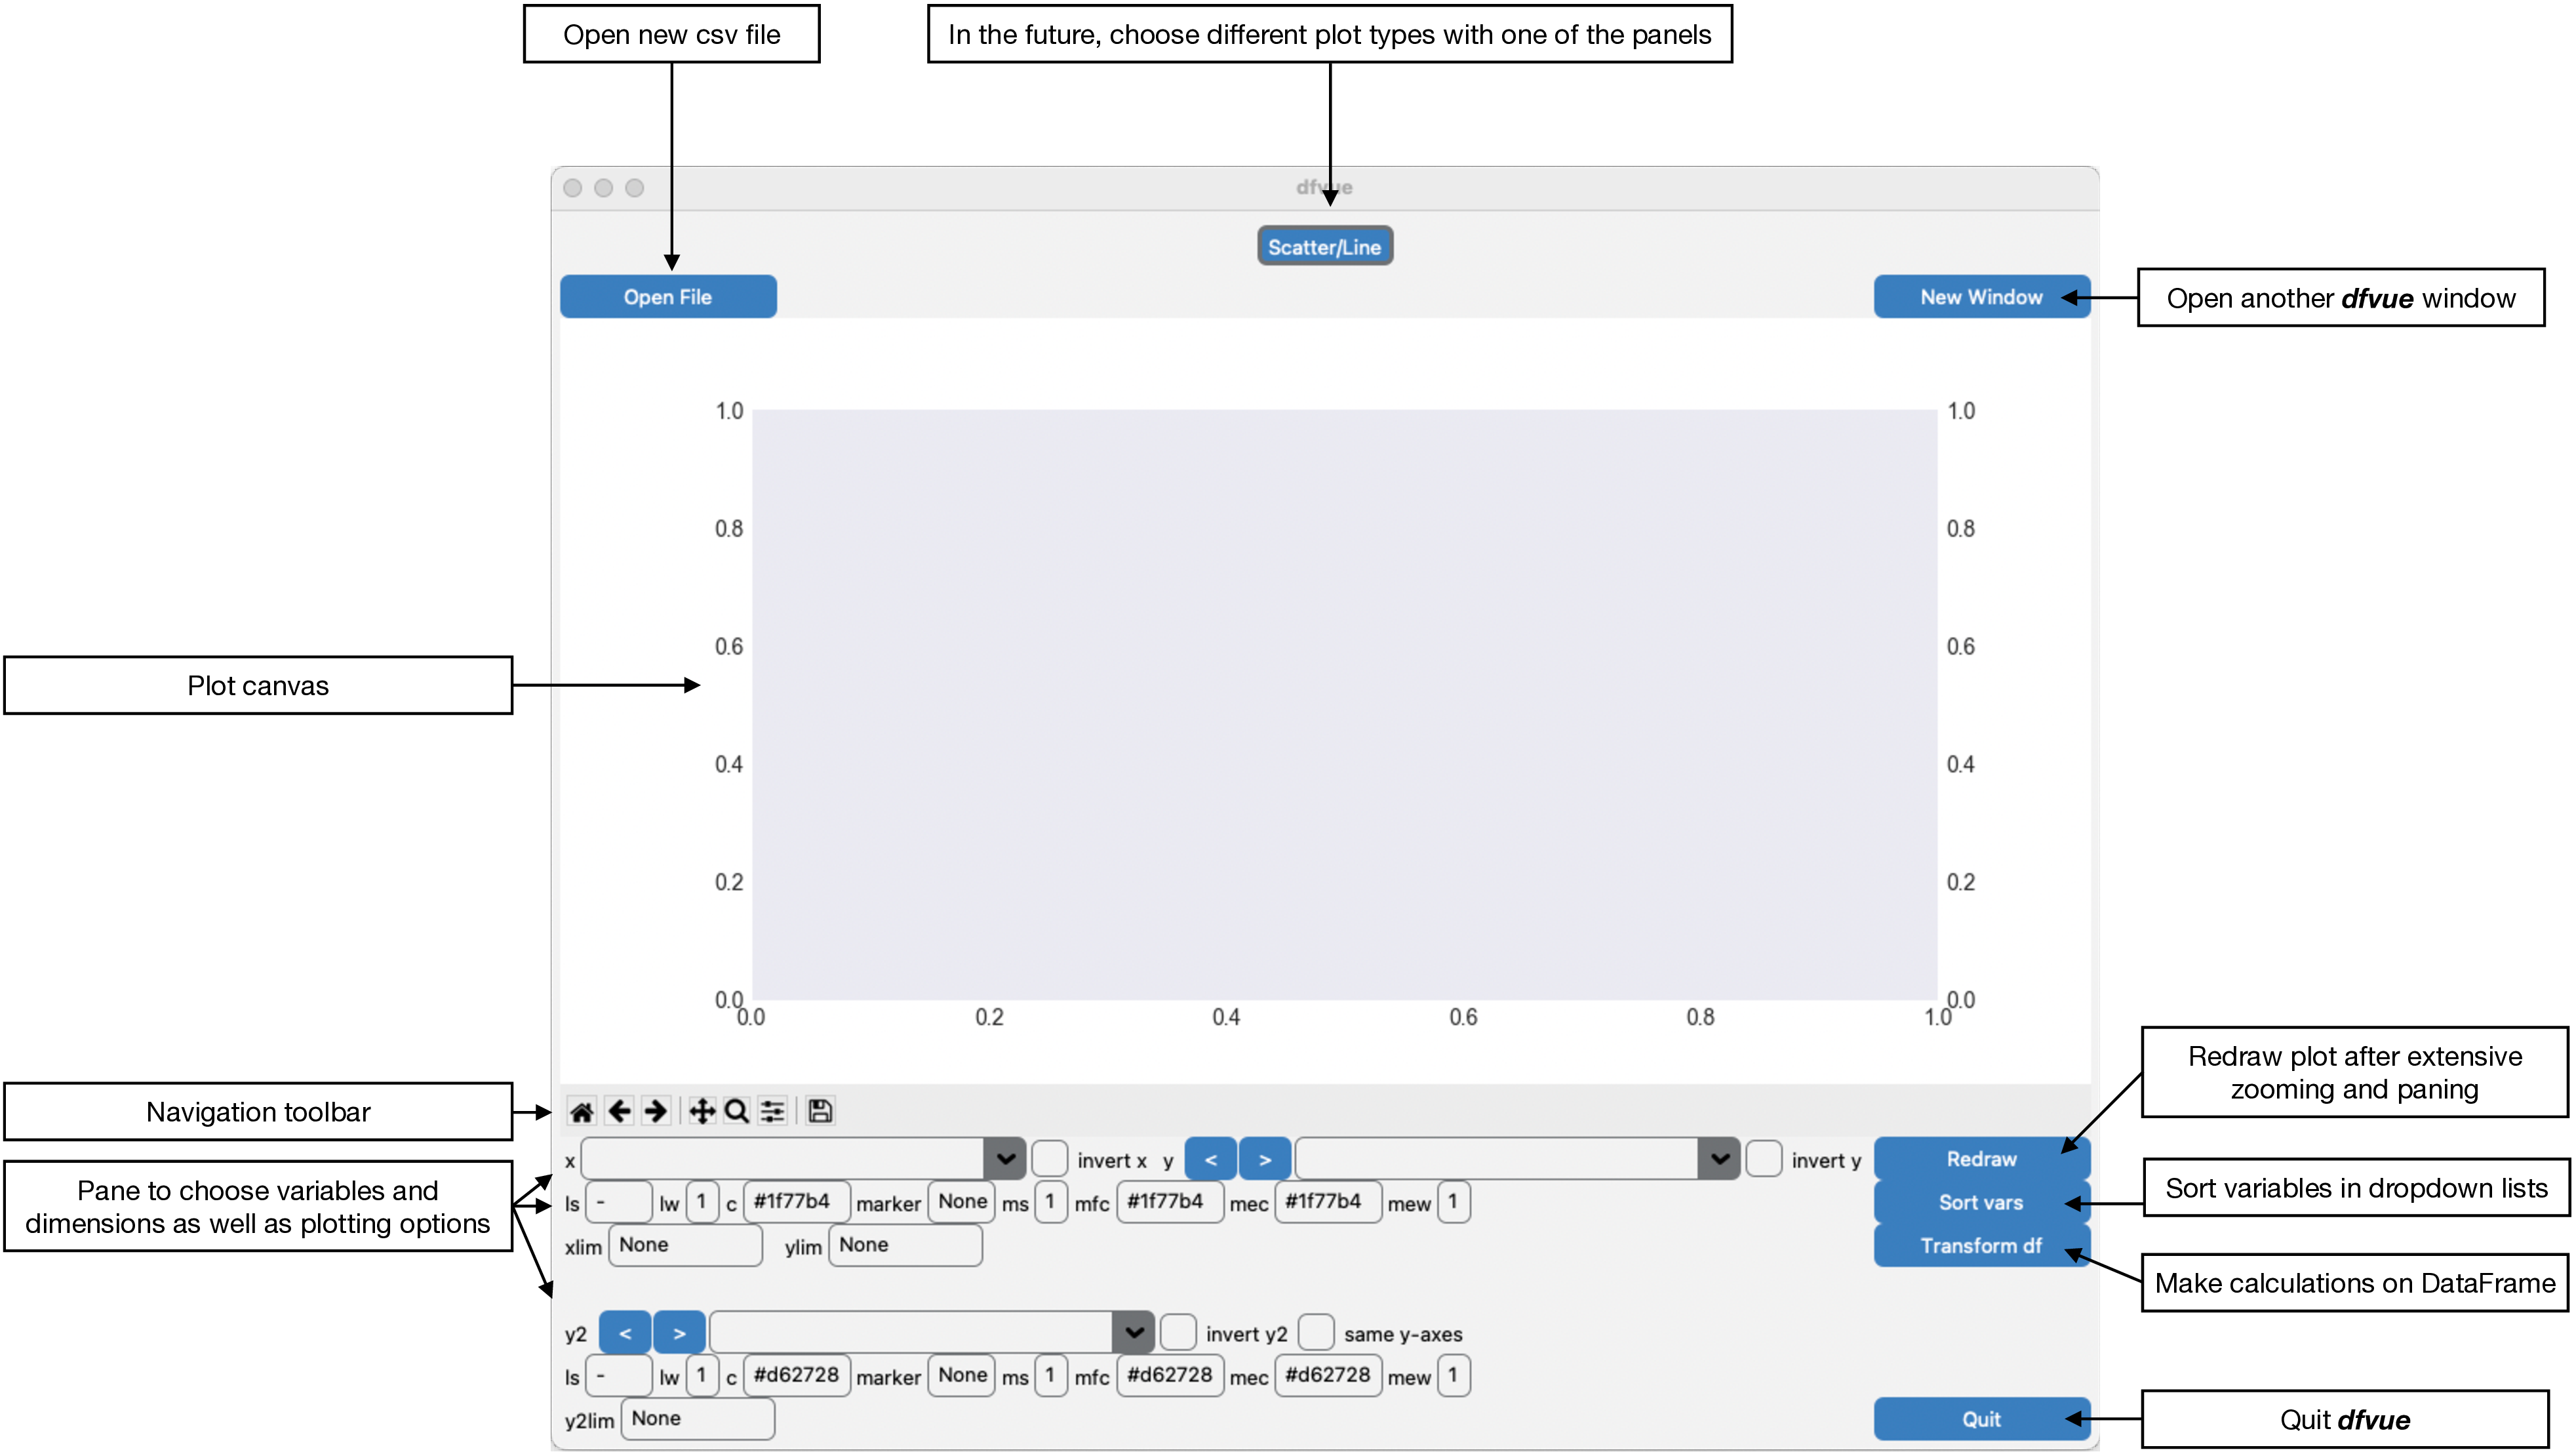
The pane is organised in this fashion: the plotting canvas, the Matplotlib navigation toolbar and the pane, where one can choose the plotting variables and plotting options. You can open another, identical window for the same csv file with the button “New Window” on the top right. You can then also read in a new csv file in one of the windows with the button “Open File”.
Reading a csv file
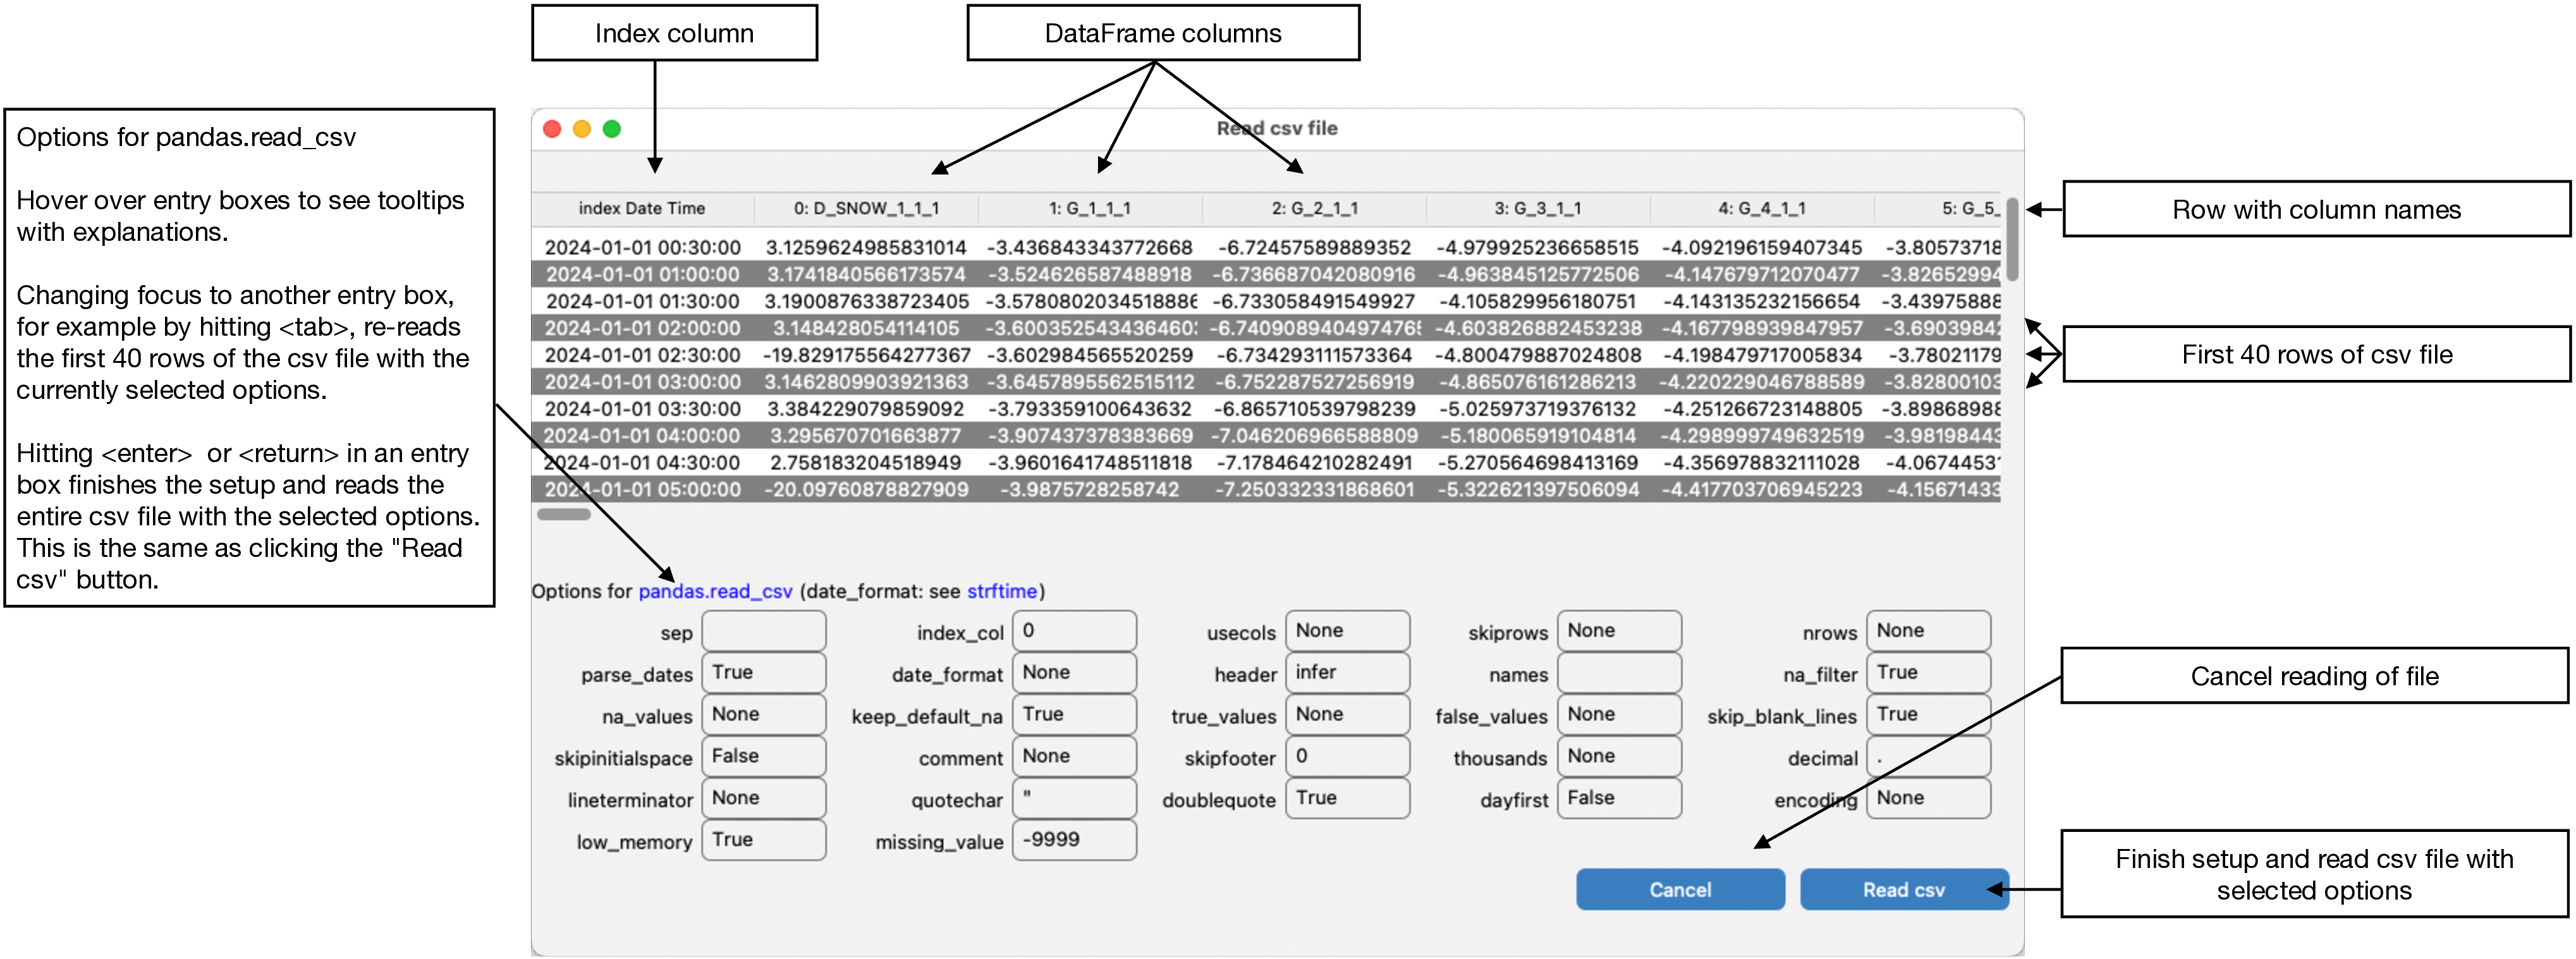
The “Read csv file” window opens when a csv file is given.
One or several csv files can be given on the command line:
dfvue csv_file*.csvor from within Python:
from dfvue import dfvue
dfvue('csv_file.csv')
or being selected from the “Choose csv file(s)” selector that opens when hitting the button “Open File”.
The “Read csv file(s)” window reads the first 40 rows of the (first) csv file with the pandas.read_csv method using the options given in the pane. It shows the resulting pandas.DataFrame in tabulated format. Changing focus from one option entry to another, for example by hitting the <tab> key, re-reads the first 40 rows of the csv file with pandas.read_csv using the selected options in the form. Hitting <enter> or <return> within the window reads the entire csv file(s) using the selected options and returns to the plotting panels. This is the same than pressing the “Read csv” button in the lower right corner. Multiple csv files will be read one by one with pandas.read_csv using the same options and then concatenated with pandas.concat.
The options in the form are default options of pandas.read_csv except for parse_date, which is set to True instead of False. Hover over the entry boxes to see explanations of the options in the tooltips.
If the csv file includes a Date/Time column, it is best to set this column as the index of the pandas.DataFrame by using index_col. Correct datetime is indicated if the index has the data type datetime64[ns] in the plot panels. This is then correctly interpreted by the underlying Matplotlib when plotting, zooming, or panning the axes.
missing_value is not an option of pandas.read_csv. It is here for convenience and any number entered in missing_value will be added to pandas na_values.
Reading a csv file with options on the command line
The following options of pandas.read_csv can be given on the command line:
-s separator, --sep separator
                      Delimiter to use.
-i columns, --index_col columns
                      Column(s) to use as index, either given as column index
                      or string name.
-k rows, --skiprows rows
                      Line number(s) to skip (0-indexed, must include comma,
                      e.g. "1," for skipping the second row) or number of lines
                      to skip (int, without comma) at the start of the file.
-p bool/list/dict, --parse_dates bool/list/dict
                      boolean, if True -> try parsing the index.
                      list of int or names, e.g. 1,2,3
                          -> try parsing columns 1, 2, and 3 each as a separate
                             date column.
                      list of lists, e.g. [1,3]
                          -> combine columns 1 and 3 and parse as a single
                             date column.
                      dict, e.g. "foo":[1,3]
                          -> parse columns 1 and 3 as date and call result "foo"
-d format_string, --date_format format_string
                      Will parse dates according to this format.
                      For example: "%Y-%m-%d %H:%M%S". See
                      https://docs.python.org/3/library/datetime.html#strftime-and-strptime-behavior
-m missing_value, --missing_value missing_value
                     Missing or undefined value set to NaN. For negative values,
                     use long format, e.g. --missing_value=-9999.
Examples of pandas.read_csv options
pandas.read_csv is very powerful and can read a lot of different formats. Here are some examples of csv files and the options for pandas.read_csv.
The most simple csv file would be like:
DATETIME,TA_1_1_1,RH_1_1,ALB_1_1_1
2015-01-01 00:30:00,-2.17794549084,97.2958103396,0.0
2015-01-01 01:00:00,-2.02584908489,98.2103903979,0.0
This can simply be read by setting index_col=0. The first column including date and time can simply a be a ISO8601 date, for example ‘2015-01-01 00:30:00’ or ‘2015-01-01T00:30:00’, or be given by date_format, which would be ‘%Y-%m-%d %H:%M:%S’ in this case. See the documentation of pandas.to_datetime or strftime.
Command line options would be:
dfvue -i 0 csv-file
or
dfvue -i 0 -d ‘%Y-%m-%d %H:%M:%S’ csv-file
A common practice is to put a special value for measurement errors or similar such as -9999:
DATETIME,TA_1_1_1,RH_1_1,ALB_1_1_1
2015-01-01 00:30:00,-2.17794549084,97.2958103396,-9999
2015-01-01 01:00:00,-2.02584908489,98.2103903979,-9999
This can be read by setting missing_value=-9999. On the command line, this is:
dfvue -i 0 –missing_value=-9999 csv-file
or
dfvue -i 0 -d ‘%Y-%m-%d %H:%M:%S’ -m ‘-9999’ csv-file
You have to use either put -9999 in quotes (-m ‘-9999) or use the long form –missing_value=-9999 instead of the short form -m -9999 in case of negative missing values because the command line would interpret -9999 as a separate option and would fail.
Date and time information can be given in different formats, for example:
Date;rho H1 (kg/m3);alb H1 (-);T_Psy H1 (degC);WS_EC H1 (m/s);Prec H1 (mm/30min)
01.01.2015 00:30;97.2958103396;-9999;-2.17794549084
01.01.2015 01:00;98.2103903979;-9999;-2.02584908489
which can be read by setting the date format: date_format=%d.%m.%Y %H:%M, index_col=0, missing_value=-9999, as well as the field separator sep=;. On the the command line, this is:
dfvue -s ‘;’ -i 0 -d ‘%d.%m.%Y %H:%M’ –missing_value=-9999 csv-file
Or in FLUXNET / ICOS / europe-fluxdata.eu format with a second row that shows the variable units:
TIMESTAMP_END,TA_1_1_1,RH_1_1_1,ALB_1_1_1
YYYYMMDDhhmm,degC,%,adimensional
201501010030,-2.17794549084,97.2958103396,-9999
201501010100,-2.02584908489,98.2103903979,-9999
which is read with date_format=%Y%M%d%H%M, index_col=0, skiprows=1,, and missing_value=-9999. Note the comma after ‘1’ in skiprows. Without the command, skiprows would be the number of rows to skip at the beginning, i.e. the first row, which would be wrong. The comma indicates that skiprows is a list and hence a list of row indexes, that means 1 here and thus skip the second row. This would be on the command line
dfvue -i 0 -d ‘%Y%m%d%H%M’ –skiprows=1, –missing_value=-9999 csv-file
Date and time information can also be in different columns. Here the second column is the day-of-the-year:
year,jday,hour,min,tair,rhair,albedo
2015,1,0,30,-2.17794549084,97.2958103396,-9999
2015,1,1,0,-2.02584908489,98.2103903979,-9999
which can be read by setting parse_dates=[0,1,2,3], index_col=0, and date_format=%Y %j %H %M, as well as missing_value=-9999. Note the brackets ‘[]’ around parse_dates. Without brackets it would parse columns 0, 1, 2, and 3 each as a separate date column, whereas with brackets it combines columns 0, 1, 2, and 3 and parses it as a single date column, with index ‘0’. It will use a space between column entries. Hence index_col=0 sets this combined column as the index, parsing the dates with the format ‘%Y %j %H %M’ with spaces between the strftime formats.
On the command line, this would be:
dfvue -i 0 -p [0,1,2,3] -d ‘%Y %j %H %M’ –missing_value=-9999 csv-file
If you want to have spaces in the list of parse_dates on the command line, you have to use the long form: –parse_dates=’[0, 1, 2, 3]’.
Scatter/Line panel
Here is the Scatter/Line panel in macOS light mode, describing all buttons, sliders, entry boxes, spinboxes, and menus:
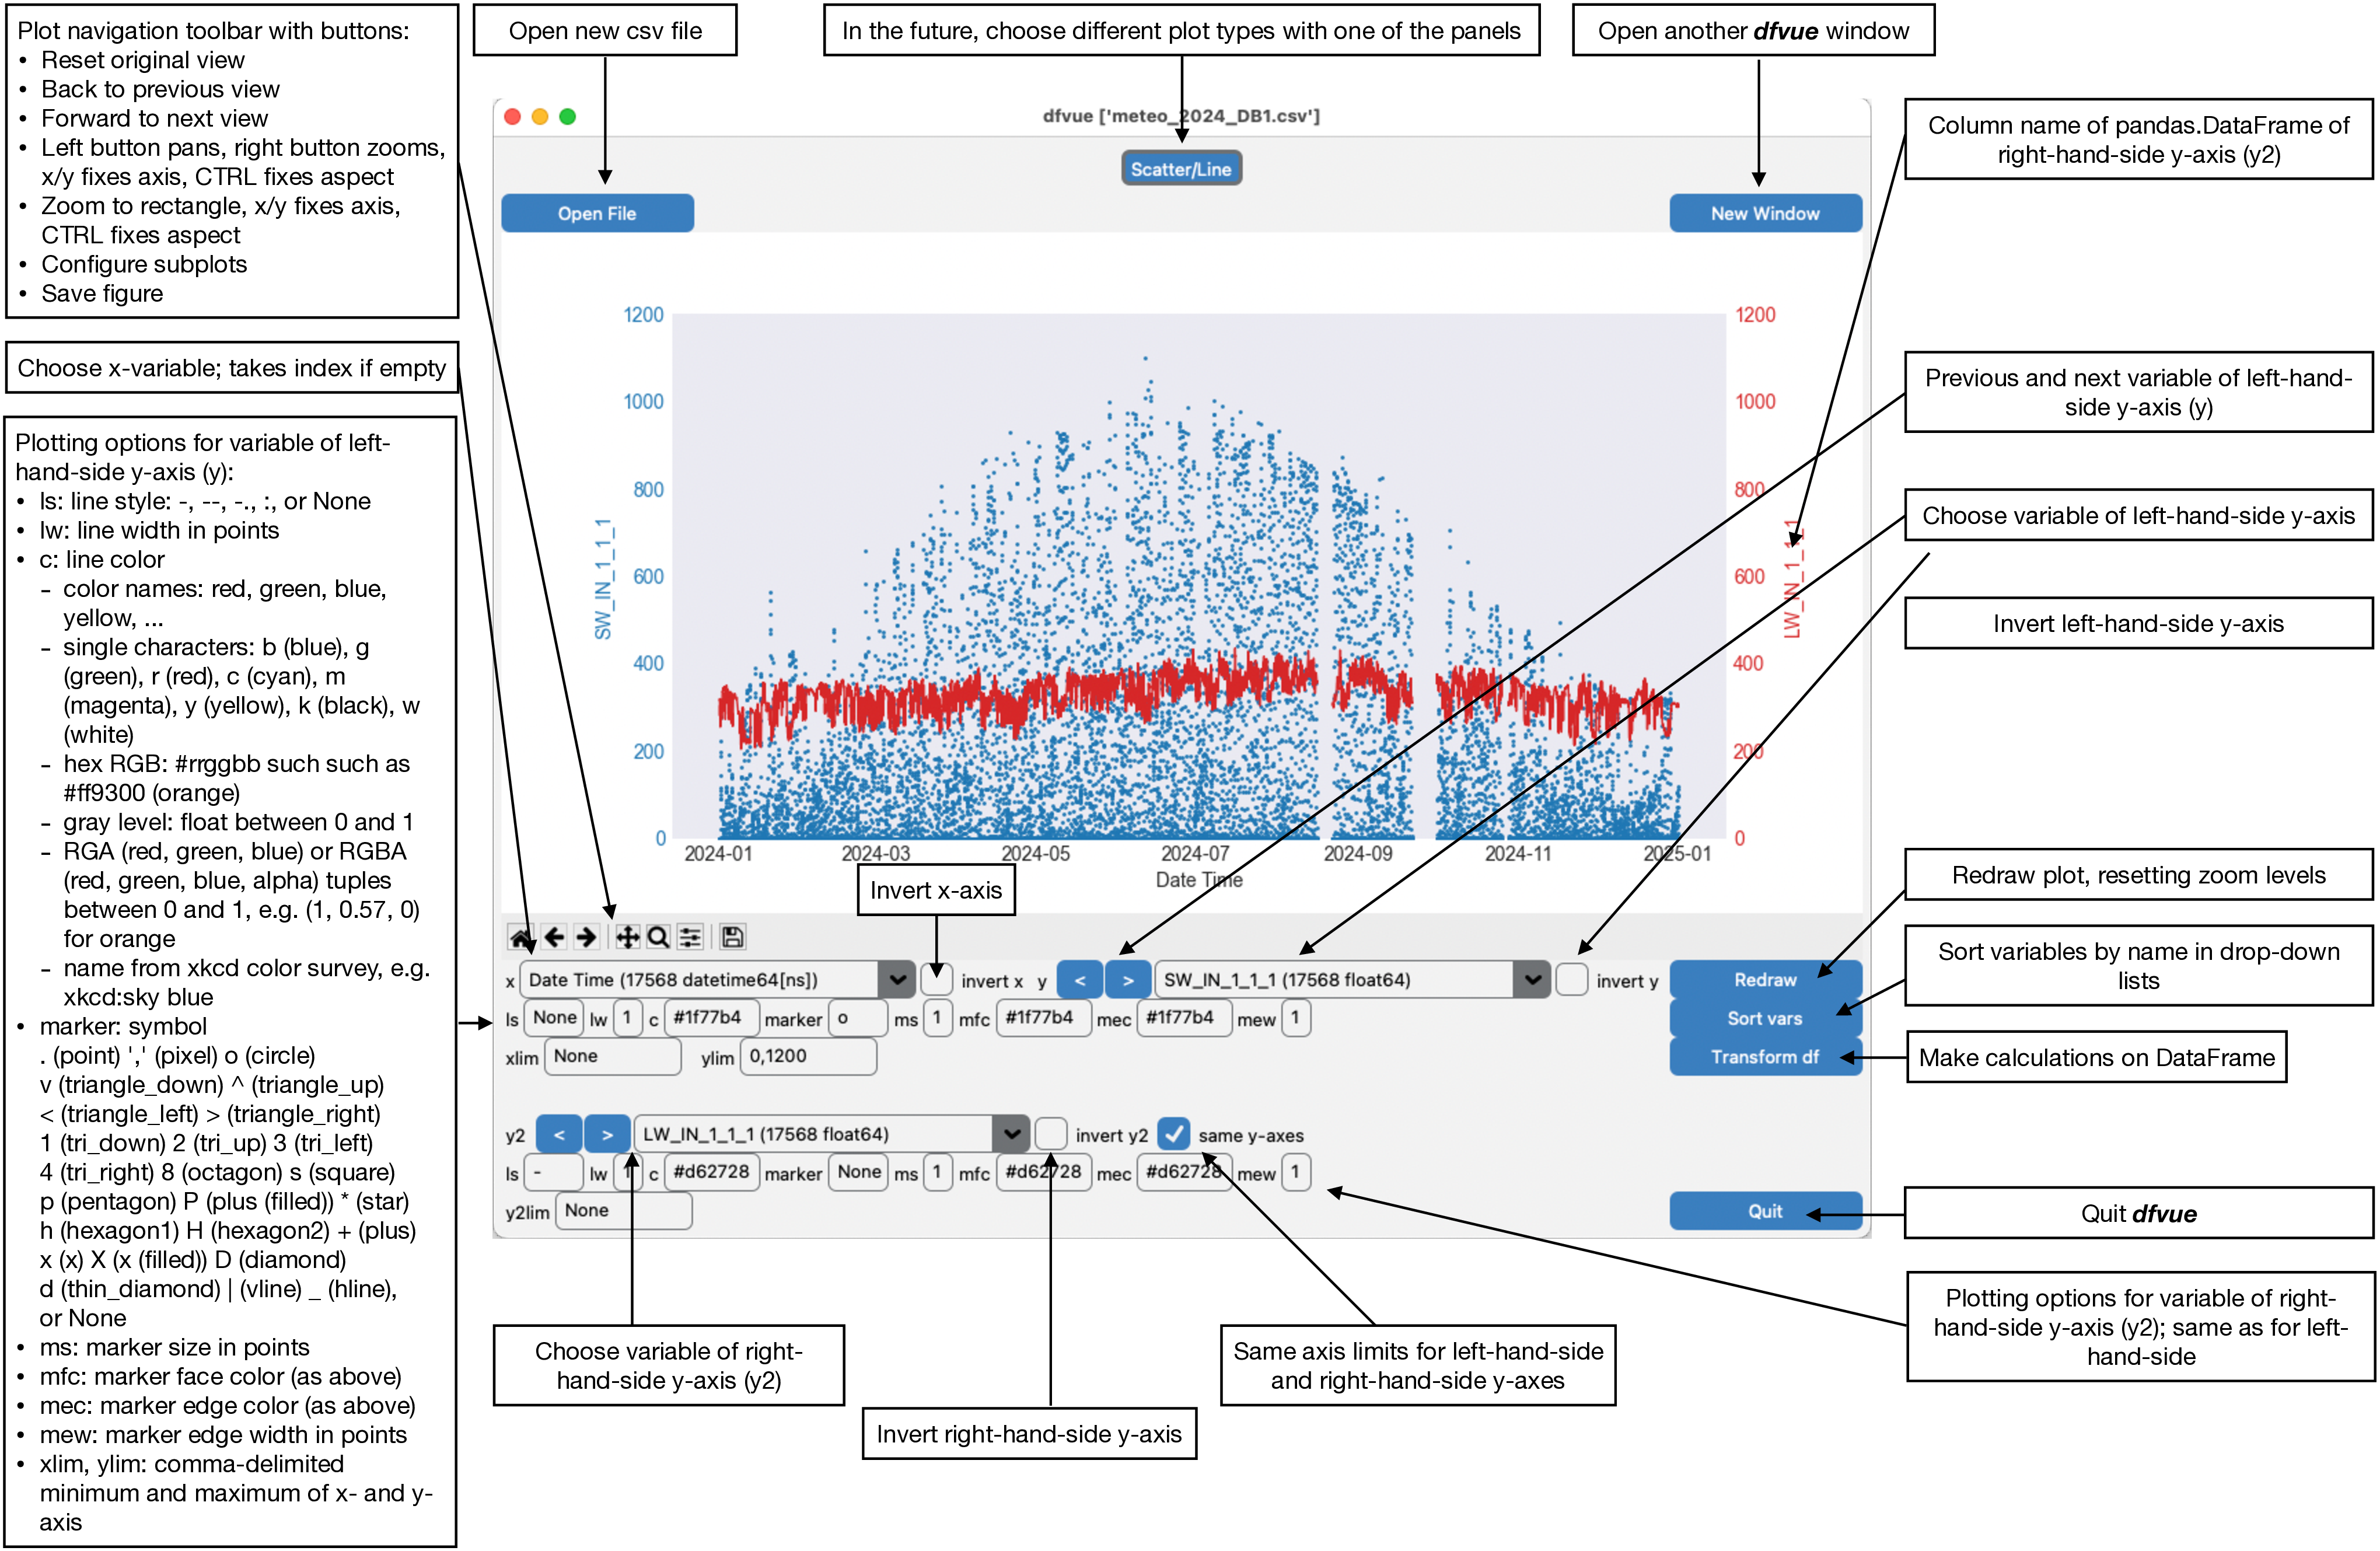
The default plot is a line plot with solid lines (line style ‘ls’ is ‘-‘). One can set line style ‘ls’ to None and set a marker symbol, e.g. ‘o’ for circles, to get a scatter plot. A large variety of line styles, marker symbols and color notations are supported.
Transform panel
You can do calculations on the Pandas DataFrame. Use the “Transform df” button to open the transform panel:
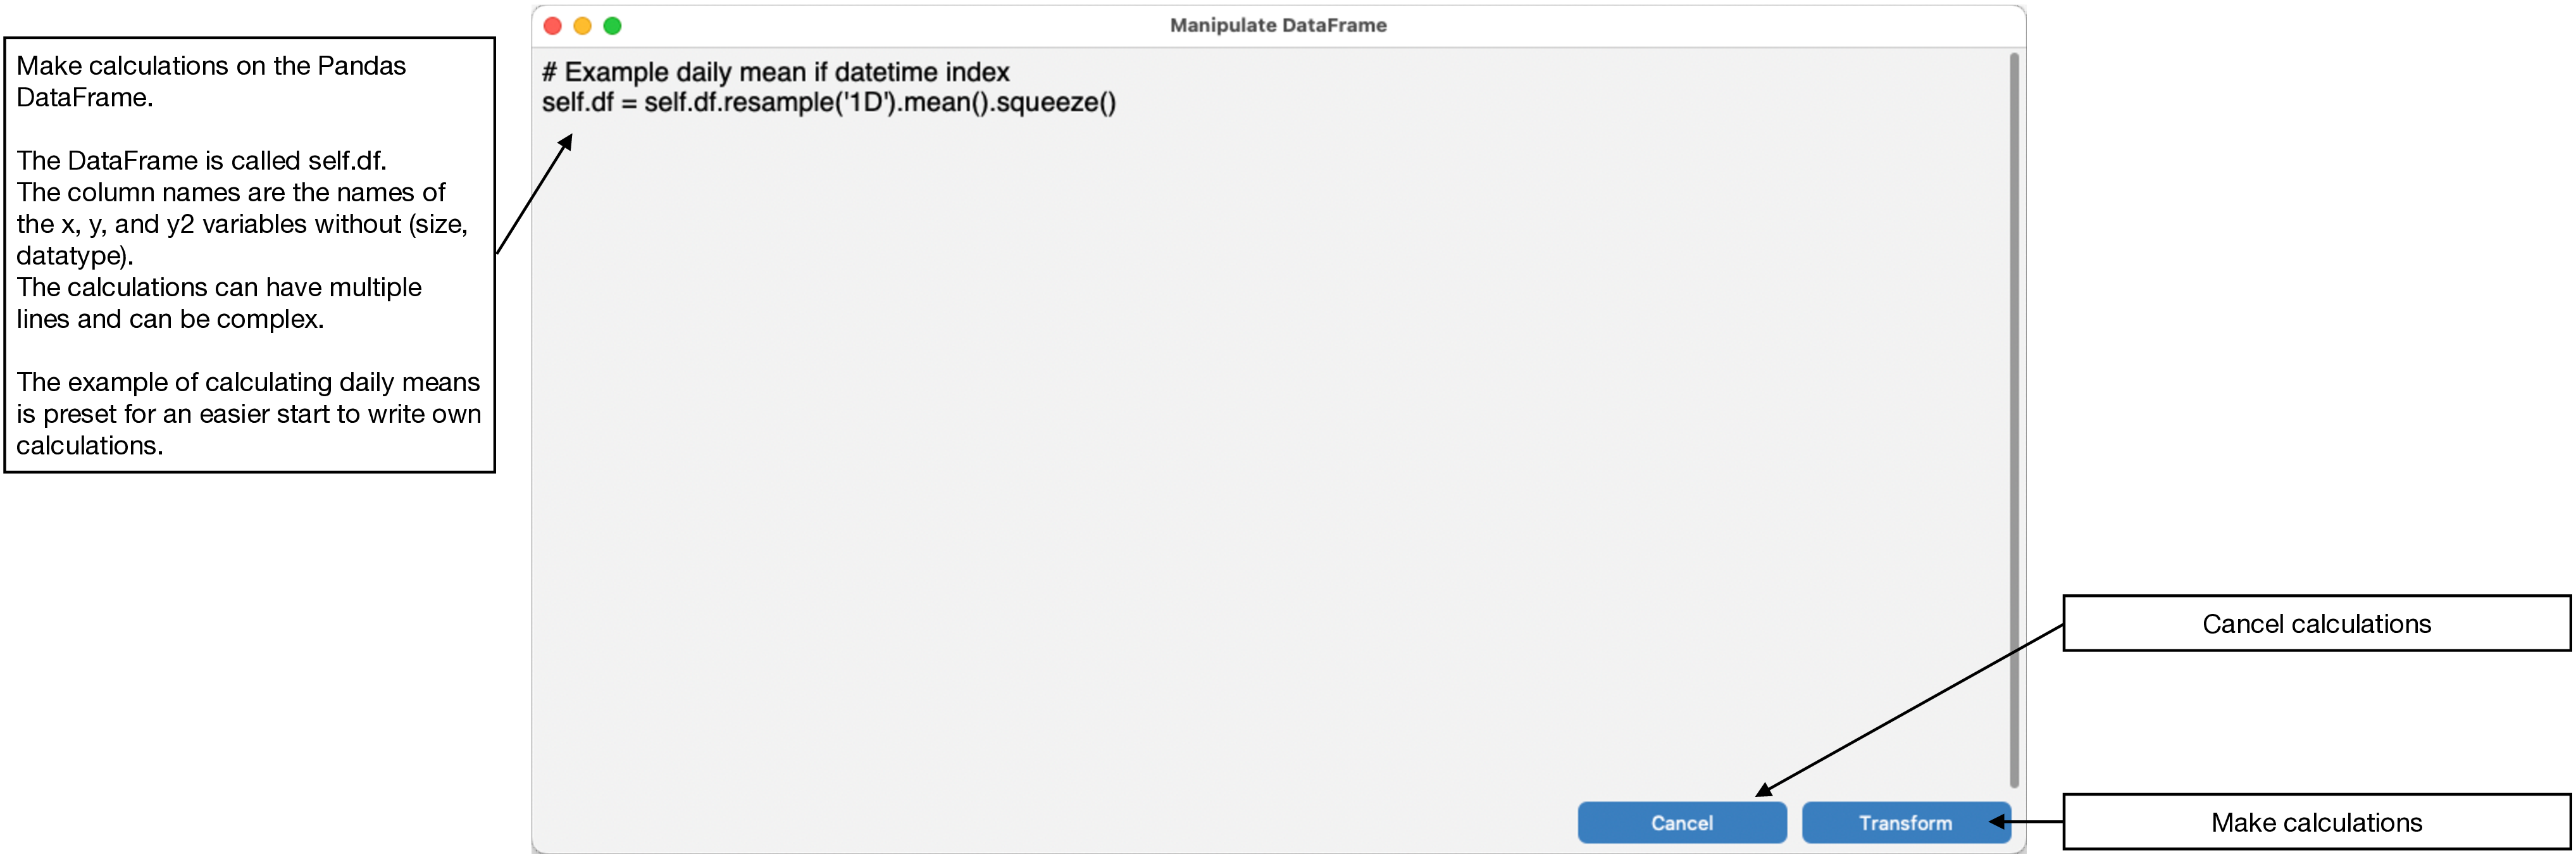
You can do calculations with the DataFrame. The DataFrame is called self.df. Its column names are the names of the x, y, and y2 variables in the drop-down menus without (size, datatype).
You can transform the DataFrame such as doing daily means of all columns. This transformation is preset in the transform panel for an easier start on writing DataFrame calculations and transformations: self.df = self.df.resample(‘1D’).mean().squeeze(). Calculations can have multiple lines, import libraries, etc.
License
dfvue is distributed under the MIT License. See the LICENSE file for details.
Copyright (c) 2023- Matthias Cuntz
dfvue uses CustomTkinter if installed. Otherwise it uses the Azure 2.0 theme by rdbende on Linux and Windows.
Standalone applications are produced with cx_Freeze, currently maintained by Marcelo Duarte.
Project details
Verified details
These details have been verified by PyPIProject links
GitHub Statistics
Maintainers
Release history Release notifications | RSS feed


Download files
Download the file for your platform. If you're not sure which to choose, learn more about installing packages.
Source Distribution
Built Distribution
Filter files by name, interpreter, ABI, and platform.
If you're not sure about the file name format, learn more about wheel file names.
Copy a direct link to the current filters
File details
Details for the file dfvue-6.6.tar.gz.
File metadata
- Download URL: dfvue-6.6.tar.gz
- Upload date:
- Size: 1.1 MB
- Tags: Source
- Uploaded using Trusted Publishing? Yes
- Uploaded via: twine/6.1.0 CPython/3.13.7
File hashes
| Algorithm | Hash digest | |
|---|---|---|
| SHA256 |
fa89e90b0ef0588f0c5ea207ce4914761a6d9ef4eec4b2e6a986740da6a3fae9
|
|
| MD5 |
4c18e4f97dd5a41fcb5c7618cf83711f
|
|
| BLAKE2b-256 |
6e7eea215eca4966cc07a55ec92a23f16562cf1ad74aea4e43ff295f5e32a3aa
|
Provenance
The following attestation bundles were made for dfvue-6.6.tar.gz:
Publisher:
main.yml on mcuntz/dfvue
-
Statement:
-
Statement type:
https://in-toto.io/Statement/v1 -
Predicate type:
https://docs.pypi.org/attestations/publish/v1 -
Subject name:
dfvue-6.6.tar.gz -
Subject digest:
fa89e90b0ef0588f0c5ea207ce4914761a6d9ef4eec4b2e6a986740da6a3fae9 - Sigstore transparency entry: 975092630
- Sigstore integration time:
-
Permalink:
mcuntz/dfvue@44114f8f30c9ee5f254b81694211968a1a2ad3c3 -
Branch / Tag:
refs/tags/v6.6 - Owner: https://github.com/mcuntz
-
Access:
public
-
Token Issuer:
https://token.actions.githubusercontent.com -
Runner Environment:
github-hosted -
Publication workflow:
main.yml@44114f8f30c9ee5f254b81694211968a1a2ad3c3 -
Trigger Event:
push
-
Statement type:
File details
Details for the file dfvue-6.6-py3-none-any.whl.
File metadata
- Download URL: dfvue-6.6-py3-none-any.whl
- Upload date:
- Size: 1.1 MB
- Tags: Python 3
- Uploaded using Trusted Publishing? Yes
- Uploaded via: twine/6.1.0 CPython/3.13.7
File hashes
| Algorithm | Hash digest | |
|---|---|---|
| SHA256 |
b850106720c7d0df775ad0cf9da25b7da367aca714a2c670272766ad90e321b6
|
|
| MD5 |
73a5696ee9a7aa994fd431409c5a02fc
|
|
| BLAKE2b-256 |
985553de69c2ff28d41e0391fae93bd86929053a1513694bae235ac31804ba55
|
Provenance
The following attestation bundles were made for dfvue-6.6-py3-none-any.whl:
Publisher:
main.yml on mcuntz/dfvue
-
Statement:
-
Statement type:
https://in-toto.io/Statement/v1 -
Predicate type:
https://docs.pypi.org/attestations/publish/v1 -
Subject name:
dfvue-6.6-py3-none-any.whl -
Subject digest:
b850106720c7d0df775ad0cf9da25b7da367aca714a2c670272766ad90e321b6 - Sigstore transparency entry: 975092639
- Sigstore integration time:
-
Permalink:
mcuntz/dfvue@44114f8f30c9ee5f254b81694211968a1a2ad3c3 -
Branch / Tag:
refs/tags/v6.6 - Owner: https://github.com/mcuntz
-
Access:
public
-
Token Issuer:
https://token.actions.githubusercontent.com -
Runner Environment:
github-hosted -
Publication workflow:
main.yml@44114f8f30c9ee5f254b81694211968a1a2ad3c3 -
Trigger Event:
push
-
Statement type:


