




dgNova (Designs Nova)

A Python library for Statistical Analysis and Simulations of Plant Breeding Experiments, designed specifically for researchers and students who are new to programming but want to understand field design concepts through practical implementation.
Overview
dgNova ("Designs Nova") makes it easy to:
- Simulate field experiments with realistic spatial patterns
- Analyze unreplicated field trials using moving grid methods
- Visualize spatial patterns and adjustments
- Learn experimental design concepts through interactive simulations
Dependencies
dgNova is built using robust scientific Python libraries:
- NumPy: For efficient numerical computations and array operations
- Pandas: For data manipulation and analysis
- Matplotlib: For creating static visualizations and plots
- Seaborn: For enhanced statistical visualizations
- Pillow: For image processing and animation support
These dependencies are automatically installed when you install dgNova using pip.
Current Status
The library is in active development. Currently implemented:
- Moving Grid Design (fully functional)
- Unreplicated Trial Analysis (UNREP class)
Future implementations will include:
- RCBD (Randomized Complete Block Design)
- Alpha-Lattice Design
- Augmented Design
- Split-Plot Design
- Mating Design
- Fieldbook Generation
- Spatial Analysis
Installation
pip install dgNova
Quick Start: Moving Grid Analysis
Example 1: Using Real Data
from dgNova import UNREP

# Load and analyze real field data
unrep = UNREP(
    data='test_data/UNREP_Triticale_Unreplicated_Trial_Moving_Grids.csv',
    response='Yield',        # yield measurements
    row='Row',              # row positions
    column='Column',        # column positions
    genotype='Genotype',    # genotype labels
    plot='Plot',            # plot identifiers
    design='moving_grid'    # analysis method
)

# Run analysis
results = unrep.analyze()
Example 2: Simulation Study
# Simulate a field experiment
unrep_sim = UNREP(
    row=15,              # field dimensions
    column=20,
    heterogeneity=0.8,   # spatial trend intensity (0-1)
    mean=5.3,            # base yield level
    sd=0,                # random variation
    ne=1,                # neighbor effects (0-1)
    design='moving_grid'
)

# Analyze simulated data
unrep_sim.analyze()
Key Features of UNREP Class
Initialization Parameters
data: CSV file, DataFrame, or None (for simulation)response: Name of response variable columnrow,column: Field dimensions or column namesgenotype: Genotype identifier columnplot: Plot identifier columndesign: Analysis method (currently 'moving_grid')
Simulation Parameters
heterogeneity: Spatial trend intensity (0-1)mean: Base response levelsd: Random variationne: Neighbor effects strength (0-1)
Analysis Methods
-
analyze(): Performs moving grid analysis- Adjusts for spatial trends
- Calculates efficiency metrics
- Returns adjusted values and statistics
-
Visualization Methods:
# Plot spatial distribution
unrep_sim.plot_spatial_analysis()

# Animate adjustment process
unrep_sim.animate(frames=100, interval=100)

# Show detailed regions
unrep_sim.plot_zoomed_regions()
Output Statistics
- Mean response
- Standard deviation
- Regression coefficient
- CV% (Adjusted)
- Relative efficiency
- Error variance
- LSD (5%)
Example Output
Using the Triticale trial data:
unrep = UNREP(data='UNREP_Triticale_Unreplicated_Trial_Moving_Grids.csv')
results = unrep.analyze()

# Sample output:
# Mean: 3.89
# Std: 1.14
# CV% (Adjusted): 29.37
# Relative Efficiency: 1.07
# Error Variance: 1.3040
# LSD (5%): 2.49
Understanding Moving Grid Design
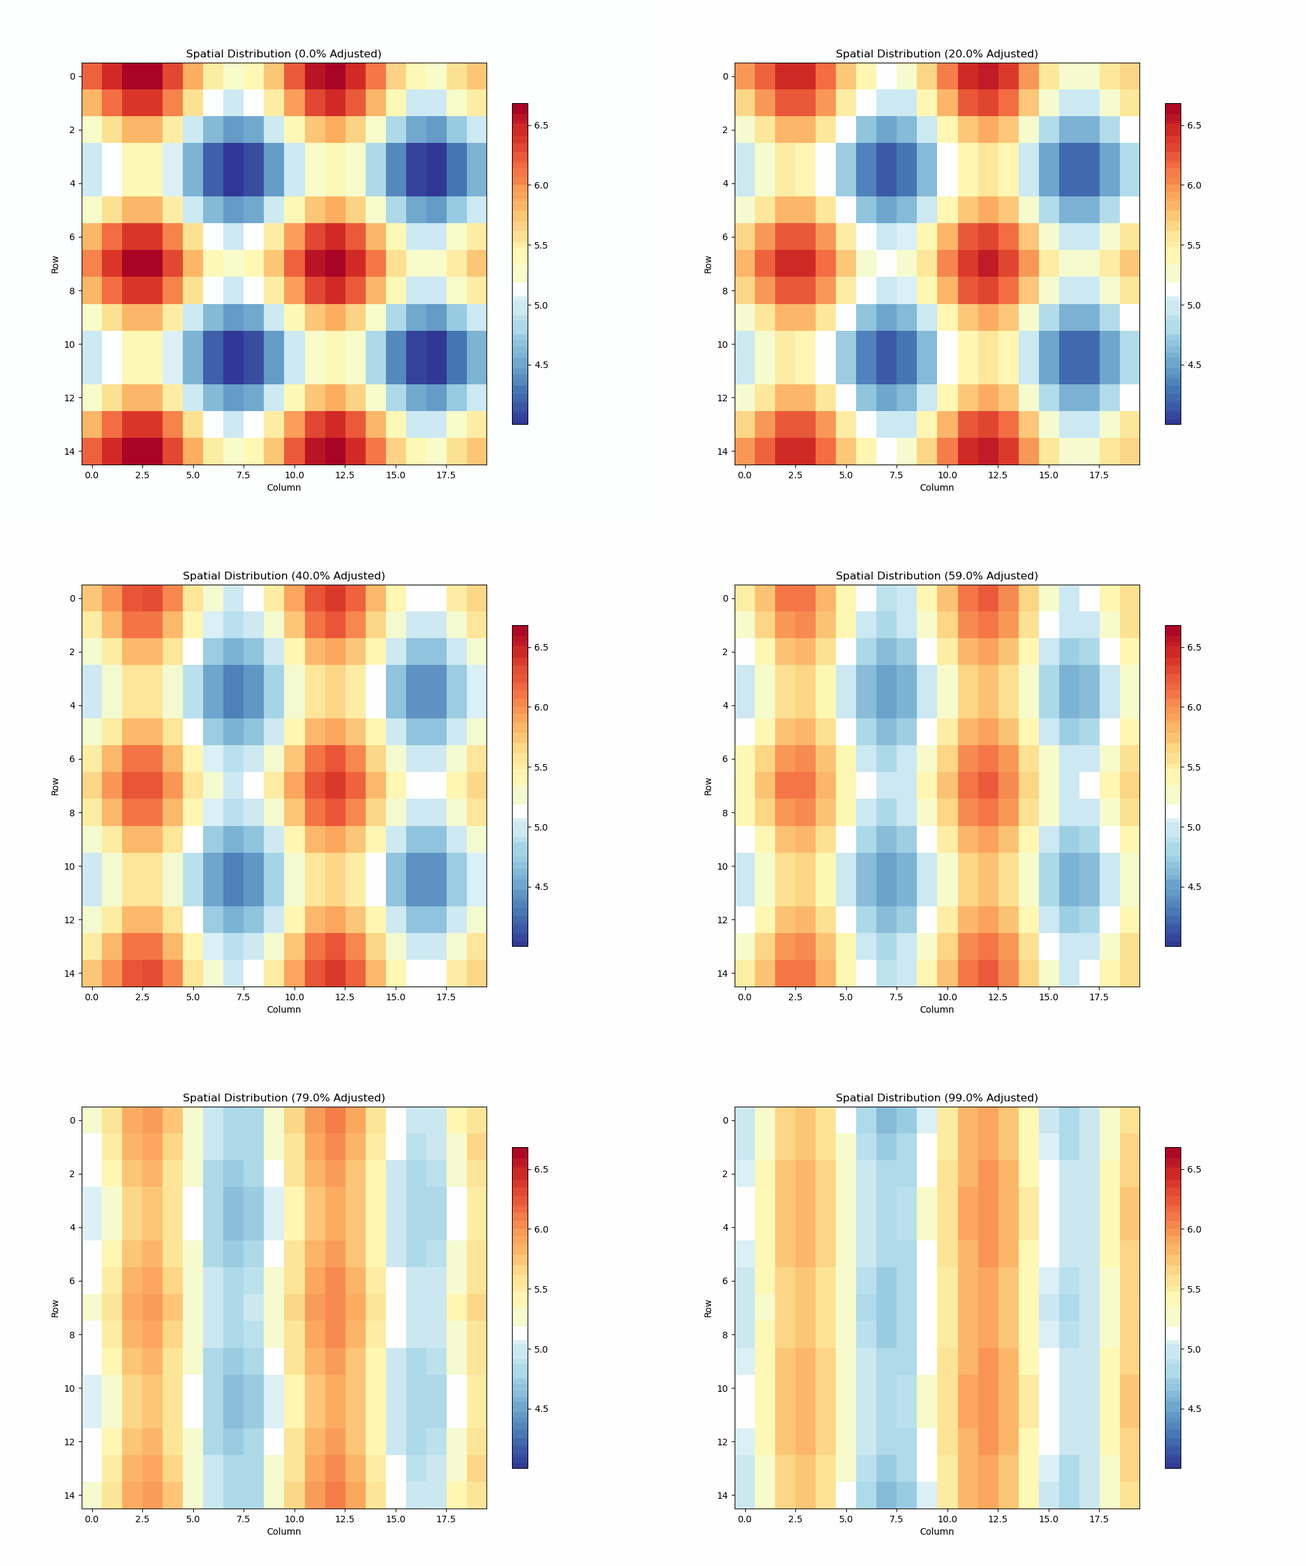
The moving grid method adjusts plot values based on local spatial patterns by:
- Analyzing neighboring plots
- Detecting systematic field trends
- Adjusting values to account for spatial variation
- Providing more accurate genotype estimates
Visualization Tools
-
Spatial Analysis Plot:
unrep.plot_spatial_analysis(use_adjusted=True)
- Shows raw vs adjusted values
- Highlights spatial patterns
- Displays adjustment effects
-
Animation of Adjustment Process:
unrep.animate(frames=100, interval=100)
- Visualizes gradual transformation
- Helps understand adjustment mechanism
Contributing
dgNova is in active development. Contributions are welcome! Areas of focus:
- Additional design implementations
- Enhanced visualization options
- Documentation improvements
- Test cases and examples
License
MIT License
Contact
- Author: Nadim Khan
- Email: nfornadim@gmail.com
- Website: https://nadimkhan.org
- GitHub: https://github.com/nfornadimkhan/dgNova
1 maintainer

Metadata
1 maintainer
Release files for dgNova 1.2.12
For a detailed explanation of source distributions (sdists) and built distributions (wheels), please see the package formats documentation.
Source distribution (sdist)
| File | Size | Uploaded | |
|---|---|---|---|
| dgnova-1.2.12.tar.gz | 47.6 kB | Details |
Built distribution (wheel)
| File | Interpreter | ABI | Platform | Reset |
|---|---|---|---|---|
| dgNova-1.2.12-py3-none-any.whl | Python 3 | none | any | Details |
Total release size: 102.6 kB
Release files / dgnova-1.2.12.tar.gz
| Download URL | dgnova-1.2.12.tar.gz |
|---|---|
| Size | 47.6 kB |
| Tags | Source |
|
SHA-256 checksum How to use checksums |
7e2c705c6e5fe2c669d9a52564348dcce9b5404c82e2128f6c72622732a7805e
|
|
BLAKE2b-256 checksum How to use checksums |
f6ad7e07e179b2d6f6268cf27a7d6f35a83e7e320a5727b3570b4c446dfd17fe
|
| Upload date | |
|
Uploaded using Trusted Publishing? What is trusted publishing? |
No |
| Uploaded via |
twine/6.0.1 CPython/3.9.20
|
Release files / dgNova-1.2.12-py3-none-any.whl
| Download URL | dgNova-1.2.12-py3-none-any.whl |
|---|---|
| Size | 55.0 kB |
| Tags | Python 3 |
|
SHA-256 checksum How to use checksums |
800bec8847dd7f8f7cd0e8fd565150278ceb3cfcc69b6bb41de0651f148b0ce7
|
|
BLAKE2b-256 checksum How to use checksums |
e39ee7711eb01b6df88e4592e411df2b81a6d0438d0c7c2e598e51d6fb9768ea
|
| Upload date | |
|
Uploaded using Trusted Publishing? What is trusted publishing? |
No |
| Uploaded via |
twine/6.0.1 CPython/3.9.20
|














