
django-observatory





Production observability for Django without a separate observability infrastructure.
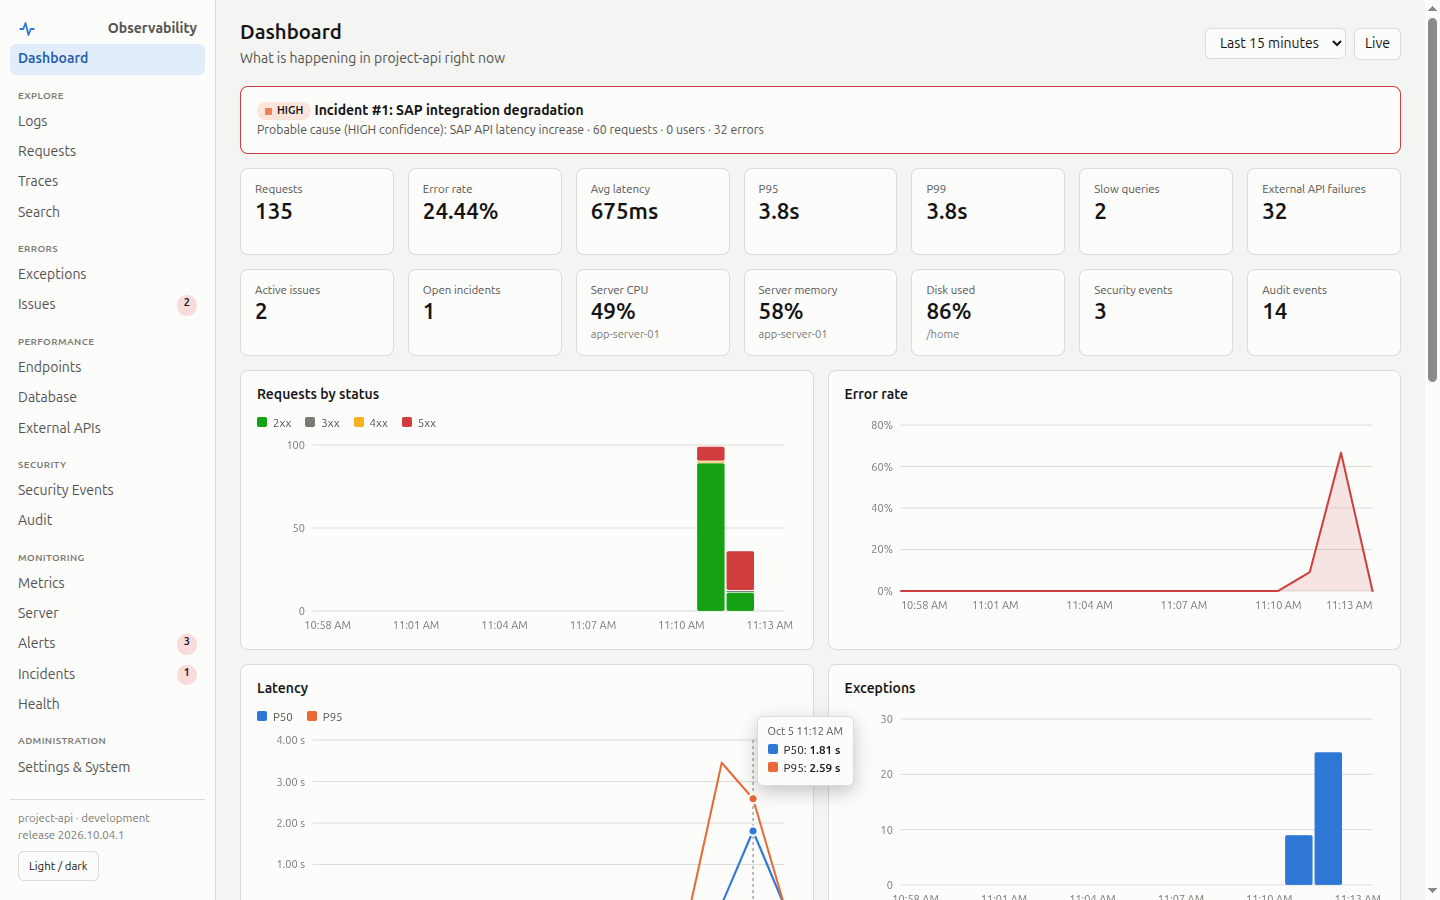
pip install, three settings, migrate — and /observability/ is a complete operations console for your
application: logs, requests, traces, SQL, exceptions, metrics, server resources, security and audit events,
alerts, and incidents with a probable cause. Everything is stored in your own database and rendered by
Django. No Docker, Redis, Elasticsearch, Prometheus, Grafana, Sentry, agent, collector or cloud service.
It was built for places where the usual stack is not an option: Windows servers, air-gapped networks, regulated environments where telemetry must not leave the organisation, and teams that are only allowed to install Python packages. It stays compatible with the wider ecosystem through W3C Trace Context and OTLP export.
Why
Most observability tools answer what happened. This one is designed to walk an operator from there to where, what caused it, who was affected and what to look at next — inside the application it is monitoring.
| Zero infrastructure | Python + Django + your existing database. One background thread per process. |
| Offline first | No outbound network calls, no CDN, no external assets. Works air-gapped. |
| Django aware | Request → view → template → ORM → SQL → external API, correlated automatically. |
| Explains incidents | Deterministic rules turn correlated signals into one incident with evidence. No AI. |
| Private by default | Bodies, cookies, auth headers and SQL parameters are never stored; secrets are redacted. |
| Cannot take you down | If observability fails, your application keeps serving. This is tested explicitly. |
Features
- Logs – your existing
loggingcalls are captured with no configuration; structuredobserve.info(...)API - Requests – every request gets a request id and trace id (
X-Request-ID,X-Trace-IDresponse headers) - Traces – waterfall of view, templates, SQL and outbound HTTP; manual
span()and@task - SQL – normalised statements, fingerprints, slow-query detection, N+1 hints, drill-down to the request
- External APIs –
urllib,requests,httpx: latency and failure rate per service - Exceptions and issues – grouping by stable fingerprint, lifecycle with regression detection, breadcrumbs
- Metrics – counters, gauges, histograms, timers, percentiles; automatic rollups
- Server resources – CPU, memory and disk per host
- Security events – logins, failed logins, permission denied, CSRF failures, password changes
- Audit trail – append-only, hash-chained, tamper-evident, separately permissioned
- Alerts – rules with deduplication and cooldown; in-app, email, webhook
- Incidents – correlated detection with probable cause, confidence, impact and evidence
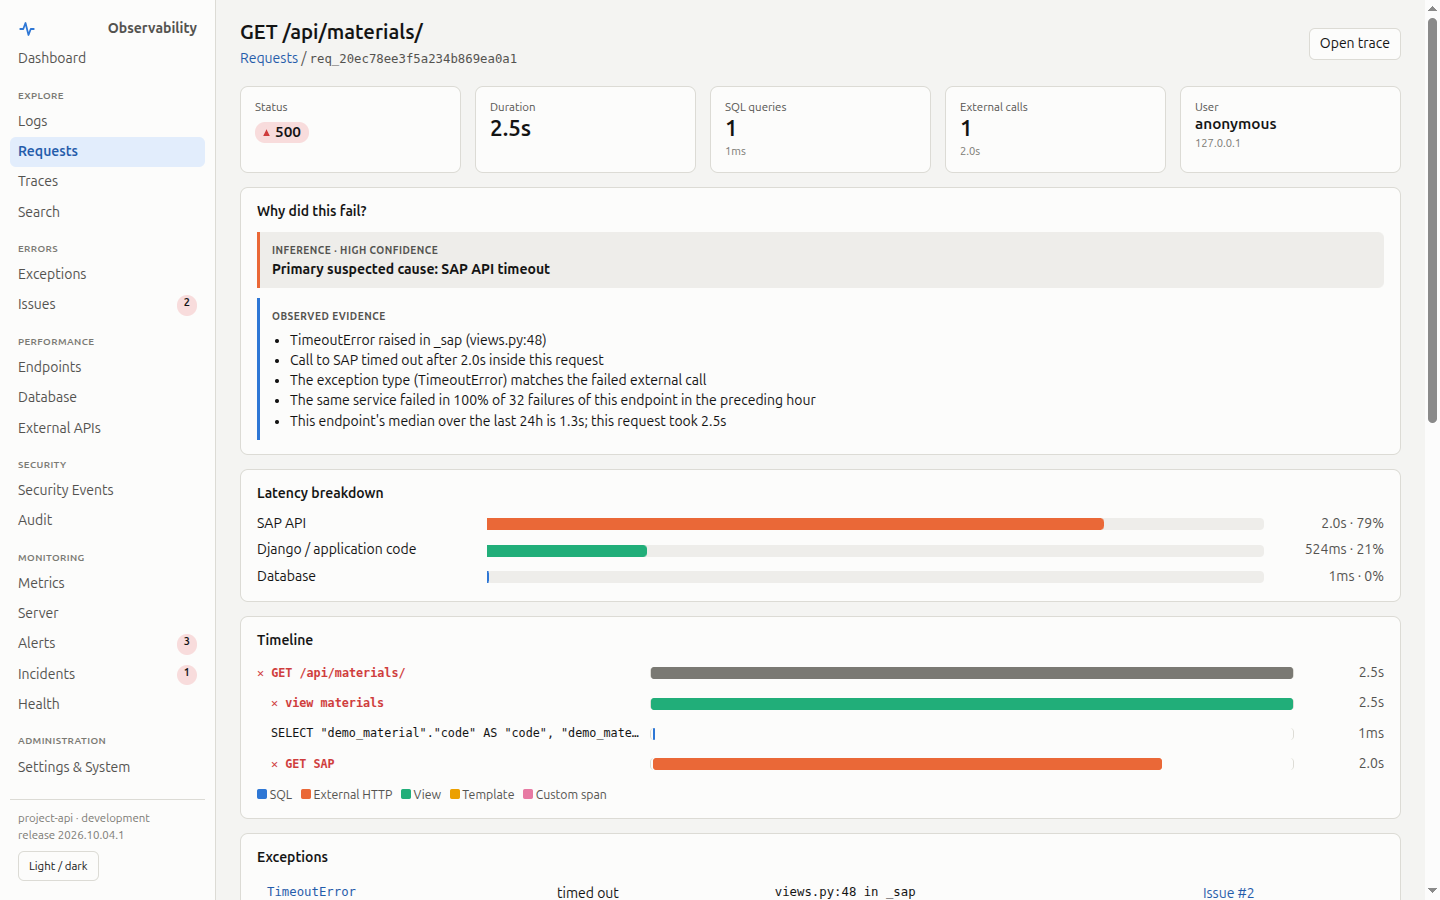
- Causal analysis – "Why is this slow?" / "Why did this fail?" on every request
- Query language –
status:>=500 AND duration:>1000 NOT path:/health* - Exports and API – CSV, JSON, NDJSON; read-only JSON API
- OpenTelemetry – W3C Trace Context in and out; OTLP/HTTP export without the SDK
Quick start
pip install django-observatory
# settings.py
INSTALLED_APPS = [
    # ...
    "django_observatory",
]

MIDDLEWARE = [
    "django_observatory.middleware.ObservabilityMiddleware",   # first, so it times the whole stack
    # ...
]
# urls.py
from django.urls import include, path

urlpatterns = [
    # ...
    path("observability/", include("django_observatory.urls")),
]
python manage.py migrate
python manage.py observability_test     # verifies every component in your environment
python manage.py runserver
Open http://localhost:8000/observability/ as a staff user. That is the whole setup.
Optional extras: pip install "django-observatory[process]" adds psutil (CPU and memory readings on every
platform, per-process memory).
Use it from your code
Nothing is required: requests, SQL, outbound HTTP, exceptions and logging are captured automatically.
The API is for what only you know.
import logging
from django_observatory import observe, span, task, metrics, audit, security

logging.getLogger(__name__).info("material created", extra={"material_code": "A1023"})   # just works
observe.warning("stock_low", material_code="A1023", quantity=4)

with span("generate_monthly_report", report_type="monthly"):
    generate_report()

@task
def nightly_sync(): ...

metrics.increment("invoice.processed")
metrics.gauge("queue.depth", 42)
with metrics.timer("invoice.processing"):
    process_invoice()

audit.record(action="UPDATE", object_type="Material", object_id="A1023",
             changes={"quantity": {"before": 120, "after": 80}})
security.record(event="PERMISSION_DENIED", resource="/api/materials/", reason="Missing permission")
From a symptom to a cause
A dependency slows down. Within a minute the dashboard shows one incident instead of a wall of alerts:
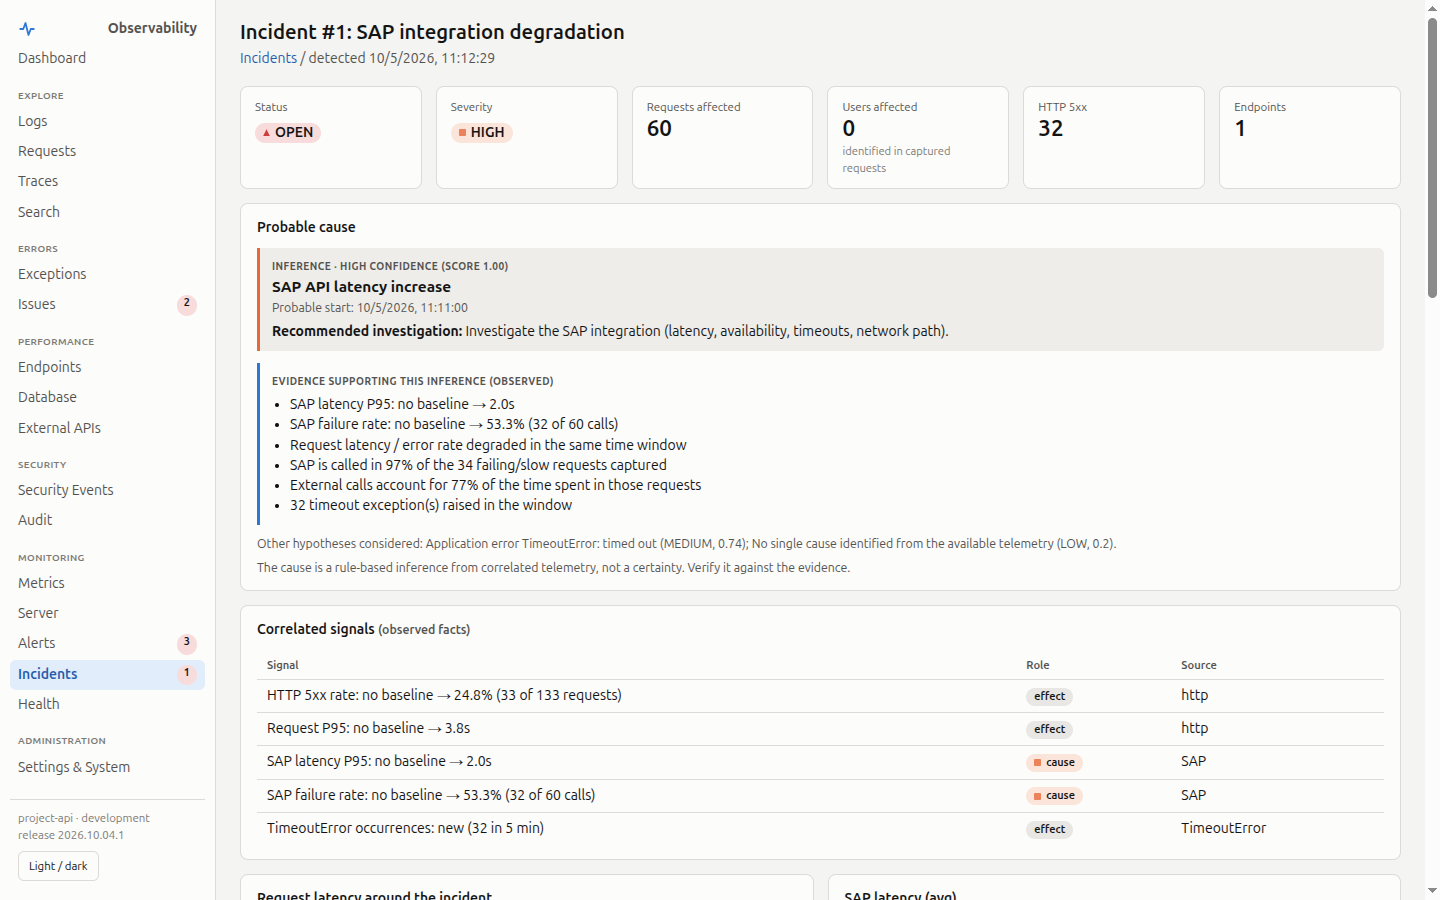
The probable cause is an inference and is labelled as one, with its confidence. The evidence beneath it is observed fact: the numbers before and after, the share of failing requests that call the service, the exceptions raised. Opening any affected request shows where its time went:
More screenshots: endpoints · server · logs · database, dark mode
Documentation
Full index: docs/index.md
Requirements
- Python 3.10 – 3.13
- Django 4.2, 5.2 or 6.x
- Any database Django supports. Tested on SQLite; designed for PostgreSQL and SQL Server (portable column types, no database-specific SQL)
- Windows, Linux or macOS; WSGI or ASGI
Try the demo
git clone https://github.com/AzeemQidwai/django-observatory.git
cd django-observatory/example
pip install -e ..
python manage.py migrate
python manage.py createsuperuser
python manage.py runserver
Browse /api/materials/ a few times, open /sap/degrade/?on=1 to make the simulated SAP dependency slow,
call /api/materials/ again, and watch /observability/ open an incident named after the cause.
What this is not
It is not the first observability tool for Django, and it does not replace OpenTelemetry, or Sentry in every scenario. Django Silk, Django Debug Toolbar, Sentry and the OpenTelemetry integrations are excellent at what they do. This package combines Django-native instrumentation, local storage, security and audit monitoring, and incident correlation into something you can deploy anywhere Django runs — and it exports to those ecosystems when you outgrow it.
Scaling limits are documented honestly in Architecture and Deployment.
Contributing
Issues and pull requests are welcome. Read CONTRIBUTING.md and the Code of Conduct. Security reports go through SECURITY.md.
License
1 maintainer

Metadata
1 maintainer
Release files for django-observatory 0.1.0
For a detailed explanation of source distributions (sdists) and built distributions (wheels), please see the package formats documentation.
Source distribution (sdist)
| File | Size | Uploaded | |
|---|---|---|---|
| django_observatory-0.1.0.tar.gz | 193.5 kB | Details |
Built distribution (wheel)
| File | Interpreter | ABI | Platform | Reset |
|---|---|---|---|---|
| django_observatory-0.1.0-py3-none-any.whl | Python 3 | none | any | Details |
Total release size: 348.8 kB
Release files / django_observatory-0.1.0.tar.gz
| Download URL | django_observatory-0.1.0.tar.gz |
|---|---|
| Size | 193.5 kB |
| Tags | Source |
|
SHA-256 checksum How to use checksums |
9a78566ccd7d56c175892ef0bd2201ec63d951a37ec325d12e7b317908fec7c0
|
|
BLAKE2b-256 checksum How to use checksums |
9924c1a9759db555f69d3c0c94ffc1463eba4ccb669b988fafe50a76eee750c1
|
| Upload date | |
|
Uploaded using Trusted Publishing? What is trusted publishing? |
Yes |
| Uploaded via |
twine/7.0.0 CPython/3.13.14
|
Provenance
Provenance describes where a file came from. On PyPI, provenance is shared via attestations, which provide a verifiable record of the build or publishing details. View details, limitations and caveats.


PyPI Publish Attestation
PyPI verified that this artifact, at this checksum, originated from the publisher listed below.
Signed by GitHub Actions, verified by PyPI on Oct 5, 2026.
Transparency logRelease files / django_observatory-0.1.0-py3-none-any.whl
| Download URL | django_observatory-0.1.0-py3-none-any.whl |
|---|---|
| Size | 155.3 kB |
| Tags | Python 3 |
|
SHA-256 checksum How to use checksums |
ffbb3b11d2bb685c7d125f667bff5c07d8f42aab9b09a94e4ab18c4c382fdaf6
|
|
BLAKE2b-256 checksum How to use checksums |
c6a89c95d0a9f4894ceb5b2dfee10c4d574e59ec375baa760c484f6eec40d579
|
| Upload date | |
|
Uploaded using Trusted Publishing? What is trusted publishing? |
Yes |
| Uploaded via |
twine/7.0.0 CPython/3.13.14
|
Provenance
Provenance describes where a file came from. On PyPI, provenance is shared via attestations, which provide a verifiable record of the build or publishing details. View details, limitations and caveats.
PyPI Publish Attestation
PyPI verified that this artifact, at this checksum, originated from the publisher listed below.
Signed by GitHub Actions, verified by PyPI on Oct 5, 2026.
Transparency log















