
This release is a pre-release and may not be stable for production use.
django-prometheus
Export Django monitoring metrics for Prometheus.io





Features
This library provides Prometheus metrics for Django related operations:
- Requests & Responses
- Database access done via Django ORM
- Cache access done via Django Cache framework
Metrics Reference
For a detailed list and explanation of all metrics exported by this library, see documentation/metrics.md.
Usage
Requirements
- Django >= 4.2
- Python 3.9 and above.
Installation
Install with:
pip install django-prometheus
Or, if you're using a development version cloned from this repository:
python path-to-where-you-cloned-django-prometheus/setup.py install
This will install prometheus_client as a dependency.
Quickstart
In your settings.py:
INSTALLED_APPS = [
   ...
   'django_prometheus',
   ...
]

MIDDLEWARE = [
    'django_prometheus.middleware.PrometheusBeforeMiddleware',
    # All your other middlewares go here, including the default
    # middlewares like SessionMiddleware, CommonMiddleware,
    # CsrfViewmiddleware, SecurityMiddleware, etc.
    'django_prometheus.middleware.PrometheusAfterMiddleware',
]
In your urls.py:
urlpatterns = [
    ...
    path('', include('django_prometheus.urls')),
]
Configuration
Prometheus uses Histogram based grouping for monitoring latencies. The default buckets are:
PROMETHEUS_LATENCY_BUCKETS = (0.01, 0.025, 0.05, 0.075, 0.1, 0.25, 0.5, 0.75, 1.0, 2.5, 5.0, 7.5, 10.0, 25.0, 50.0, 75.0, float("inf"),)
You can define custom buckets for latency, adding more buckets decreases performance but increases accuracy: https://prometheus.io/docs/practices/histograms/
PROMETHEUS_LATENCY_BUCKETS = (.1, .2, .5, .6, .8, 1.0, 2.0, 3.0, 4.0, 5.0, 6.0, 7.5, 9.0, 12.0, 15.0, 20.0, 30.0, float("inf"))
You can have a custom namespace for your metrics:
PROMETHEUS_METRIC_NAMESPACE = "project"
This will prefix all metrics with project_ word like this:
project_django_http_requests_total_by_method_total{method="GET"} 1.0
Monitoring your databases
SQLite, MySQL, and PostgreSQL databases can be monitored. Just
replace the ENGINE property of your database, replacing
django.db.backends with django_prometheus.db.backends.
DATABASES = {
    'default': {
        'ENGINE': 'django_prometheus.db.backends.sqlite3',
        'NAME': os.path.join(BASE_DIR, 'db.sqlite3'),
    },
}
Monitoring your caches
Filebased, memcached, redis caches can be monitored. Just replace
the cache backend to use the one provided by django_prometheus
django.core.cache.backends with django_prometheus.cache.backends.
CACHES = {
    'default': {
        'BACKEND': 'django_prometheus.cache.backends.filebased.FileBasedCache',
        'LOCATION': '/var/tmp/django_cache',
    }
}
Monitoring your models
You may want to monitor the creation/deletion/update rate for your model. This can be done by adding a mixin to them. This is safe to do on existing models (it does not require a migration).
If your model is:
class Dog(models.Model):
    name = models.CharField(max_length=100, unique=True)
    breed = models.CharField(max_length=100, blank=True, null=True)
    age = models.PositiveIntegerField(blank=True, null=True)
Just add the ExportModelOperationsMixin as such:
from django_prometheus.models import ExportModelOperationsMixin

class Dog(ExportModelOperationsMixin('dog'), models.Model):
    name = models.CharField(max_length=100, unique=True)
    breed = models.CharField(max_length=100, blank=True, null=True)
    age = models.PositiveIntegerField(blank=True, null=True)
This will export 3 metrics, django_model_inserts_total{model="dog"},
django_model_updates_total{model="dog"} and
django_model_deletes_total{model="dog"}.
Note that the exported metrics are counters of creations, modifications and deletions done in the current process. They are not gauges of the number of objects in the model.
Starting with Django 1.7, migrations are also monitored. Two gauges
are exported, django_migrations_applied_by_connection and
django_migrations_unapplied_by_connection. You may want to alert if
there are unapplied migrations.
If you want to disable the Django migration metrics, set the
PROMETHEUS_EXPORT_MIGRATIONS setting to False.
Monitoring and aggregating the metrics
Prometheus is quite easy to set up. An example prometheus.conf to
scrape 127.0.0.1:8001 can be found in examples/prometheus.
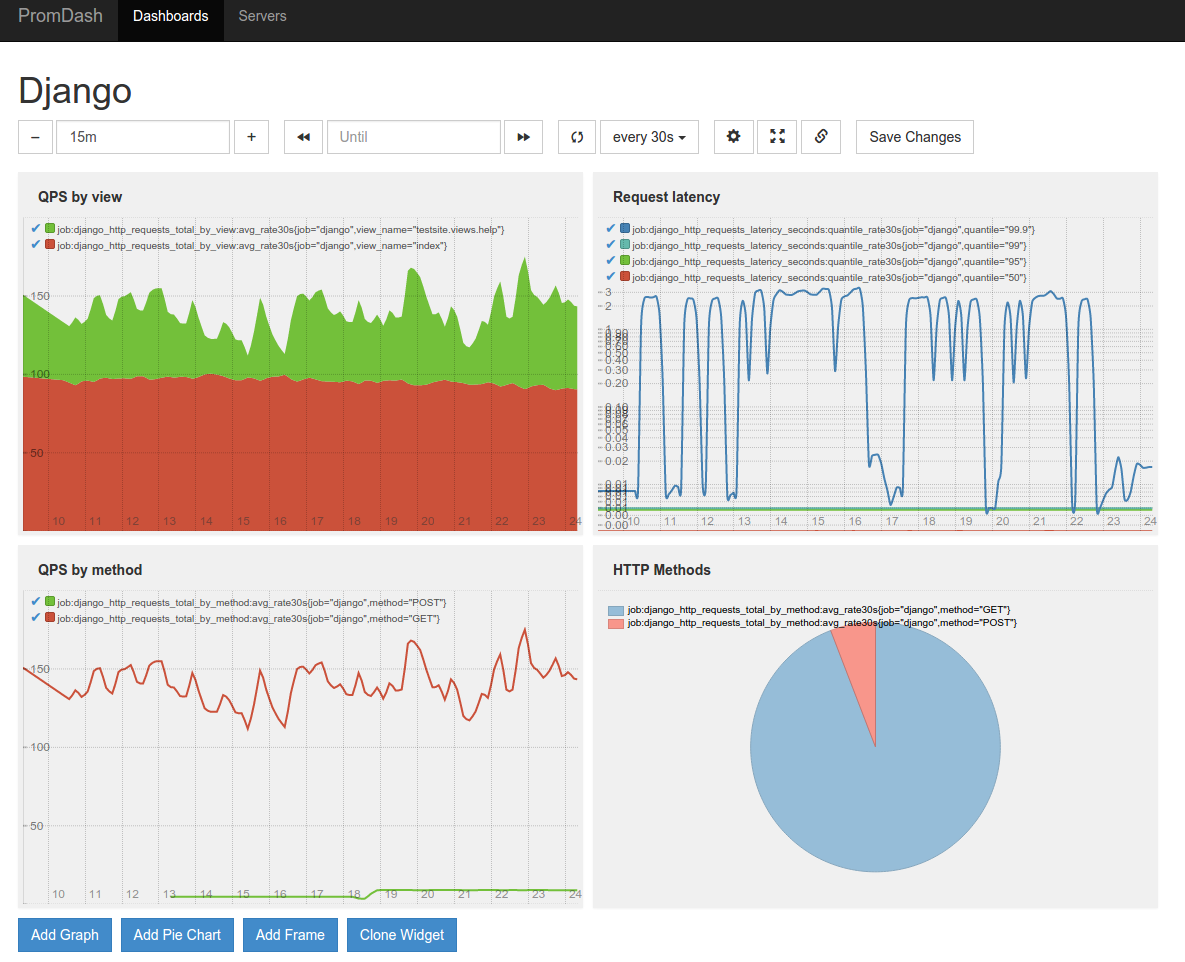
Here's an example of a PromDash displaying some of the metrics collected by django-prometheus:
Adding your own metrics
You can add application-level metrics in your code by using prometheus_client directly. The exporter is global and will pick up your metrics.
To add metrics to the Django internals, the easiest way is to extend django-prometheus' classes. Please consider contributing your metrics, pull requests are welcome. Make sure to read the Prometheus best practices on instrumentation and naming.
Importing Django Prometheus using only local settings
If you wish to use Django Prometheus but are not able to change the code base, it's possible to have all the default metrics by modifying only the settings.
First step is to inject prometheus' middlewares and to add django_prometheus in INSTALLED_APPS
MIDDLEWARE = \
    ['django_prometheus.middleware.PrometheusBeforeMiddleware'] + \
    MIDDLEWARE + \
    ['django_prometheus.middleware.PrometheusAfterMiddleware']

INSTALLED_APPS += ['django_prometheus']
Second step is to create the /metrics end point, for that we need another file (called urls_prometheus_wrapper.py in this example) that will wraps the apps URLs and add one on top:
from django.urls import include, path


urlpatterns = []

urlpatterns.append(path('prometheus/', include('django_prometheus.urls')))
urlpatterns.append(path('', include('myapp.urls')))
This file will add a "/prometheus/metrics" end point to the URLs of django that will export the metrics (replace myapp by your project name).
Then we inject the wrapper in settings:
ROOT_URLCONF = "graphite.urls_prometheus_wrapper"
Adding custom labels to middleware (request/response) metrics
You can add application specific labels to metrics reported by the django-prometheus middleware. This involves extending the classes defined in middleware.py.
- Extend the Metrics class and override the
register_metricmethod to add the application specific labels. - Extend middleware classes, set the metrics_cls class attribute to the the extended metric class and override the label_metric method to attach custom metrics.
See implementation example in the test app
1 maintainer

Download files
Download the file for your platform. If you're not sure which to choose, learn more about installing packages.
Source Distribution
Built Distribution
Filter files by name, interpreter, ABI, and platform.
If you're not sure about the file name format, learn more about wheel file names.
Copy a direct link to the current filters
File details
Details for the file django_prometheus-2.6.0.dev3.tar.gz.
File metadata
- Download URL: django_prometheus-2.6.0.dev3.tar.gz
- Upload date:
- Size: 26.6 kB
- Tags: Source
- Uploaded using Trusted Publishing? Yes
- Uploaded via:
twine/6.1.0 CPython/3.13.7
File hashes
| Algorithm | Hash digest | |
|---|---|---|
| SHA256 |
c4496e249e90134a08df78287958058866de05d3ace3f96fe7aad4b5185bf7ee
|
|
| MD5 |
8179b7c18695ec5f21b861f79595d851
|
|
| BLAKE2b-256 |
9c91b4b9912fb8670c4979560ec17e33c3d726a3d28e3a44eb4fdb68cd75b78a
|
Provenance
The following attestation bundles were made for django_prometheus-2.6.0.dev3.tar.gz:
Publisher:
pre-release.yml on django-commons/django-prometheus
-
Statement:
-
Statement type:
https://in-toto.io/Statement/v1 -
Predicate type:
https://docs.pypi.org/attestations/publish/v1 -
Subject name:
django_prometheus-2.6.0.dev3.tar.gz -
Subject digest:
c4496e249e90134a08df78287958058866de05d3ace3f96fe7aad4b5185bf7ee - Sigstore transparency entry: 2282188883
- Sigstore integration time:
-
Permalink:
django-commons/django-prometheus@6be69b14f4b62a91dec16af9eed18cc35272ae57 -
Branch / Tag:
refs/heads/master - Owner: https://github.com/django-commons
-
Access:
public
-
Token Issuer:
https://token.actions.githubusercontent.com -
Runner Environment:
github-hosted -
Publication workflow:
pre-release.yml@6be69b14f4b62a91dec16af9eed18cc35272ae57 -
Trigger Event:
push
-
Statement type:
File details
Details for the file django_prometheus-2.6.0.dev3-py2.py3-none-any.whl.
File metadata
- Download URL: django_prometheus-2.6.0.dev3-py2.py3-none-any.whl
- Upload date:
- Size: 31.9 kB
- Tags: Python 2, Python 3
- Uploaded using Trusted Publishing? Yes
- Uploaded via:
twine/6.1.0 CPython/3.13.7
File hashes
| Algorithm | Hash digest | |
|---|---|---|
| SHA256 |
ed846ef46206b0280e9272dab5c1cd9302cbc7fefe38cb8b7c158178ebceb147
|
|
| MD5 |
f70f0112d27dcac088ef315b10dcaf72
|
|
| BLAKE2b-256 |
21705ba683a093ad785e62b7d13d7169311b72ca593c706283dc4c0c77683ca2
|
Provenance
The following attestation bundles were made for django_prometheus-2.6.0.dev3-py2.py3-none-any.whl:
Publisher:
pre-release.yml on django-commons/django-prometheus
-
Statement:
-
Statement type:
https://in-toto.io/Statement/v1 -
Predicate type:
https://docs.pypi.org/attestations/publish/v1 -
Subject name:
django_prometheus-2.6.0.dev3-py2.py3-none-any.whl -
Subject digest:
ed846ef46206b0280e9272dab5c1cd9302cbc7fefe38cb8b7c158178ebceb147 - Sigstore transparency entry: 2282189127
- Sigstore integration time:
-
Permalink:
django-commons/django-prometheus@6be69b14f4b62a91dec16af9eed18cc35272ae57 -
Branch / Tag:
refs/heads/master - Owner: https://github.com/django-commons
-
Access:
public
-
Token Issuer:
https://token.actions.githubusercontent.com -
Runner Environment:
github-hosted -
Publication workflow:
pre-release.yml@6be69b14f4b62a91dec16af9eed18cc35272ae57 -
Trigger Event:
push
-
Statement type:














