
Django Slick Reporting
The one-stop reporting engine for Django — every report is one small declarative class.






Grouped totals, time series, crosstabs and charts — declared once, generated for you. Change one line of the class, get a totally different report.
pip install django-slick-reporting
The shape of a report
A report is a small declarative class: every attribute maps to a visible part of the output.
Watch what happens below as we change one line at a time — same SalesTransaction model throughout.
A group-by report
# views.py
from django.db.models import Sum
from slick_reporting.views import ReportView, Chart
from slick_reporting.fields import ComputationField
from .models import SalesTransaction


class ProductSales(ReportView):
    report_model = SalesTransaction
    date_field = "date"
    group_by = "product"

    columns = [
        "name",
        ComputationField.create(
            Sum, "value",
            name="value__sum",
            verbose_name="Total sold $",
        ),
    ]

    chart_settings = [
        Chart(
            "Total sold $", Chart.BAR,
            data_source=["value__sum"],
            title_source=["name"],
        ),
    ]
# urls.py
path("product-sales/", ProductSales.as_view()),
|
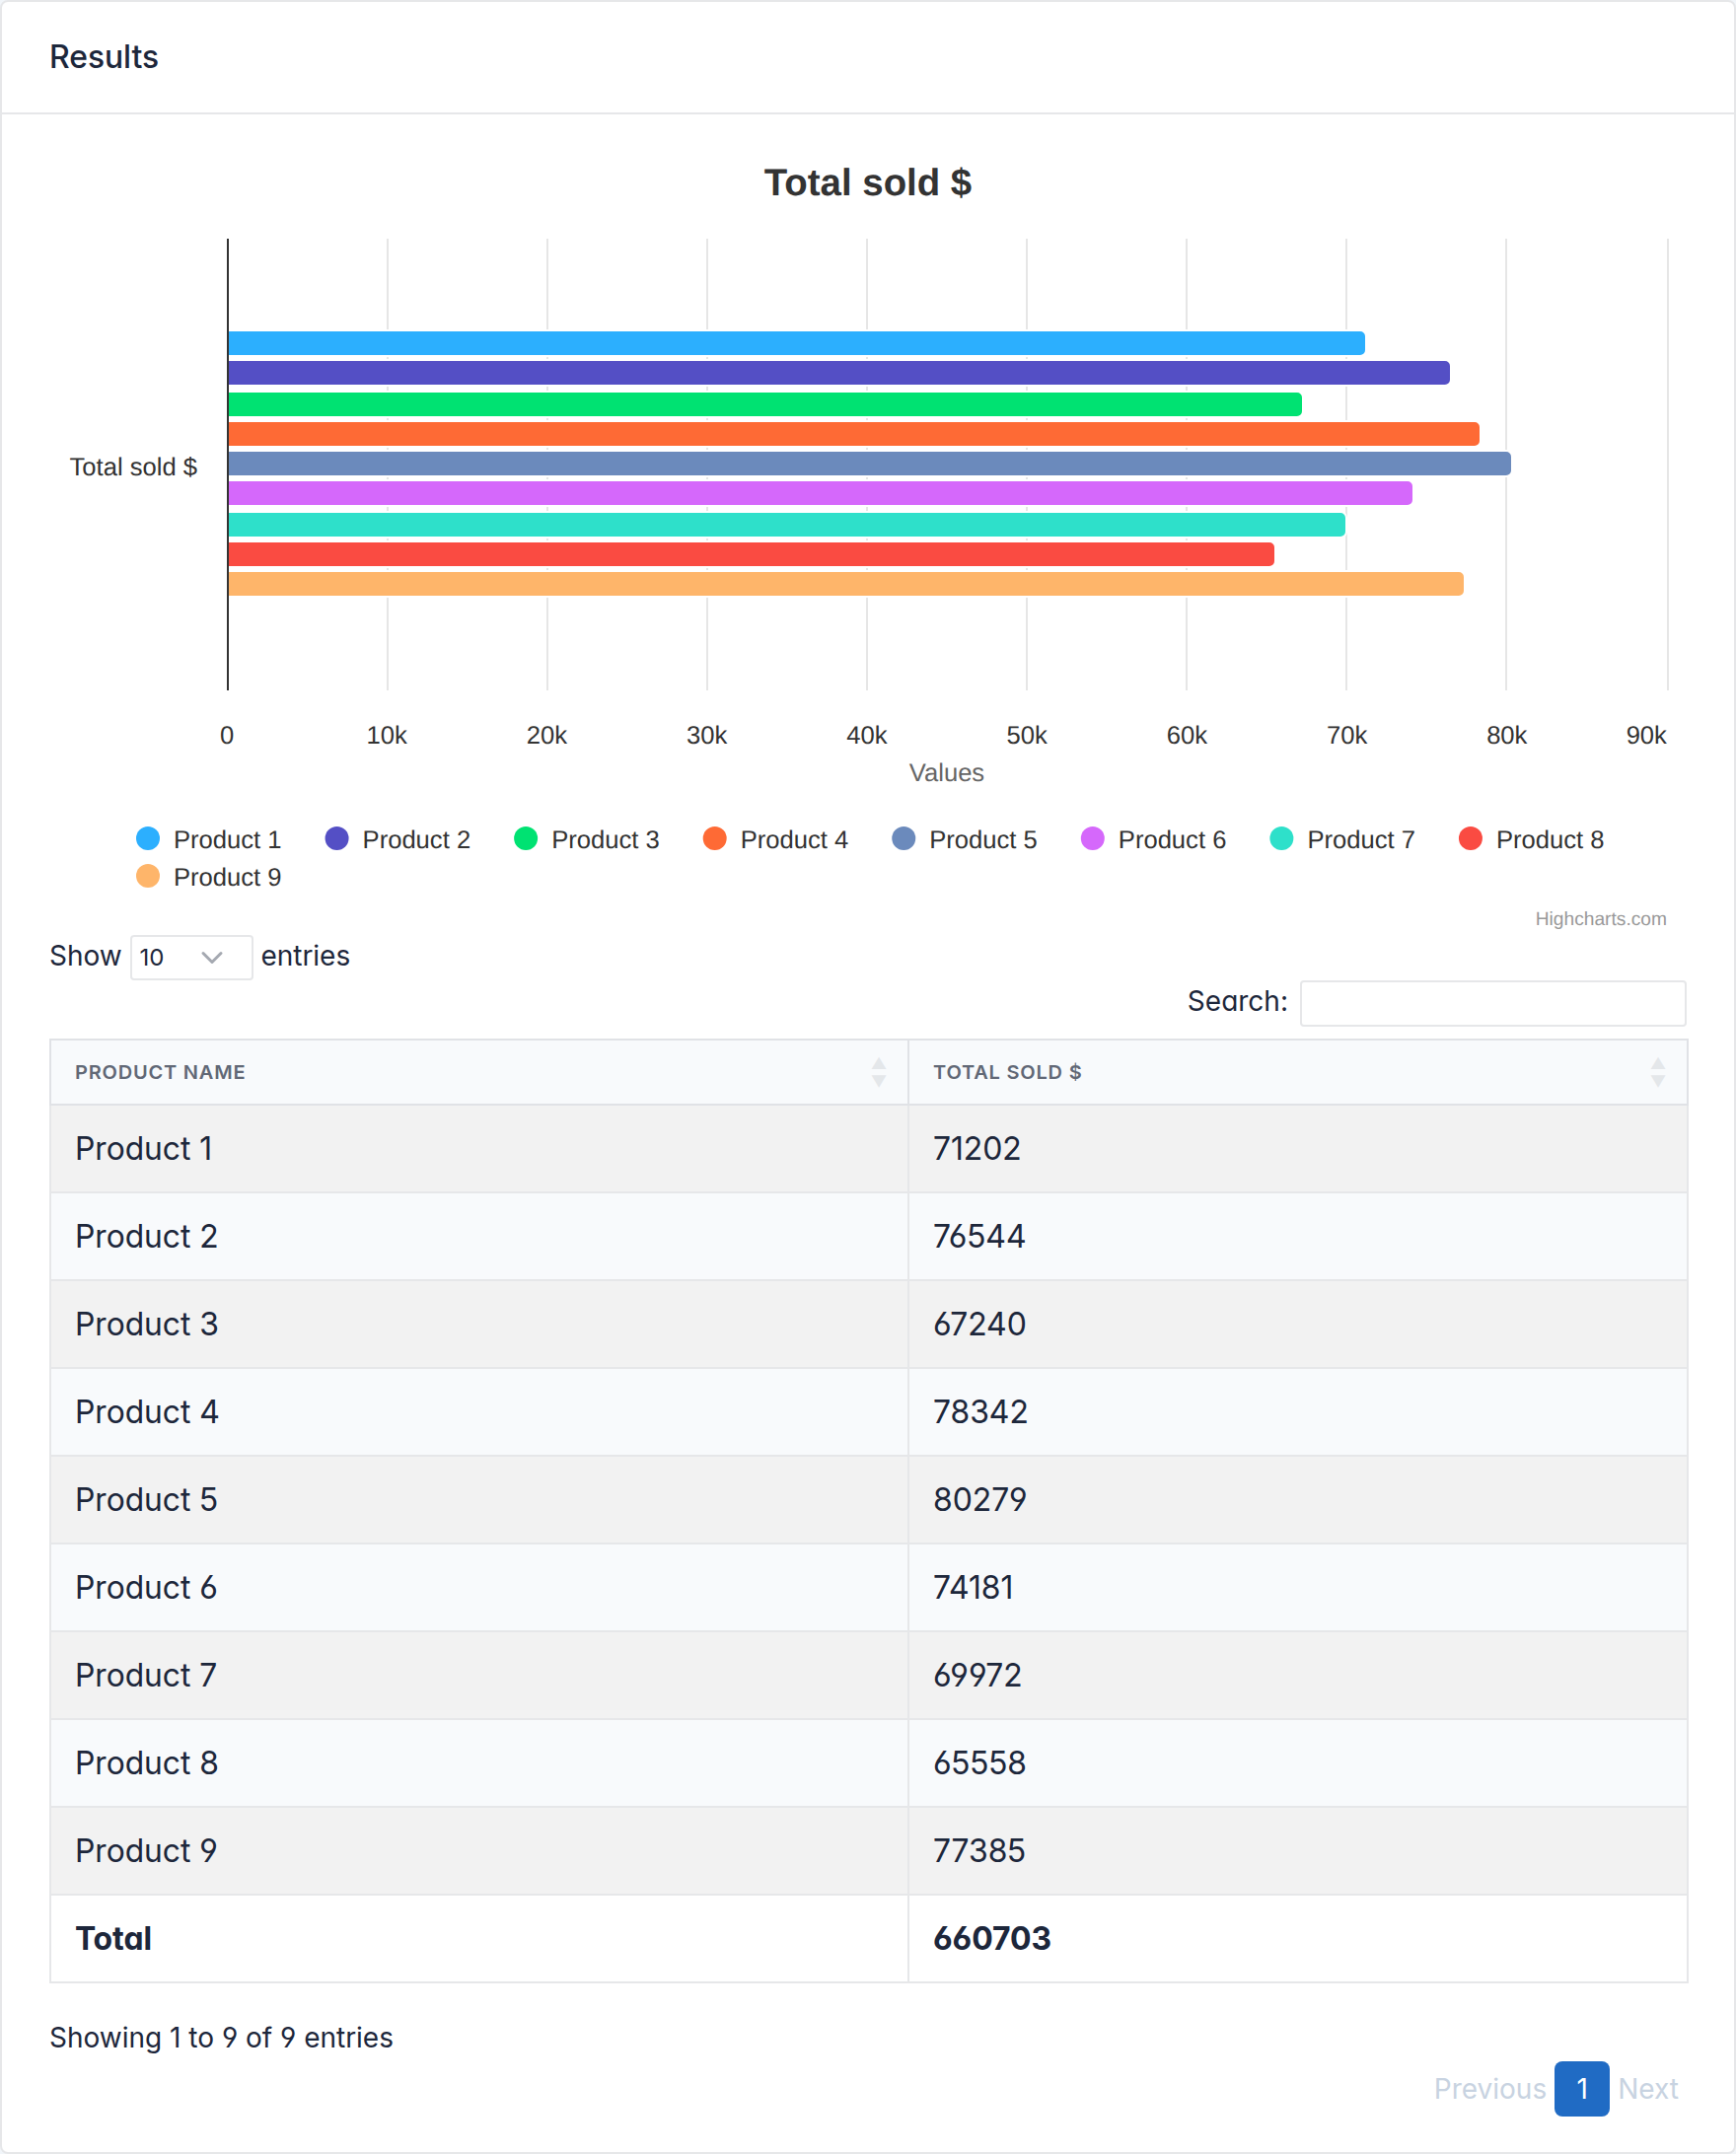
Filter form, chart, sortable table and CSV export — all generated from the class. |
Change one line → a different report
group_by accepts any field or relation path. Swap "product" for "client":
class ClientSales(ReportView):
    report_model = SalesTransaction
    date_field = "date"
    group_by = "client"   # ← the only change

    columns = [
        "name",
        ComputationField.create(
            Sum, "value",
            name="value__sum",
            verbose_name="Total sold $",
        ),
    ]

    chart_settings = [
        Chart(
            "Total sold $", Chart.BAR,
            data_source=["value__sum"],
            title_source=["name"],
        ),
    ]
|
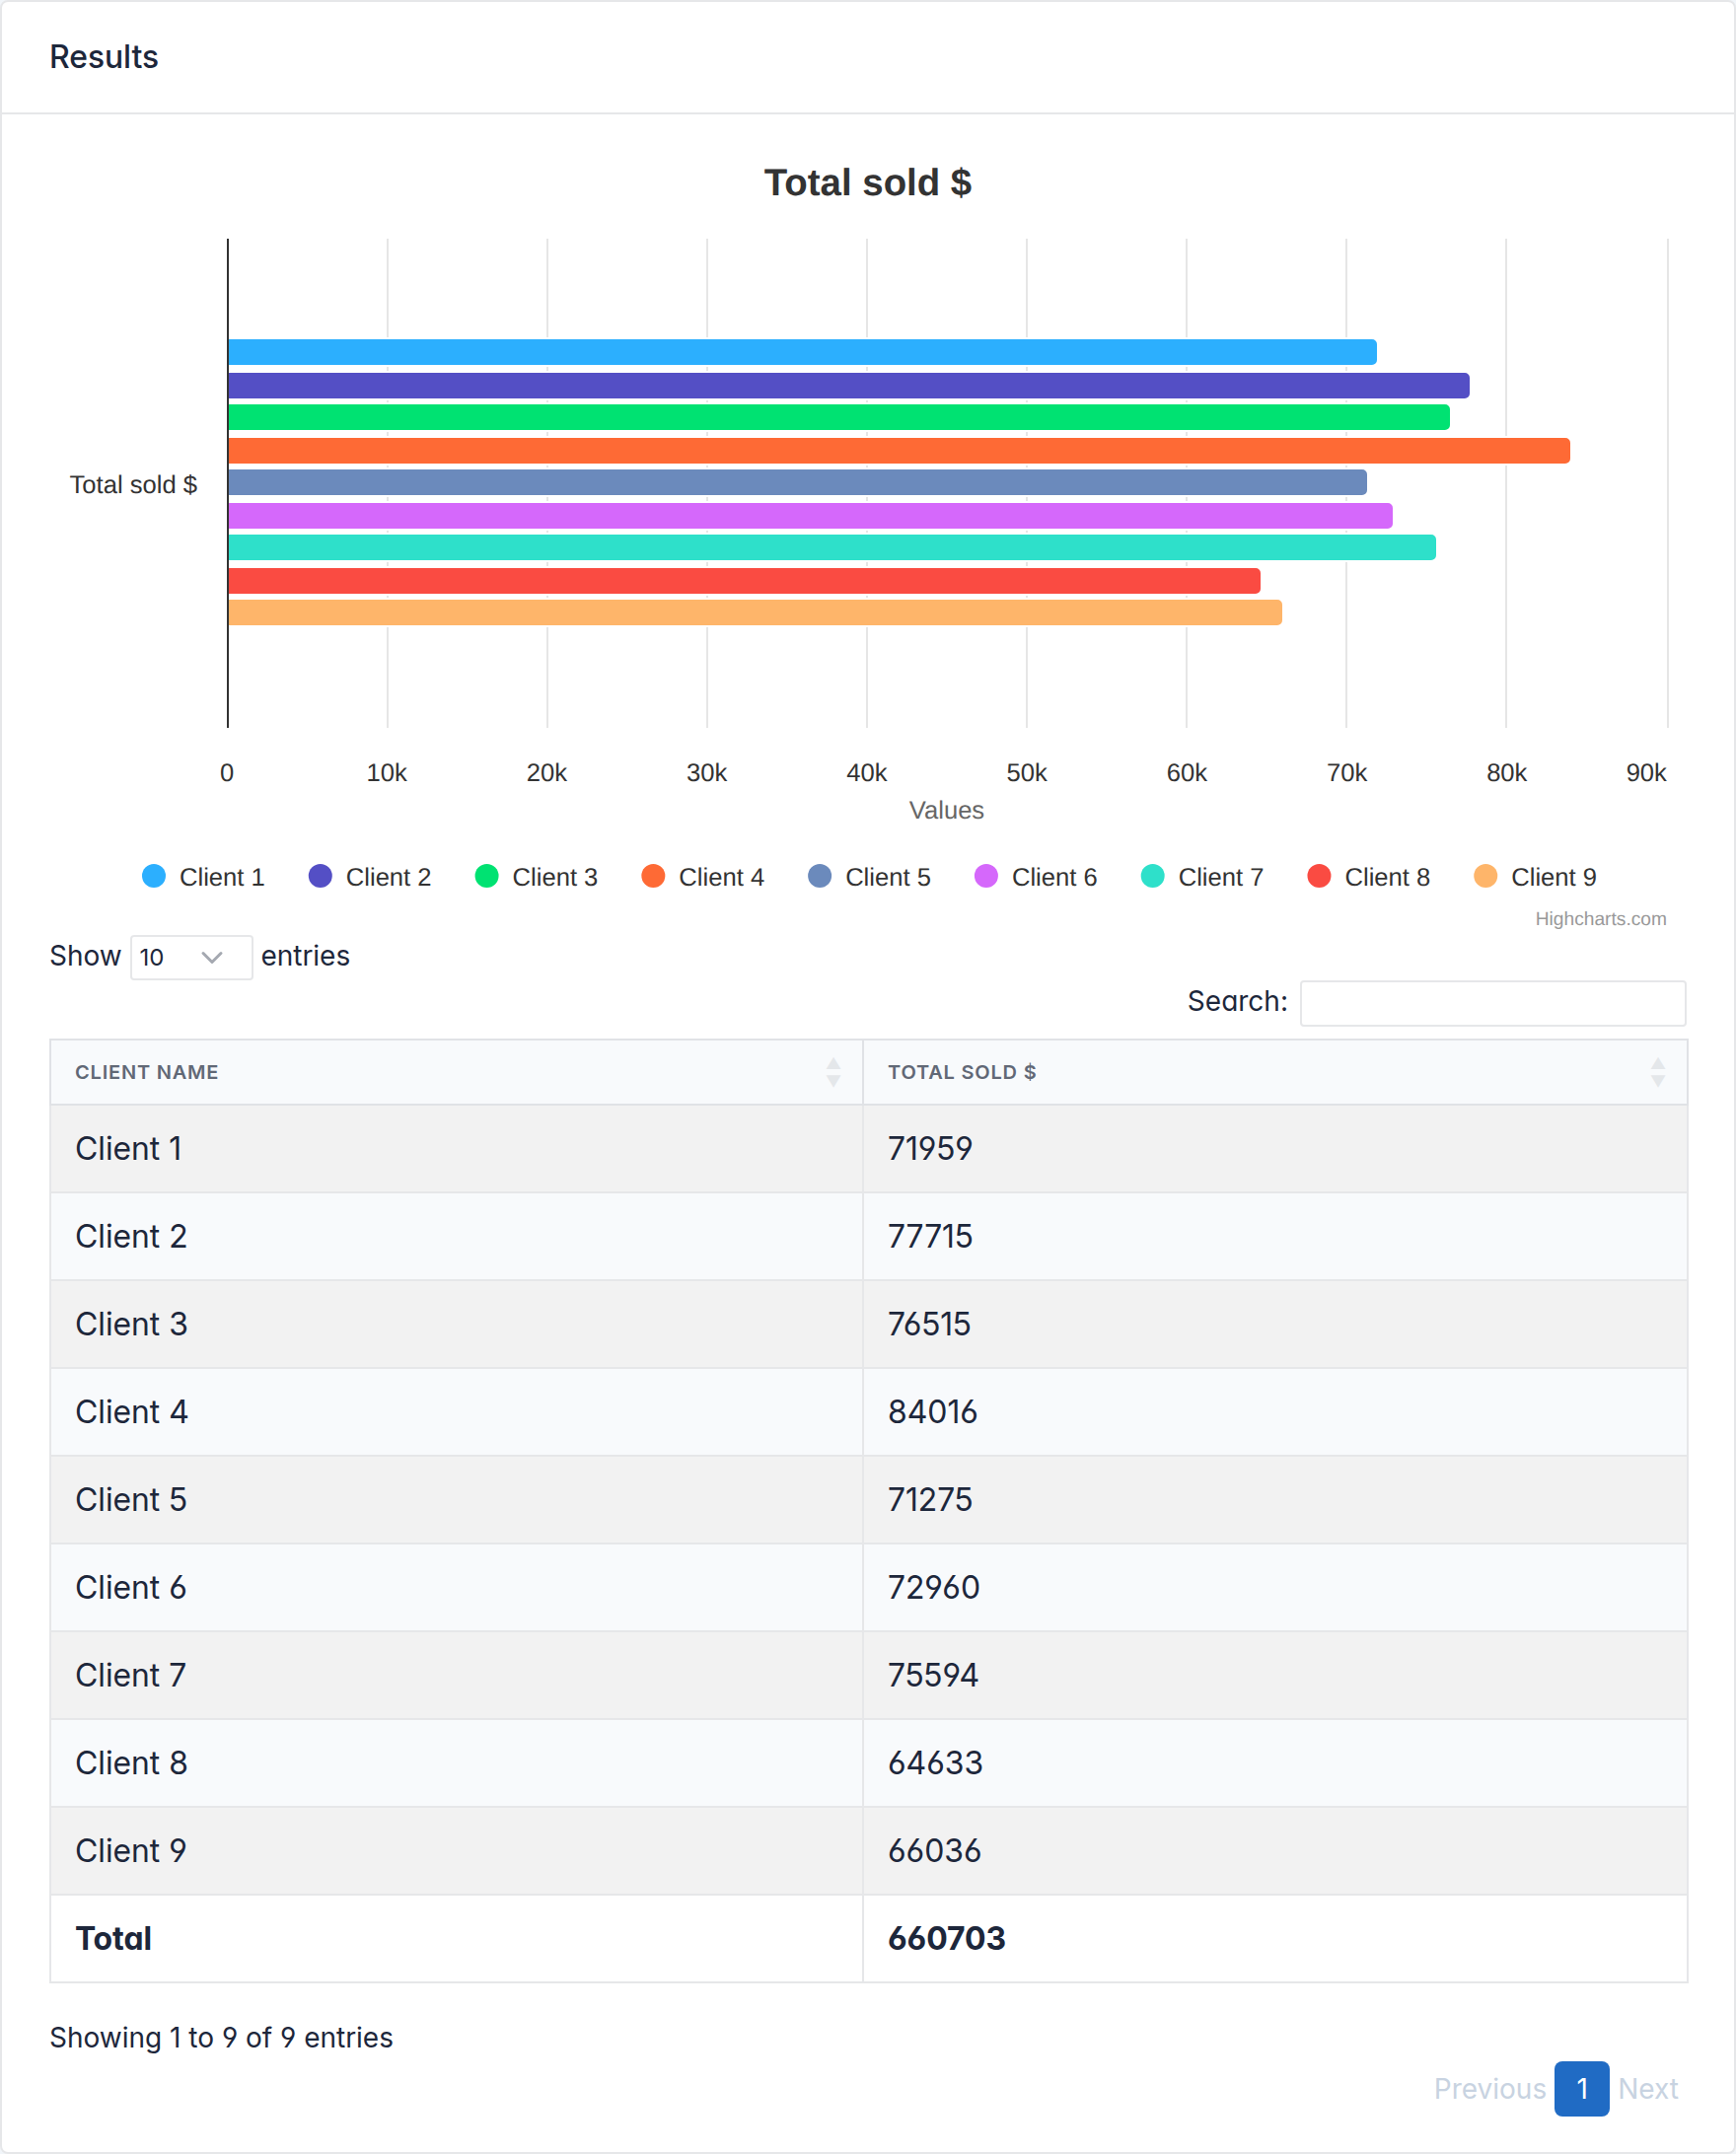
Same class, new grouping — a completely different report. |
Add two lines → a monthly time series
class MonthlyProductSales(ReportView):
    report_model = SalesTransaction
    date_field = "date"
    group_by = "product"
    columns = ["name"]

    time_series_pattern = "monthly"  # ← new
    time_series_columns = [          # ← new
        ComputationField.create(
            Sum, "value",
            name="value__sum",
            verbose_name="Total sold $",
        ),
    ]

    chart_settings = [
        Chart(
            "Total sold $", Chart.LINE,
            data_source=["value__sum"],
            title_source=["name"],
        ),
    ]
|
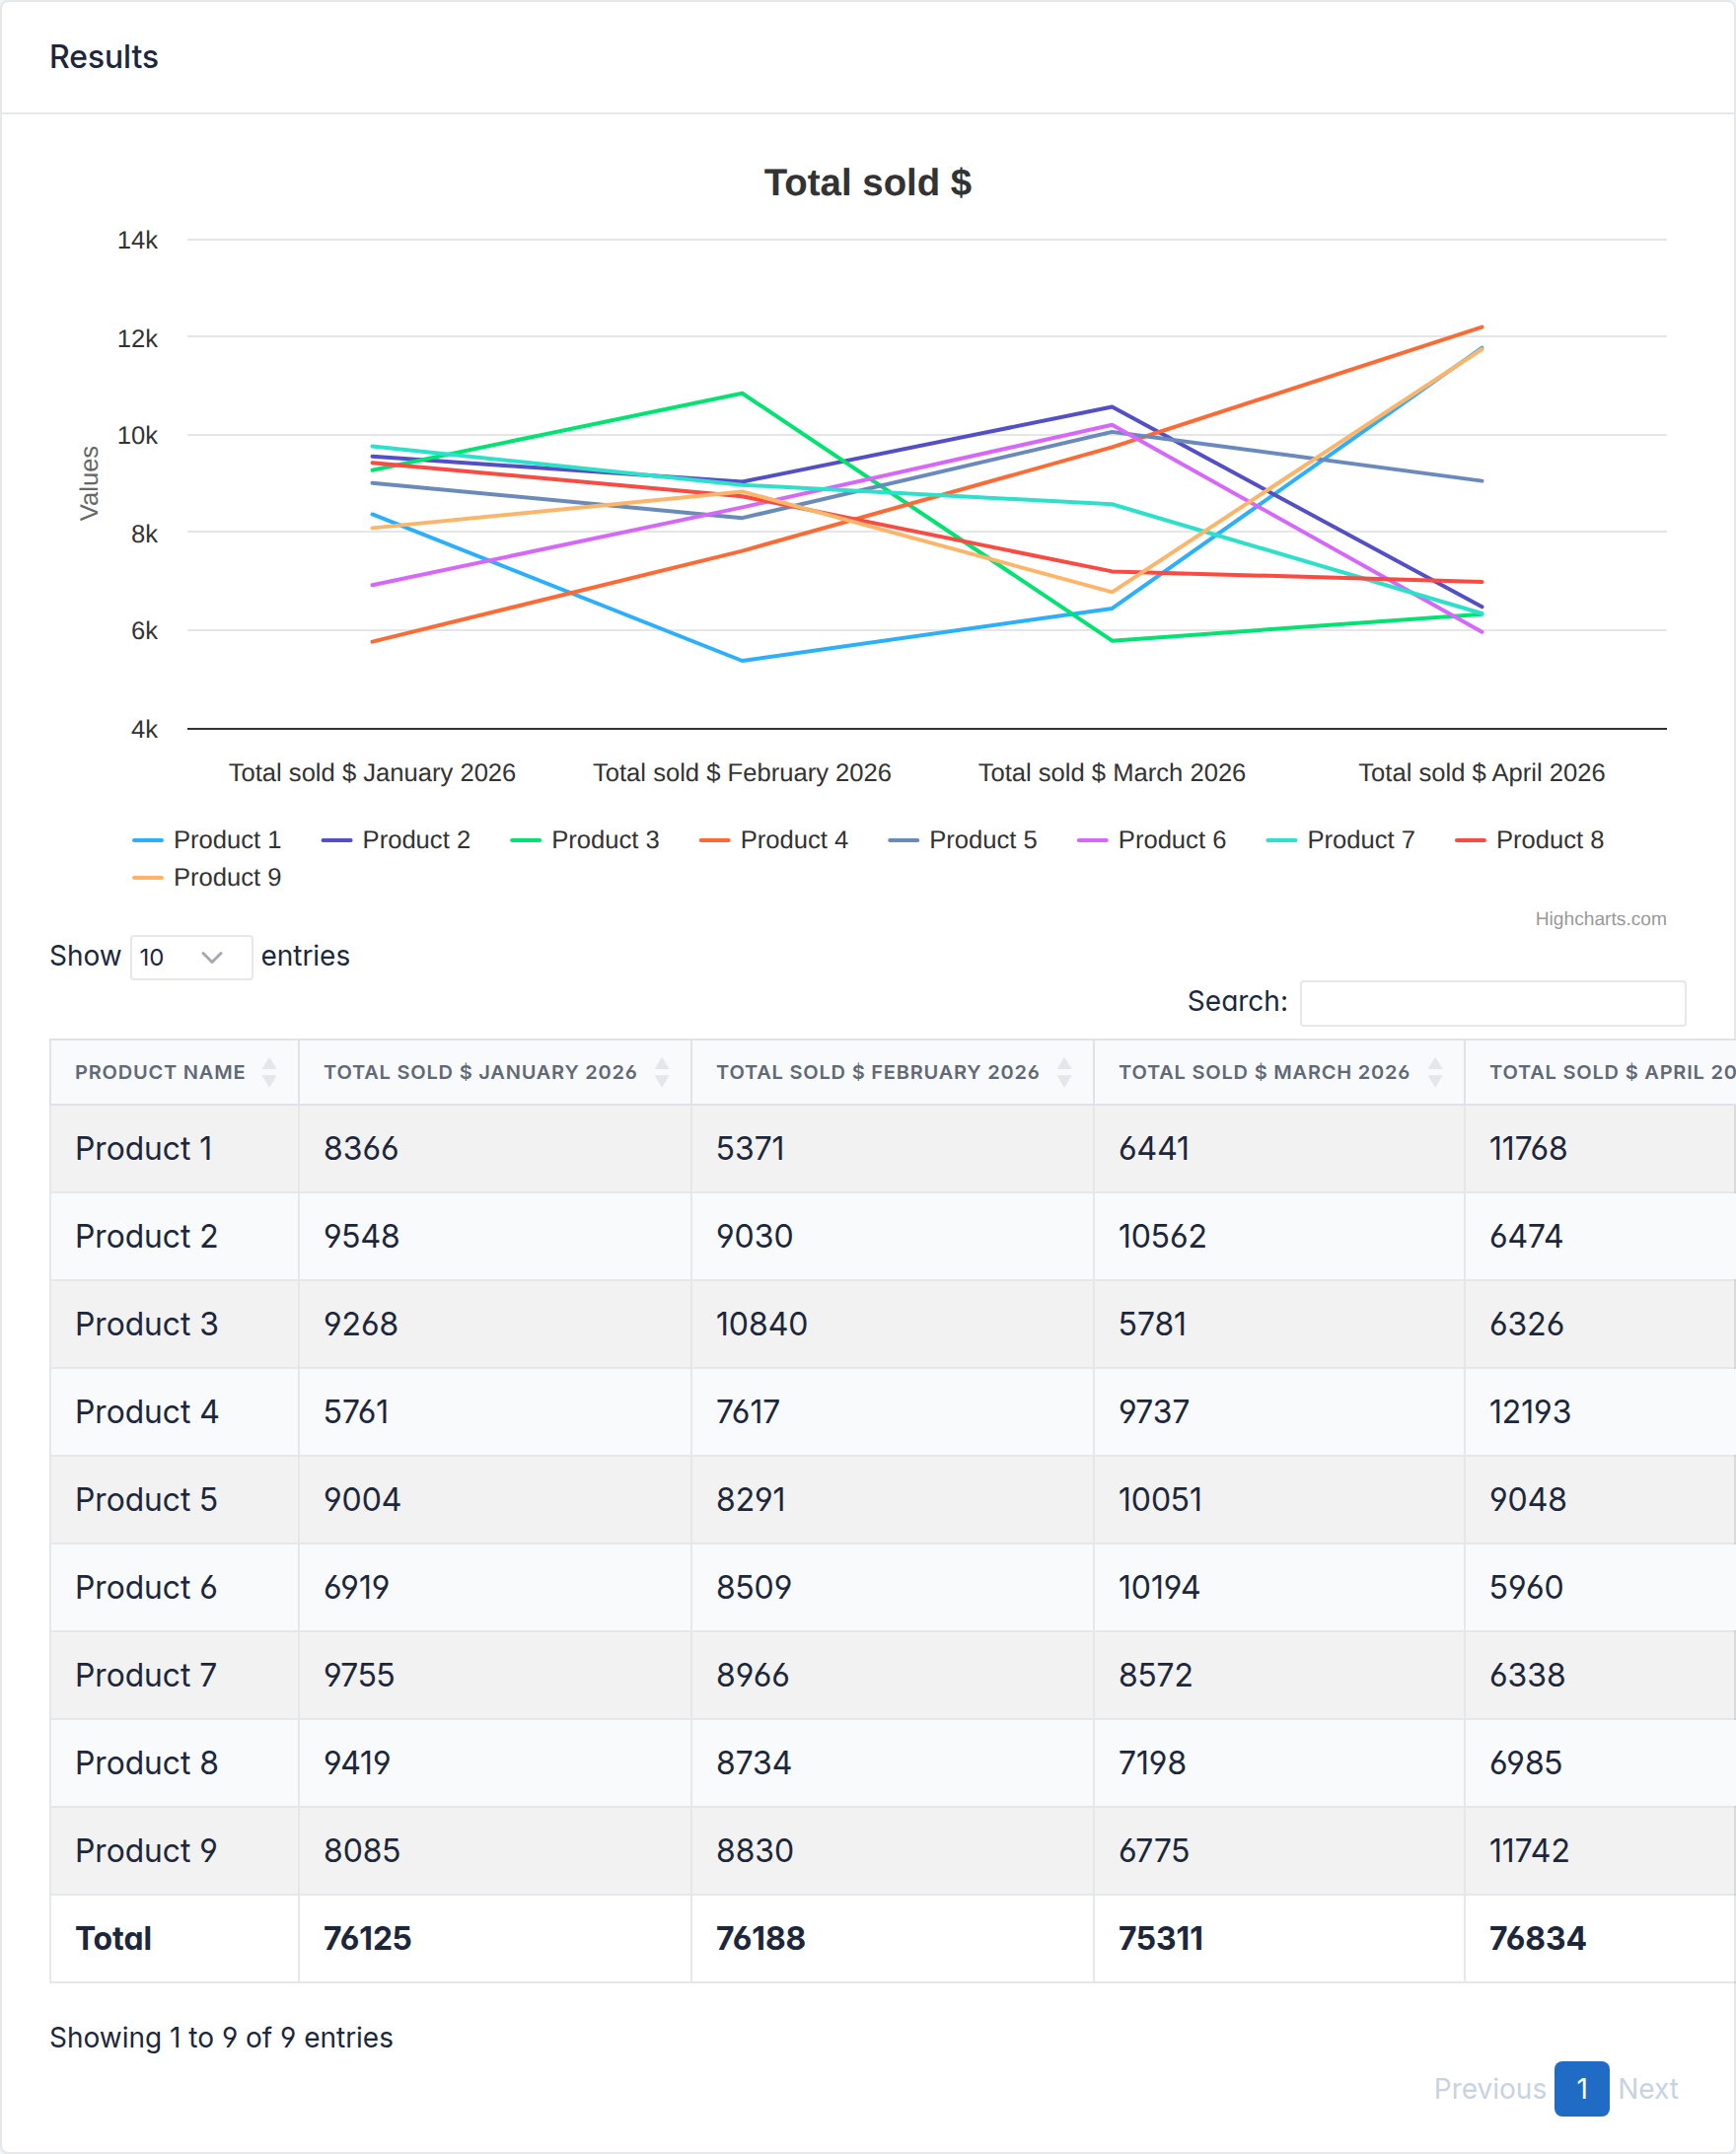
One column per month, computed per period. |
Or pivot it → a crosstab matrix
class ProductSalesCrosstab(ReportView):
    report_model = SalesTransaction
    date_field = "date"
    group_by = "product"

    crosstab_field = "client"
    crosstab_columns = [
        ComputationField.create(
            Sum, "value",
            name="value__sum",
            verbose_name="Total sold $",
        ),
    ]

    columns = [
        "name",
        "__crosstab__",
        ComputationField.create(
            Sum, "value",
            name="value__total",
            verbose_name="Total",
        ),
    ]
|
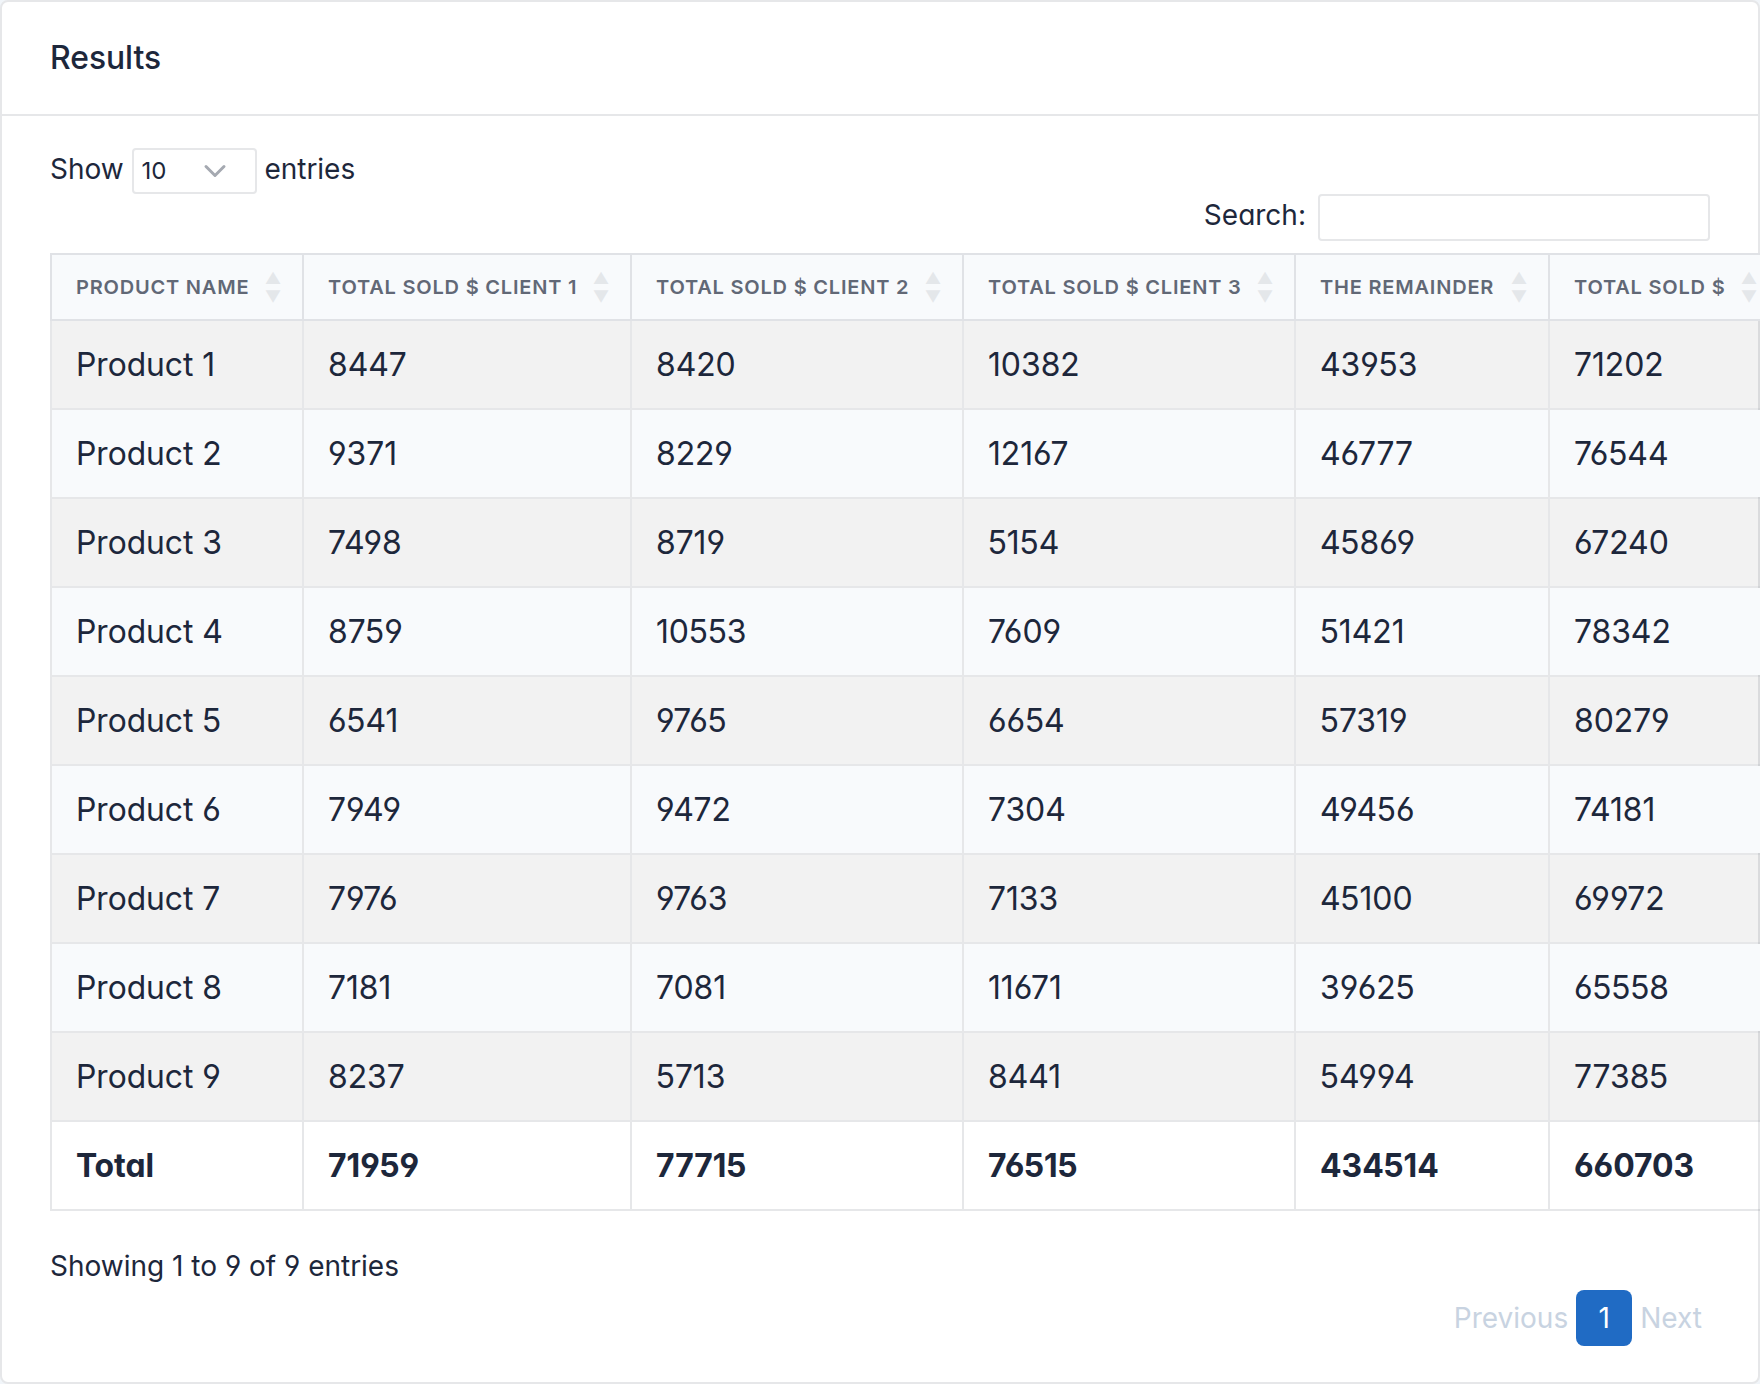
Products as rows, clients as columns, totals at the intersections. |
More shapes — list views, custom querysets, precomputed crosstabs, time-series × crosstab combinations — in the documentation.
Charts, from the same class
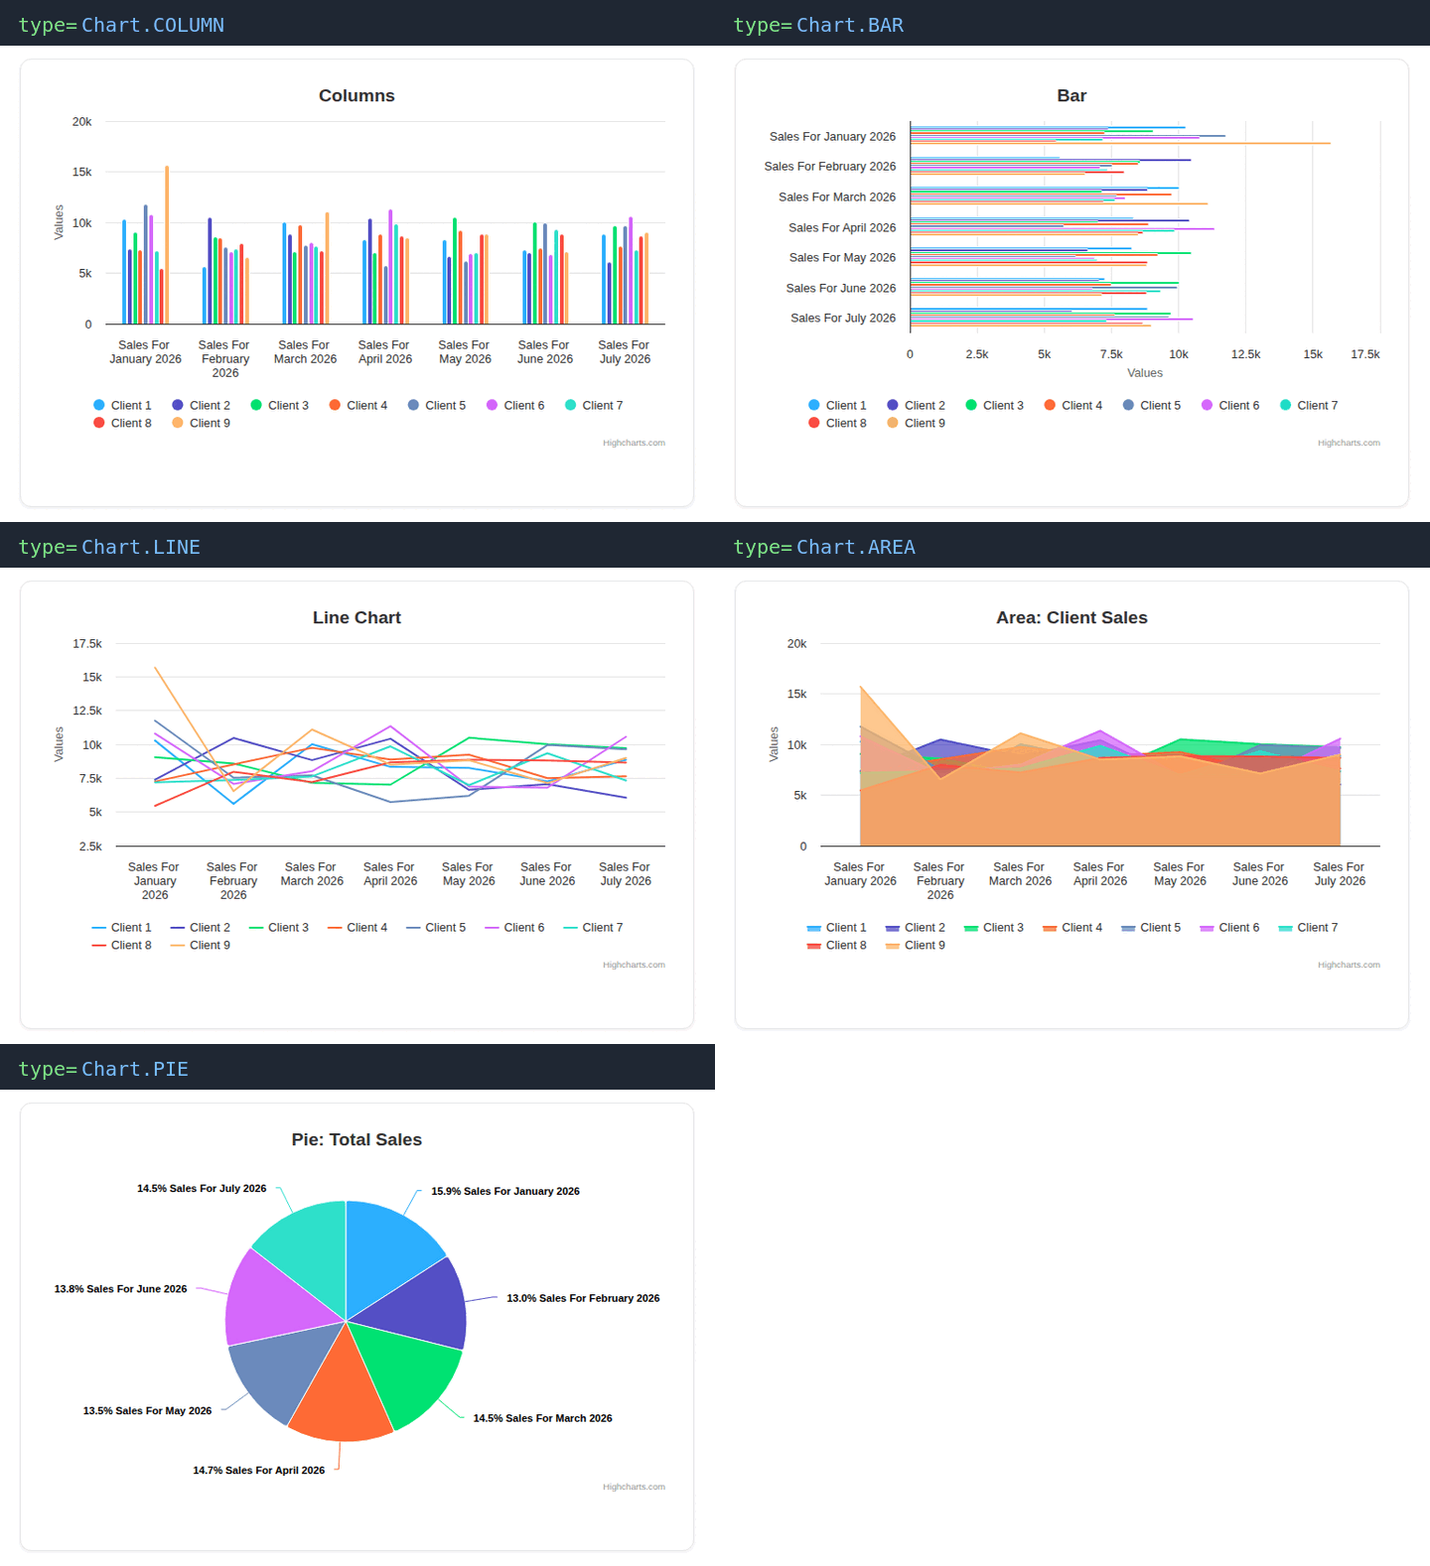
Declare the calculation once; switch the visualization by changing a single argument — no new query, no new template.
Any chart engine
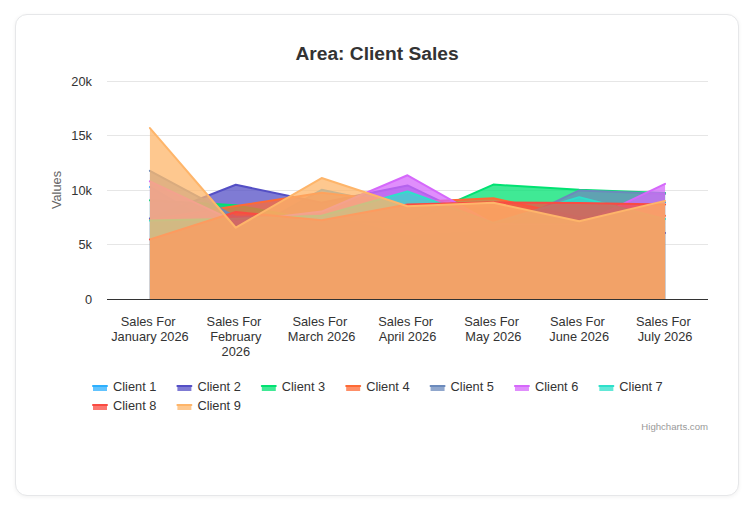
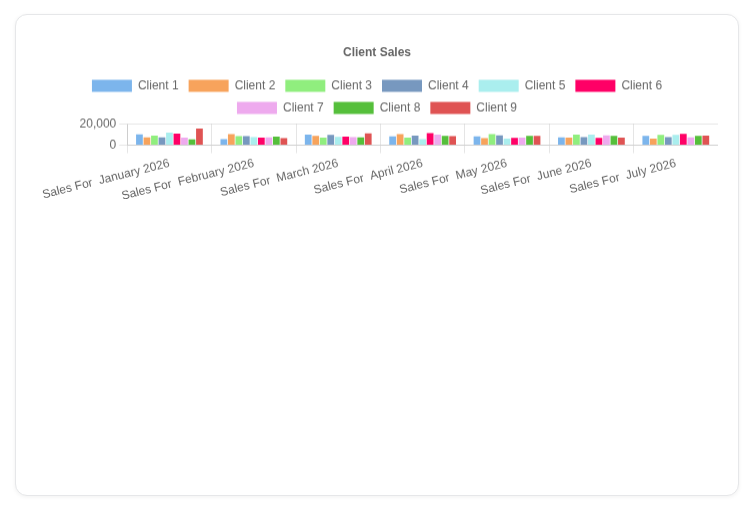
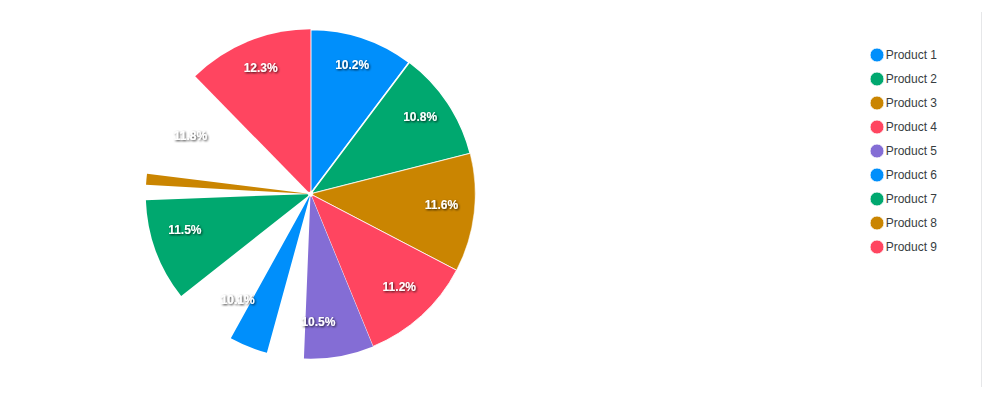
Set chart_engine on the report (or per Chart). The same data renders through your engine of choice:
Highchartschart_engine="highcharts" |
Chart.jschart_engine="chartsjs" |
ApexChartschart_engine="apexcharts" |
 |
 |
 |
Any other JS charting library can be plugged in as a custom engine.
Dashboards
Compose any report into a page as a self-contained widget — chart, table, or both — with one template tag:
{% load slick_reporting_tags %}

{% get_widget_from_url url_name="product-sales" %}
{% get_widget_from_url url_name="monthly-product-sales" chart_id=1 display_table=False title="Chart only" %}
See the live dashboard example.
Ask the data — the LLM assistant
New: let your users ask questions in plain English and get an answer backed by a live report, with proofs. The assistant plans a report configuration, runs it through the same reporting engine, and answers with the numbers — you can inspect the generated report and the raw response right on the dashboard.
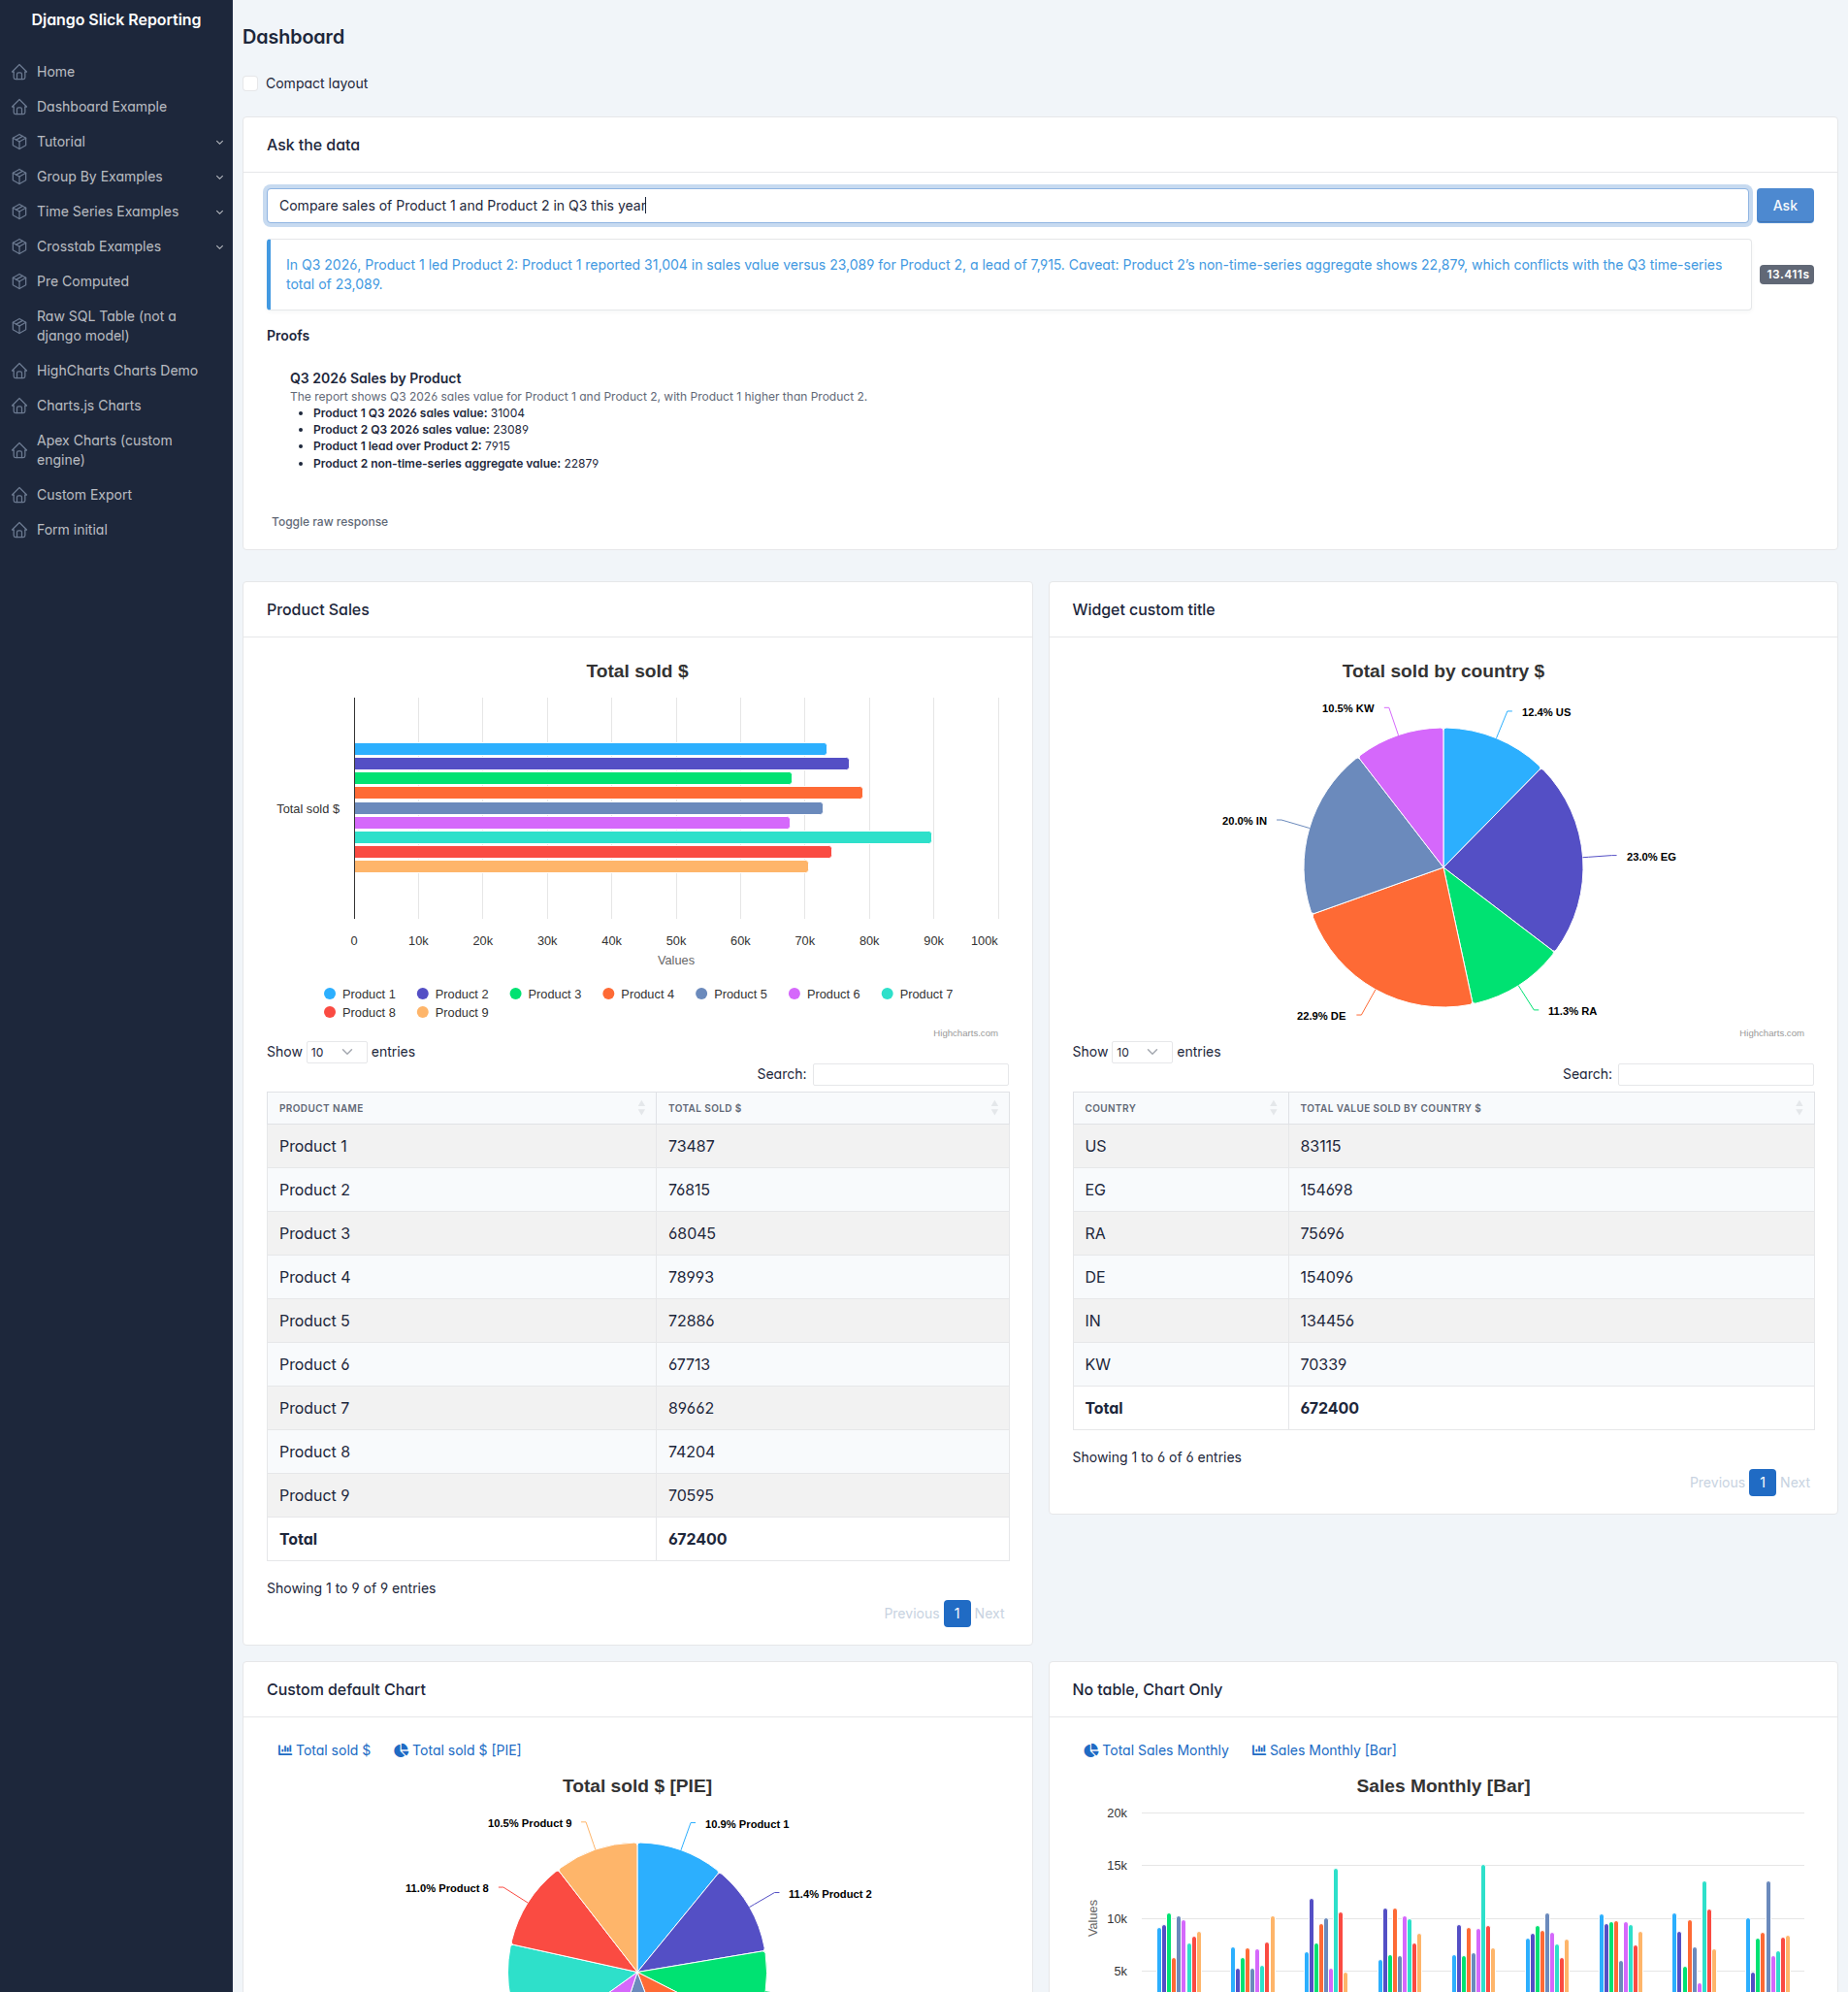
Works with OpenRouter (free models included), any OpenAI-compatible endpoint, or a local llama.cpp server. Docs · Try it live
Features
- Every report shape — simple aggregates, group-by, time-series, crosstab/pivot, and combinations of them.
- Charts included — Highcharts, Chart.js and ApexCharts wrappers, plus pluggable custom engines.
- Custom calculations — build reusable computation fields, chain dependencies, compute percentages and balances.
- Dashboards — drop any report onto a page as a self-contained widget with a template tag.
- Ask-the-data assistant — an optional LLM assistant answers plain-English questions with a generated report (docs).
- Model-optional — report against a Django model, a traversed relation, a raw SQL table, or precomputed/aggregated data.
- Fast & extendable — optimized queries, CSV export out of the box, and hooks for everything.
Installation
pip install django-slick-reporting
Add it to INSTALLED_APPS and you're ready:
INSTALLED_APPS = [
    ...,
    "crispy_forms",
    "crispy_bootstrap5",
    "slick_reporting",
]
Quickstart
The group-by report above is a complete working example — declare the class, wire one URL, done. Prefer data without a view? The same configuration works on the low-level engine:
from slick_reporting.generator import ReportGenerator

report = ReportGenerator(
    report_model=SalesTransaction,
    group_by="product",
    columns=["name", "__total__"],
)
report.get_report_data()
# -> [{'name': 'Product 1', '__total__': 56}, {'name': 'Product 2', '__total__': 43}, ...]
Demo site
Live at django-slick-reporting.com, or run it locally:
git clone https://github.com/ra-systems/django-slick-reporting.git
python -m venv .venv && source .venv/bin/activate

cd django-slick-reporting/demo_proj
pip install -r requirements.txt
python manage.py migrate
python manage.py create_entries   # generates demo data
python manage.py runserver
To try the Ask the data assistant, put an OpenRouter key in the
OPENROUTER_API_KEY environment variable (a demo_proj/.env file works too). The demo defaults to the
free-tier model nex-agi/nex-n2.5-mini:free; switch models with the SLICK_REPORTING_LLM_MODEL
environment variable — e.g. SLICK_REPORTING_LLM_MODEL=google/gemma-4-31b-it:free python manage.py runserver.
Browse free models at openrouter.ai/models.
Documentation
Full documentation lives on Read the Docs. Build it locally with:
cd docs
pip install -r requirements.txt
sphinx-build -b html source build
Running the tests
git clone git@github.com:ra-systems/django-slick-reporting.git
cd django-slick-reporting/tests
python -m pip install -e ..
python runtests.py
# coverage:
coverage run --include=../* runtests.py && coverage html
Contributing
PRs and reviews are most welcome. We follow Django's contributing guidelines. If the project is useful to you, please consider giving it a star — it keeps the project visible and motivated.
Authors
- Ramez Ashraf — Initial work — @RamezIssac
You might also like
- Django ERP Framework — build business solutions with ease.
- Django Tabular Permissions — Django permissions in a translatable, filterable HTML table.
1 maintainer

Metadata
1 maintainer
Release files for django-slick-reporting 1.5.0
For a detailed explanation of source distributions (sdists) and built distributions (wheels), please see the package formats documentation.
Source distribution (sdist)
| File | Size | Uploaded | |
|---|---|---|---|
| django_slick_reporting-1.5.0.tar.gz | 64.3 kB | Details |
Built distribution (wheel)
| File | Interpreter | ABI | Platform | Reset |
|---|---|---|---|---|
| django_slick_reporting-1.5.0-py3-none-any.whl | Python 3 | none | any | Details |
Total release size: 142.4 kB
Release files / django_slick_reporting-1.5.0.tar.gz
| Download URL | django_slick_reporting-1.5.0.tar.gz |
|---|---|
| Size | 64.3 kB |
| Tags | Source |
|
SHA-256 checksum How to use checksums |
0f091439a42ad74a3c23bc277f73a86f17301a27b4d41451a1fae08459dd7181
|
|
BLAKE2b-256 checksum How to use checksums |
c27ab0e32144bde58049bec785fe8c0302cd4b3503886047a7d2448e36a8861c
|
| Upload date | |
|
Uploaded using Trusted Publishing? What is trusted publishing? |
Yes |
| Uploaded via |
twine/7.0.0 CPython/3.13.14
|
Provenance
Provenance describes where a file came from. On PyPI, provenance is shared via attestations, which provide a verifiable record of the build or publishing details. View details, limitations and caveats.


PyPI Publish Attestation
PyPI verified that this artifact, at this checksum, originated from the publisher listed below.
Signed by GitHub Actions, verified by PyPI on Oct 14, 2026.
Transparency logRelease files / django_slick_reporting-1.5.0-py3-none-any.whl
| Download URL | django_slick_reporting-1.5.0-py3-none-any.whl |
|---|---|
| Size | 78.1 kB |
| Tags | Python 3 |
|
SHA-256 checksum How to use checksums |
1fc369f3cf011c0491d90767668640e44be56370d3ecbed864c4f0484a9fe261
|
|
BLAKE2b-256 checksum How to use checksums |
76f0eb022f838c451769b27623889ede872999207f40f4ced4692598fa24750d
|
| Upload date | |
|
Uploaded using Trusted Publishing? What is trusted publishing? |
Yes |
| Uploaded via |
twine/7.0.0 CPython/3.13.14
|
Provenance
Provenance describes where a file came from. On PyPI, provenance is shared via attestations, which provide a verifiable record of the build or publishing details. View details, limitations and caveats.
PyPI Publish Attestation
PyPI verified that this artifact, at this checksum, originated from the publisher listed below.
Signed by GitHub Actions, verified by PyPI on Oct 14, 2026.
Transparency log













