A stats dashboard and session tracker for Django.

Project description
Django Stat Dashboard
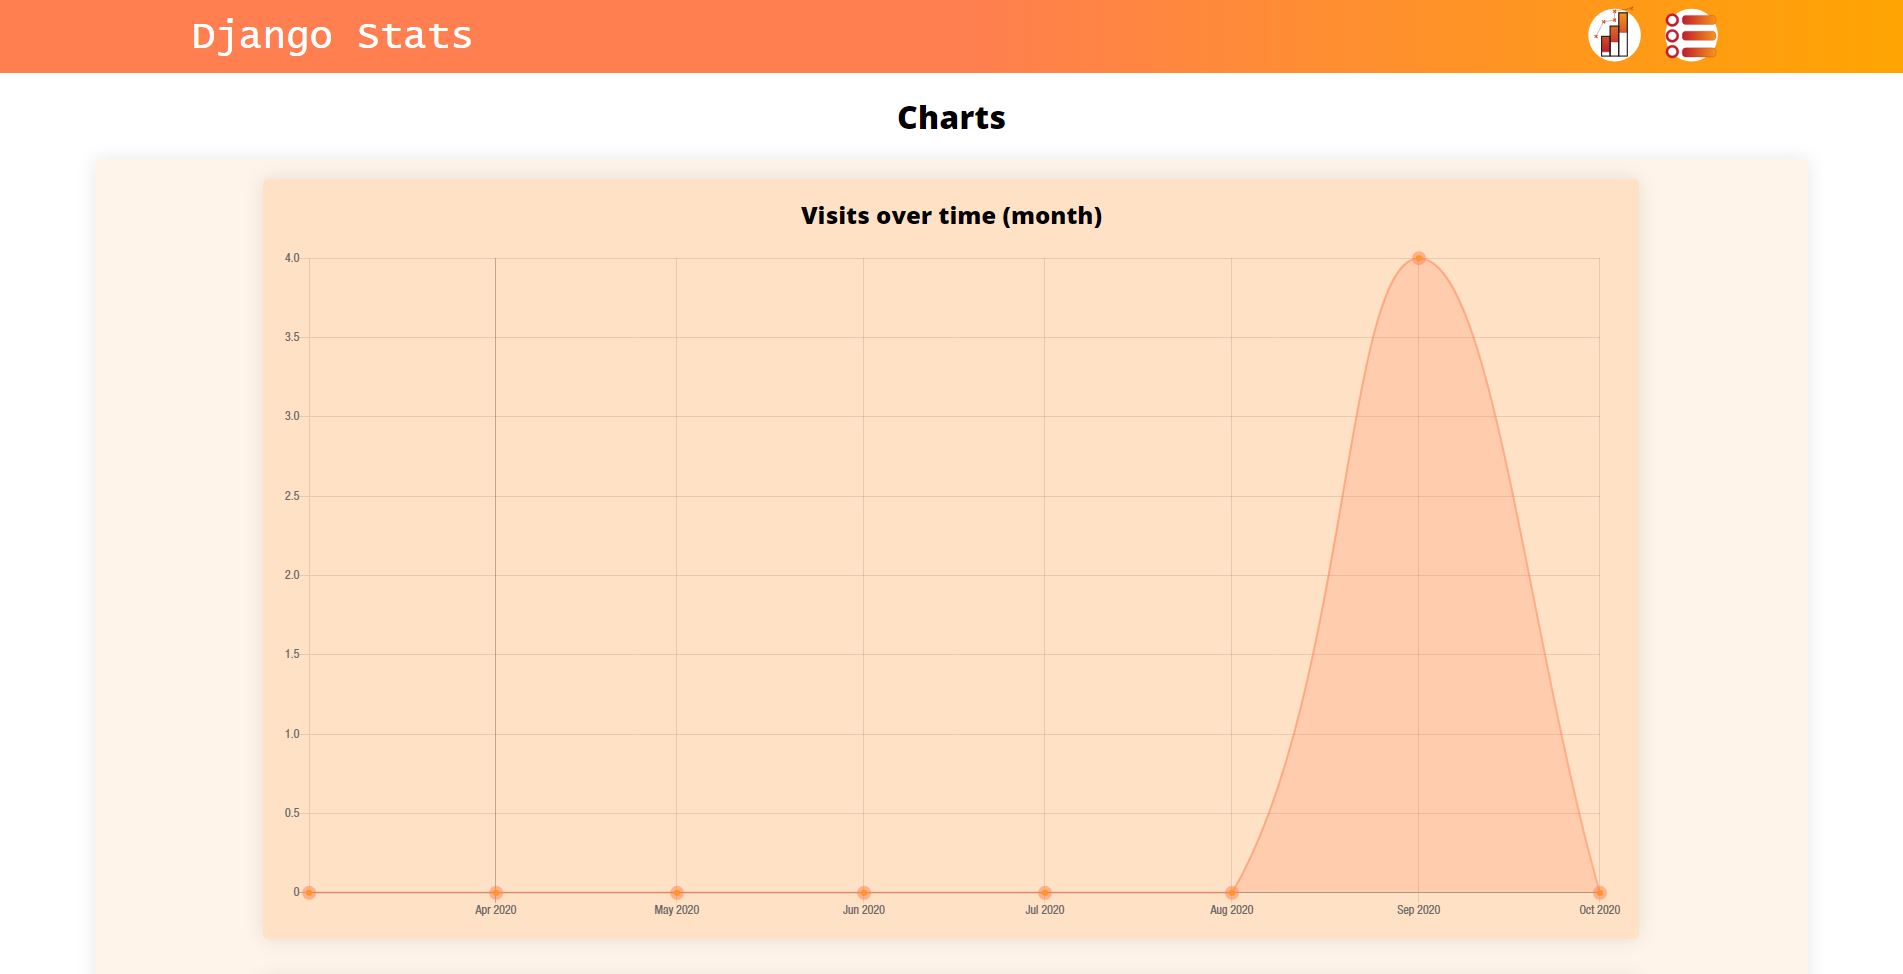
A dashboard to display captured metrics and charts, such as devices, pages visited, and page actions. Staff user is required to get chart data and view dashboard. Dashboard is at /(statsurl), usually /stats.
Setup
-
Add
'stats_dashboard'to INSTALLED_APPS in settings.py.INSTALLED_APPS = [ ..., "stats_dashboard", ]
-
Add
'stats_dashboard.middleware.stat_middleware.StatMiddleware'to MIDDLEWARE in settings.py.MIDDLEWARE = [ ..., "stats_dashboard.middleware.stat_middleware.StatMiddleware" ]
-
Optional: Configurate the elements to listen for clicks in settings.py.
STATS_PAGE_CONFIG = {
    "*": {
        "click": [
            {"selector": "button", "name": "this is name"}
        ],
    }
}
"*" is a regex expression for the page to listen for this click. There can be multiple pages.
"click" specifies the event. Currently only click events are available.
"selector" is the CSS selector for the element to listen to clicks on
"name" is the name that the event is saved as -
Optional: To use custom charts, create a python file, (commonly chart.py) and set it in settings.py.
STATS_CHART_LOCATION = "yourproject.chart"
This file specifies all of the charts to show on the dashboard. More documentation here.
-
On pages that you wish to be tracked, add the JavaScript file. Note that axios, a JS library is loaded to send requests to the server on activity (from this script). You can put this in your base template.
{% load static %} <body> <script src="{% static 'stats/stats.js' %}"></script> </body> -
Add the urls in urls.py
import stats_dashboard.urls
urlpatterns = [
   path("stats/", include(stats_dashboard.urls)),
]
It is recommended to use stats/ as the url as by default, recorded activity is sent here from the JavaScript file. If you wish to use another url, specify the data-root attribute on the script tag e.g.
<script data-root="/otherurl/" src="{% static 'stats/stats.js' %}"></script>
Making Charts
The charts classes and functions are at stats_dashboard.charts.
Go to /yourstaturl/charts/ to get charts data for troubleshooting.
The flow for creating charts is:
-
Import the chart manager, at
from stats_dashboard.charts.manager import statistic_charts -
Import your chart type
from stats_dashboard.charts.types import LineChart, ScatterChart, BarChart, PieChart -
Import the chart dataset class and
from stats_dashboard.charts.dataset import ChartDataset -
Optional: Import dataset style class (to add custom styles on datasets)
from stats_dashboard.charts.dataset_styles import DatasetStyleCreate your dataset styles:
my_blue_style = DatasetStyle(background_color="blue")
Styles are based off of chart.js styles, however JavaScript names are changed to Python names e.g.
backgroundColor -> background_color. Styles are here. Some chart specific styles may be found on the documentation for other charts. -
Create your datasets:
my_dataset = ChartDataset(values=[10, 20, 30], style=my_blue_style)
my_second_dataset = ChartDataset(values=[20, 30, 35])
Default style is used if not otherwise specified. Values should be calculated from your own data. This file is run on each request to the chart dashboard, do that the data can be retrieved from models.
For scatter graphs, data should be set in this format, with ScatterDataset:ScatterDataset(values=[ {"x": 1, "y": 3}, {"x": 2, "y": 4}, {"x": 3, "y": 5} ], style=scatter_style )
-
Create your chart object from the datasets.
my_bar_chart = BarChart(
   name="My Bar Chart",
   labels=["1st Bar", "2nd Bar", "3rd Bar"],
   datasets=[
       my_dataset,
       my_second_dataset
   ]
)
There should be as many labels as values in each dataset.
Labels: X Axis
Dataset Values: Y Axis
(Except in Pie Charts, and Scatter Charts)
In Scatter Charts, the dataset values contain X and Y values, so the labels argument shouldn't be set. -
Add the chart to your dashboard
statistic_charts.add_chart(my_bar_chart)
Preset Charts
There are some pre-made charts at from stats_dashboard.charts.preset import *
They all take an optional style object.
Some examples are visits_time, displaying visitors to the site, over time.
This takes the number of seconds to look back for visitors, and a scale e.g. month.
Another is common_pages, abar chart showing most visited pages.
Use
statistic_charts.add_chart(visits_time(58400, "hour", style=my_style))
statistic_charts.add_chart(browser_share(type="pie"))
Other Info
3 Models, BroswerSession, PageSession and PageEvent is available at stats_dashboard.models. These can be used to retrieve tracked user activity.
STAT_TRACK_IN_DEBUG = False will disable tracking activity with debug on.
Please report any issues!


Download files
Download the file for your platform. If you're not sure which to choose, learn more about installing packages.
Source Distribution
Built Distribution
Filter files by name, interpreter, ABI, and platform.
If you're not sure about the file name format, learn more about wheel file names.
Copy a direct link to the current filters
File details
Details for the file django-statistics-dashboard-1.0.tar.gz.
File metadata
- Download URL: django-statistics-dashboard-1.0.tar.gz
- Upload date:
- Size: 86.6 kB
- Tags: Source
- Uploaded using Trusted Publishing? No
- Uploaded via: twine/4.0.2 CPython/3.8.3
File hashes
| Algorithm | Hash digest | |
|---|---|---|
| SHA256 |
950e399e5097b7f8b76012a5d3286c381ed63b44b82dc82368979524532d590d
|
|
| MD5 |
347d5ead99f8b85efc92db65b34bda4e
|
|
| BLAKE2b-256 |
e7935ac9ecbf3b6cd143fdb267cdc0d0fcb507f701eb76df447ef1b52799ef23
|
File details
Details for the file django_statistics_dashboard-1.0-py3-none-any.whl.
File metadata
- Download URL: django_statistics_dashboard-1.0-py3-none-any.whl
- Upload date:
- Size: 91.4 kB
- Tags: Python 3
- Uploaded using Trusted Publishing? No
- Uploaded via: twine/4.0.2 CPython/3.8.3
File hashes
| Algorithm | Hash digest | |
|---|---|---|
| SHA256 |
fb9f5303eb97a8ea034f588cb147ad939a57eb79d88c3b563fef9bc446e1d10c
|
|
| MD5 |
c377cbba5bd7cb769a41124e01a8c0a5
|
|
| BLAKE2b-256 |
c5f976b375a2632340242132bf34ea75e45cf87d7ff6fbe0dbfe396e94fdf0b3
|


