DNAsight

Project description
DNAsight
DNAsight is a modular framework for automated segmentation and quantitative analysis of AFM images of DNA–protein complexes. See associated publication / for citation: https://doi.org/10.64898/2026.03.06.708946
It provides both:
- DNAsight GUI for interactive, point-and-click analysis
- DNAsight CLI for batch processing and reproducible pipelines
Contents
- Installation
- Quick start
- Using the GUI
- Using the CLI
- Configuration
- Example data
- Outputs
- Troubleshooting
- Development
- Citation
- License
- Contact
Installation
DNAsight can be installed in two ways:
- Python (pip) installation (recommended for macOS users who already have Python)
- Standalone app download (recommended if you don’t want to install Python)
Option 1 — Install with pip (recommended if you have Python)
This option installs DNAsight as a Python package and is the easiest way to stay up to date. It also avoids macOS “unblock” steps that can occur when running downloaded applications.
Prerequisites
- Python (recommended: Python 3.10+)
- A clean virtual environment (strongly recommended)
1) Create and activate a clean virtual environment
macOS / Linux
python3 -m venv dnasight-env
source dnasight-env/bin/activate
Windows (PowerShell)
python -m venv dnasight-env
.\dnasight-env\Scripts\Activate.ps1
2) Install DNAsight
pip install dnasight
3) Launch DNAsight
GUI:
dnasight-gui
CLI:
dnasight-cmd --help
If the commands aren’t found, make sure your environment is activated.
Option 2 — Download the standalone app (no Python required)
This option is best if you don’t want to install Python. Download the correct release for your operating system, unzip it, then run the GUI or CLI.
1) Download the release
- Go to the GitHub Releases page
- Download the macOS or Windows zip (choose the one that matches your system)
2) Unzip
Unzip the downloaded file. You should see a folder containing something like:
dnasight-gui(GUI application)dnasight-cmd(command-line executable)data/(example datasets to test the workflow)config.yaml(configuration template)
3) Run DNAsight
GUI
- Double click
dnasight-guito open DNAsight.
CLI
Open a terminal in that folder and run the command-line executable.
macOS (example):
./dnasight-cmd --help
Windows (example, PowerShell):
.\dnasight-cmd.exe --help
Replace the commands above with the exact executable name on each platform if it differs.
macOS note: “Unblock” on first run
If macOS blocks the app the first time you try to open it:
- Go to System Settings → Privacy & Security
- Find the DNAsight warning
- Click Open Anyway
Quick start
This works for both installation methods.
- Launch the GUI (
dnasight-gui) - Load an image or folder (or use the example files in
data/) - Run segmentation and analysis
- Export results (CSV + overlays)
Using the GUI
Typical workflow:
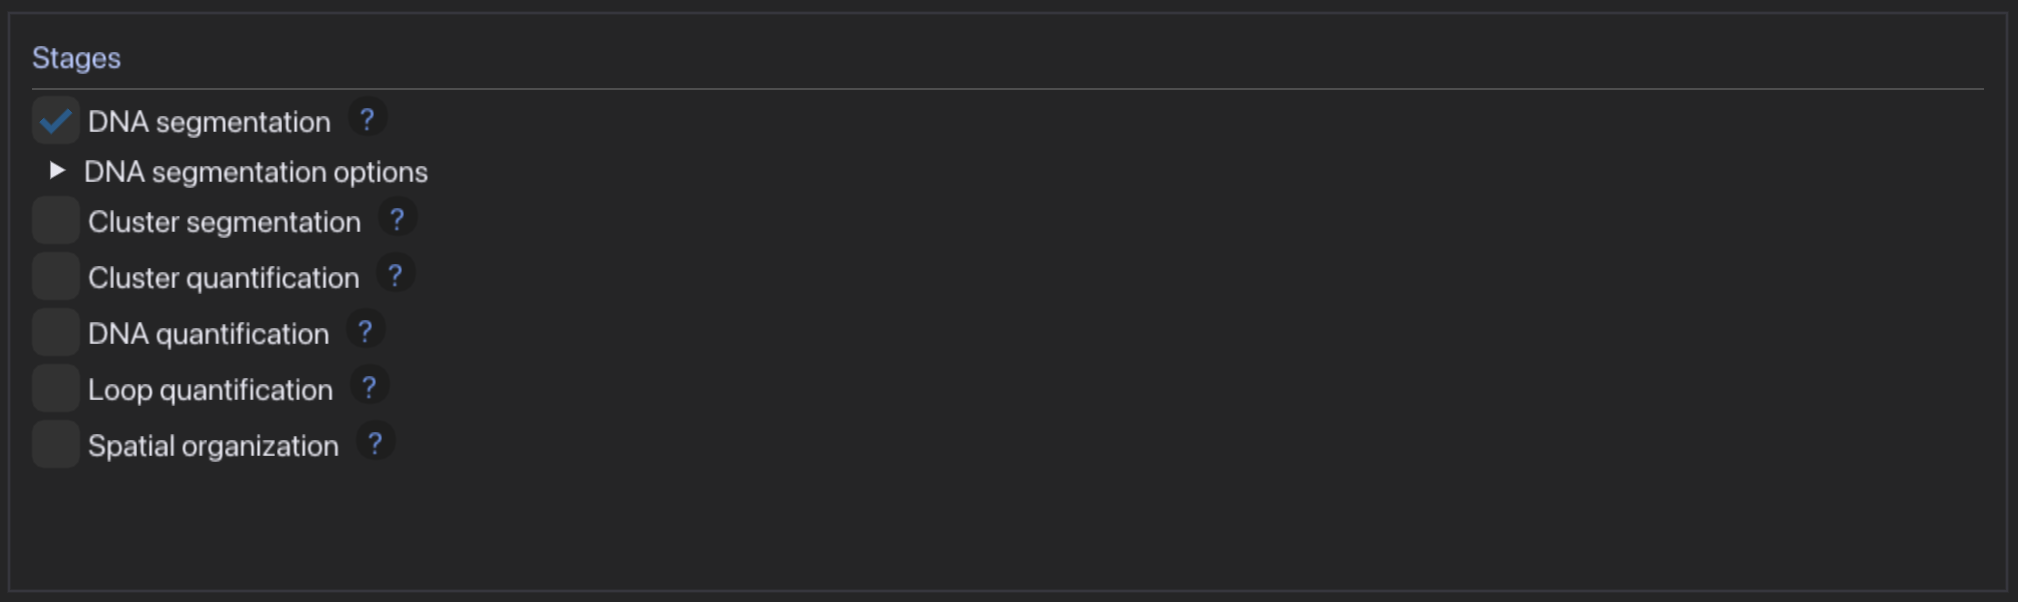
- Choose segmentation and quantification modules, carefully adjusting settings to your experiment
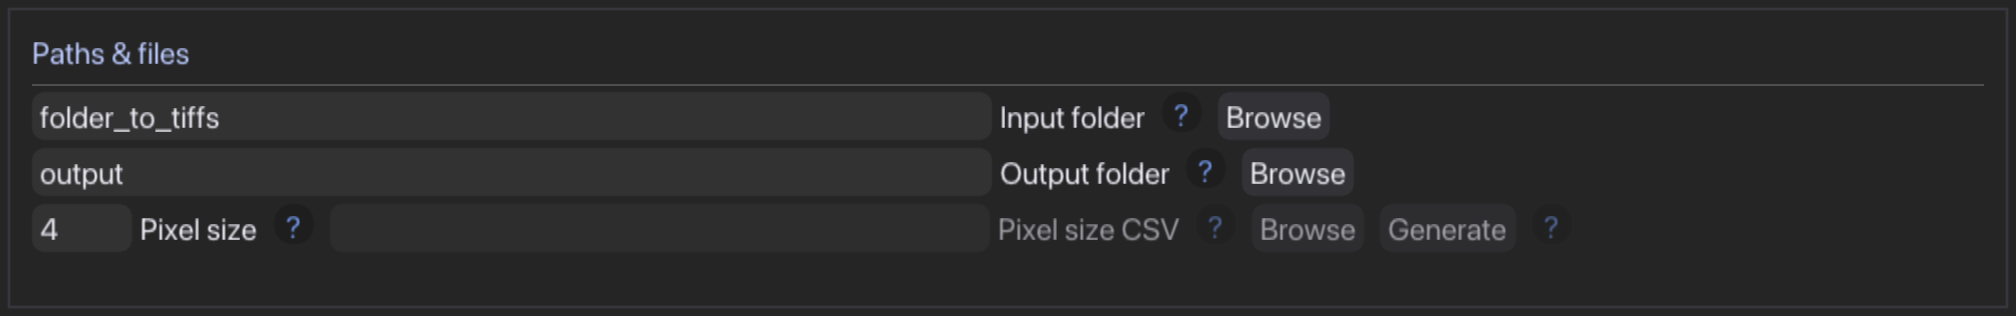
- Select an input folder containing images in TIFF format and select fixed pixel size or generate and fill out pixel size csv
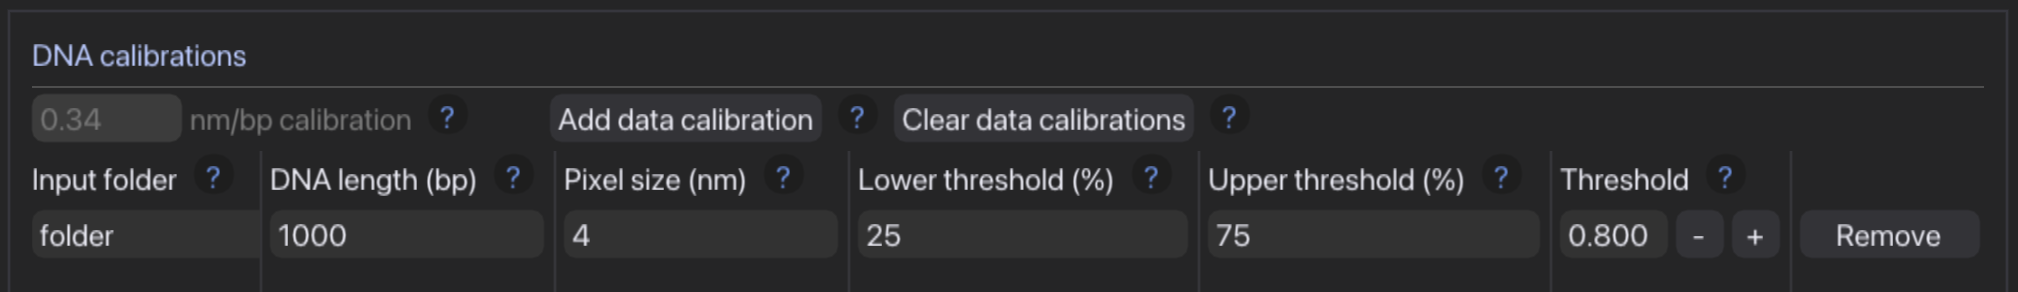
- Set calibration options
- Run DNAsight (press "Run" to start and "Stop" to stop the analysis before it finishes).
- Check results in output folder
Using the CLI
The CLI enables batch processing and reproducible runs.
Show CLI help:
dnasight-cmd --help
Configuration
DNAsight can be configured with config.yaml (included in the standalone zip). This file stores defaults for common settings.
- If you are using the standalone app, you will see
config.yamlnext to the executables. - If you installed via pip, DNAsight uses internal defaults and (optionally) a user-provided config.
Add details here about where config is read from (working directory vs user directory) once finalized.
Example data
The standalone download includes a data/ folder with example datasets you can use to test the full workflow.
Outputs
DNAsight generates csvs and/or image overlays and plots depending on the applied modules.
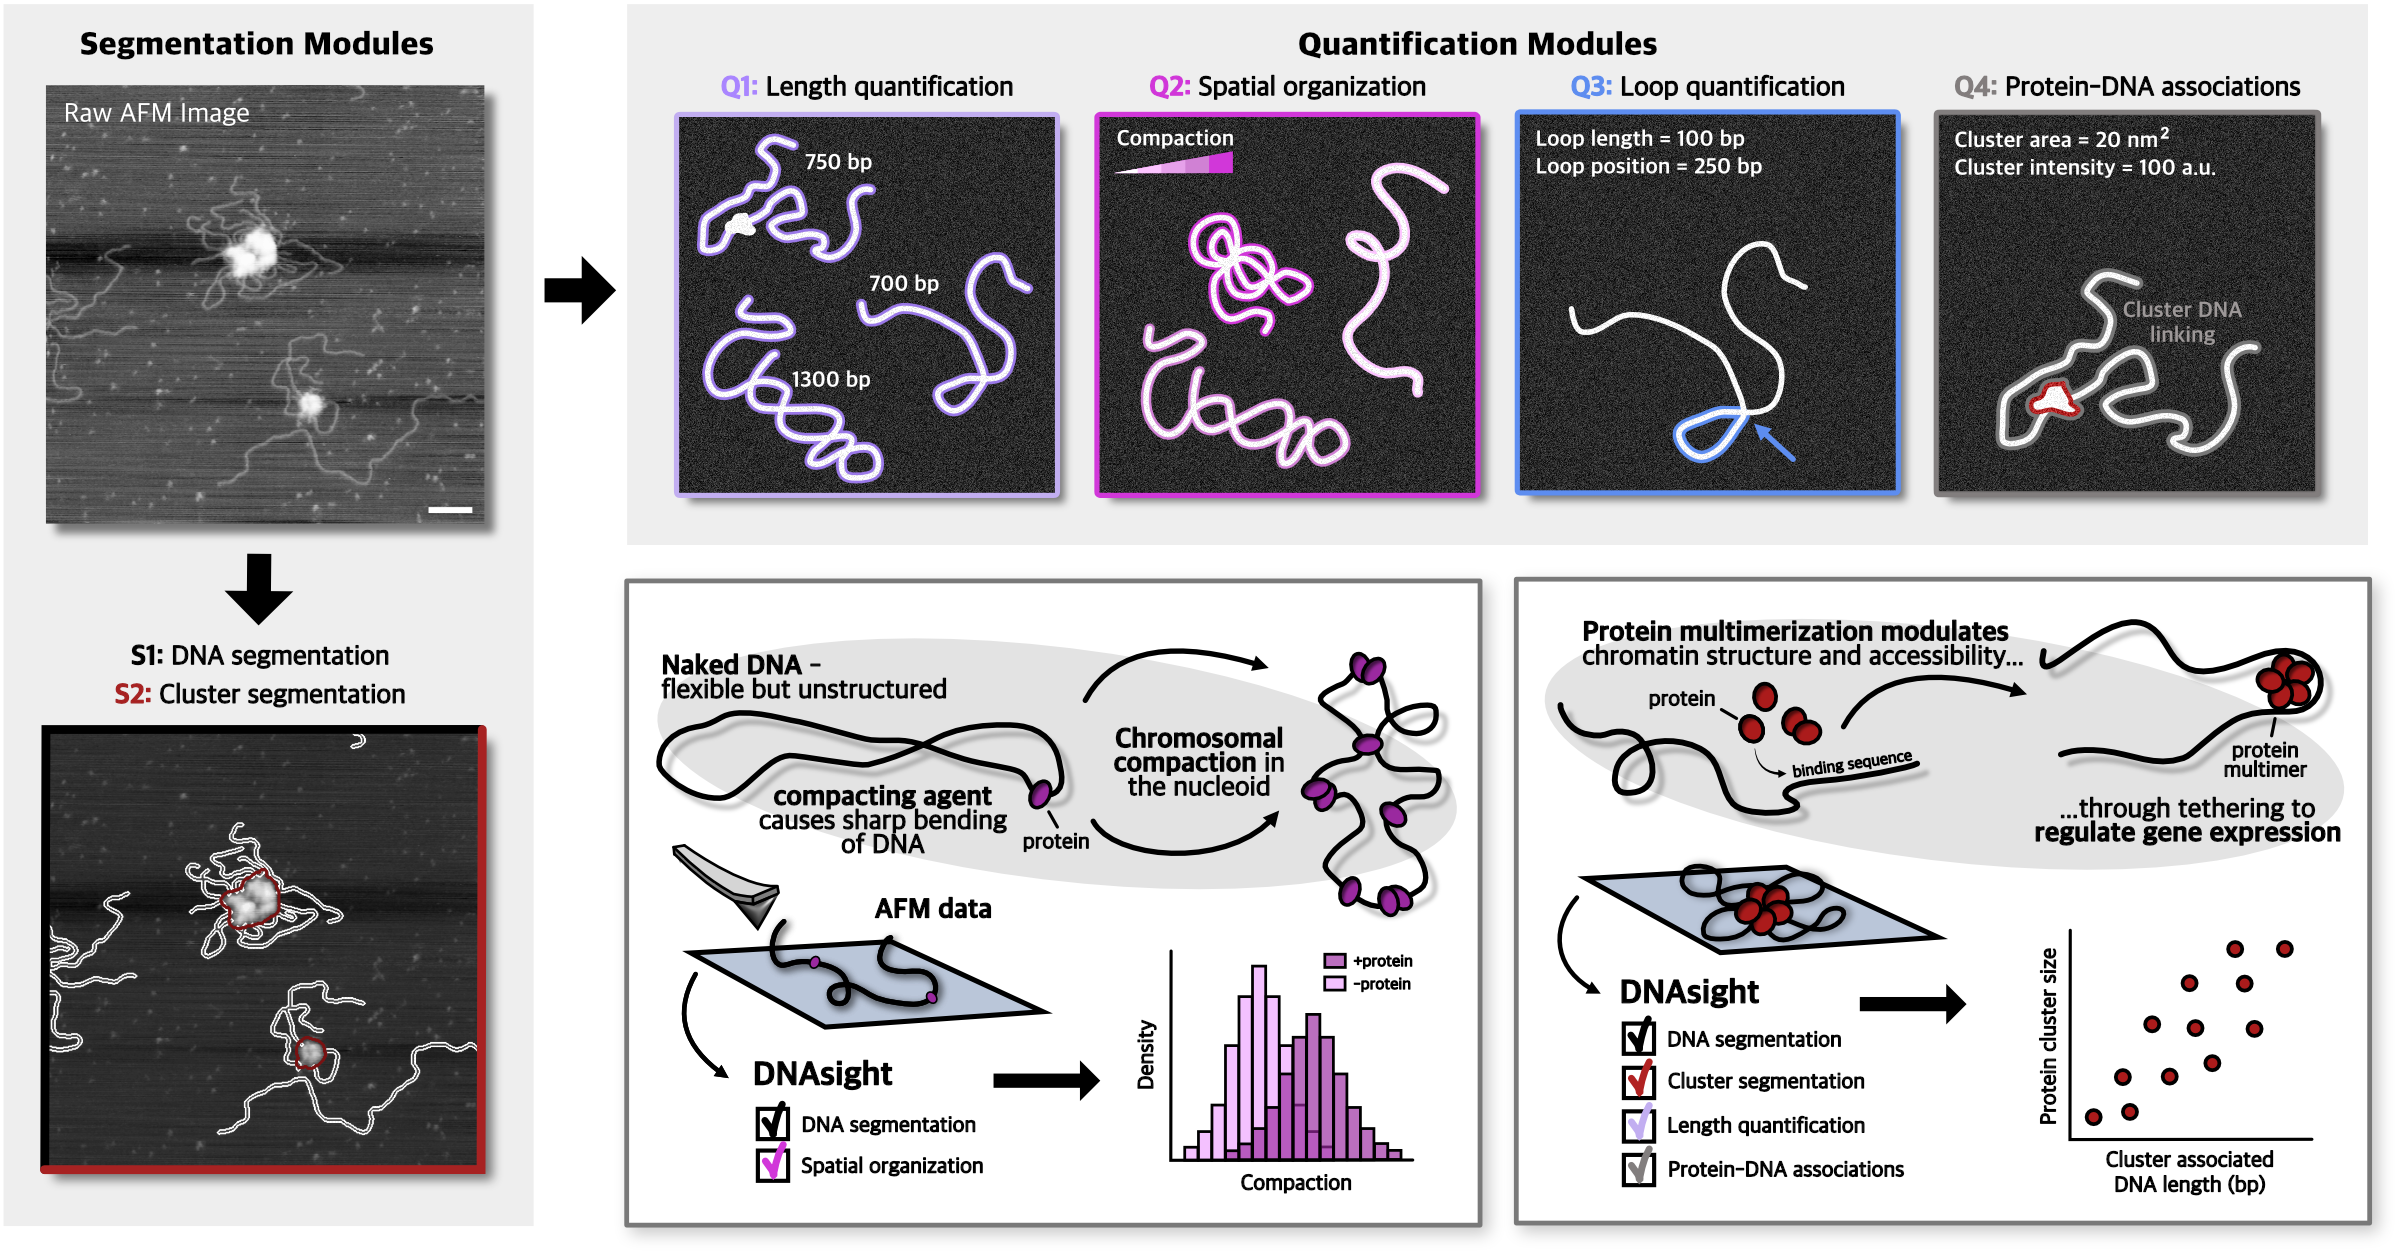
S1: DNA segmentation
The DNA segmentation module outputs one .tif file for each input image containing two layers:
- the raw image
- the segmentation
The segmentation layer also contains the global ID of each DNA molecule in the individual masks. The output .tif files have a_ added in front of the original filename to indicate that they are annotated files.
In addition, a folder called segmentation_plots is generated. This folder contains .png files with four plots for each input image and is intended to help the user assess DNA segmentation quality. These files are named in the same way as the annotated outputs.
S2: Cluster segmentation and quantification
The cluster segmentation module outputs:
- an
.npyfile containing the segmentation mask and global ID for each cluster - a
.pngfile intended to help users assess whether the cluster segmentation parameters should be adjusted - a
.csvfile calledsegmentation_results - a separate
.csvfile calledcluster_quantification
segmentation_results.csv
This file contains the following columns:
global_cluster_id: global ID of each cluster within the provided files. If you run a different folder, the IDs may repeat. They are only global within the given folder.file: filename of the corresponding.tiffilelocal_id: local cluster ID within the image file, used for internal reference for downstream quantificationscentroid_x: x coordinate of the centroid of a detected cluster in pixelscentroid_y: y coordinate of the centroid of a detected cluster in pixelsintensity: summed intensity of pixels in the segmented clusterarea: area of the segmented cluster in pixels
cluster_quantification.csv
This file contains the following columns:
cluster_id: global ID of each cluster within the provided files. If you run a different folder, the IDs may repeat. They are only global within the given folder.file: filename of the corresponding.tiffilesummed_intensity_px: summed intensity of pixels within the cluster segmentationbg_ring_mean: local background around the segmented clusterbg_corrected_summed_intensity_px: background-corrected summed intensity of pixelstouches_edge_cluster:TrueorFalsedepending on whether the segmented cluster touches the image edgecentroid_x: x coordinate of the centroid of a detected cluster in pixelscentroid_y: y coordinate of the centroid of a detected cluster in pixelspixel_size: pixel size of the given image when applied; empty if no pixel size is givencluster_area_nm2: area of the segmented cluster in nm²; empty if no pixel size is givensummed_intensity_per_nm: summed intensity of the segmented cluster normalized to pixel size; empty if no pixel size is givensummed_intensity_per_nm2: summed intensity of the segmented cluster normalized to area; empty if no pixel size is givenbg_summed_intensity_per_nm: local background-corrected summed intensity of the segmented cluster normalized to pixel size; empty if no pixel size is givenbg_summed_intensity_per_nm2: local background-corrected summed intensity of the segmented cluster normalized to area; empty if no pixel size is given
Q1: DNA length calculation
The DNA length calculation module outputs a folder called overlays, which contains .png files for each input image with the length of each segmented DNA component overlaid. The files are named as the annotated files, that is, with a_ added in front of the original filename.
It also outputs a .csv file called length_per_component, which contains information about the length of each segmented DNA component.
length_per_component.csv
This file contains the following columns:
filename: filename of the annotated filecomp_id: global ID of each DNA molecule within the provided files. If you run a different folder, the IDs may repeat. They are only global within the given folder.area_px: area of the segmented DNA molecule in pixelstouches_edge_dna:TrueorFalsedepending on whether the segmented DNA molecule touches the image edgelength_px: length of the segmented DNA molecule in pixelslength_nm: length of the segmented DNA molecule in nmlength_bp: length of the segmented DNA molecule in bplength_bp_sem: estimated error on the length of the segmented DNA molecule in bp based on the provided calibrationhad_valid_pixel_size:TrueorFalseindicating whether a valid pixel size was given for conversionbp_calibration_used:TrueorFalseindicating whether a calibration was applied
Q2: DNA spatial organization
The DNA spatial organization module outputs a .csv file called geometric_features_summary, which contains information about the extracted geometric features.
geometric_features_summary.csv
This file contains the following columns:
filename: filename of the annotated filepixel_size: pixel size of the given file, if providedcomp_id: global ID of each DNA molecule within the provided files. If you run a different folder, the IDs may repeat. They are only global within the given folder.touches_edge_dna:TrueorFalsedepending on whether the segmented DNA molecule touches the image edgelength_px: length of the segmented DNA molecule in pixelslength_nm: length of the segmented DNA molecule in nmrg_px: radius of gyration of the segmented DNA molecule in pixelsrg_nm: radius of gyration of the segmented DNA molecule in nmcompaction: reciprocal of the radius of gyration normalized to the length of the DNA molecule; unitlessn_branch_clusters: number of crossings of the segmented DNA moleculetortuosity: tortuosity of the segmented DNA molecule; empty if fewer than one end was found, for example for plasmidselongation: elongation metricmean_kappa_px_inv: mean curvature of the segmented DNA molecule in pixel spacestd_kappa_px_inv: standard deviation of curvature of the segmented DNA molecule in pixel spacemin_kappa_px_inv: minimum curvature of the segmented DNA molecule in pixel spacemax_kappa_px_inv: maximum curvature of the segmented DNA molecule in pixel spacemean_kappa_nm_inv: mean curvature of the segmented DNA molecule in real space, in 1/nmstd_kappa_nm_inv: standard deviation of curvature of the segmented DNA molecule in real space, in 1/nmmin_kappa_nm_inv: minimum curvature of the segmented DNA molecule in real space, in 1/nmmax_kappa_nm_inv: maximum curvature of the segmented DNA molecule in real space, in 1/nmno_strong_bends_px: number of strong bends evaluated over a given pixel distanceno_strong_bends_nm: number of strong bends evaluated over a given real-space distance in nmlp_px: persistence length in pixel spacelp_nm: persistence length in real space, in nmerror: an error message appears here if the calculation of a feature failed
Q3: DNA loop quantification
The DNA loop quantification module outputs a folder called loops, which contains one .pdf file for each input image. Each .pdf shows detected loops overlaid with loop length and loop position given in pixels.
A yellow circle is used to indicate anchor points for loops where the intensity of the overlap exceeds the mean plus standard deviation of the intensity of the DNA molecule.
The module also outputs a .csv file containing information about each loop.
Loop output .csv
This file contains the following columns:
filename: filename of the annotated filecomp_id: global ID of each DNA molecule within the provided files. If you run a different folder, the IDs may repeat. They are only global within the given folder.loop_index: loop number within the imageloop_length_px: length of the loop in pixelsraw_dist_px: distance from the closest end to the loop, excluding loops along the way, in pixelsdist_incl_loops_px: distance from the closest end to the loop, including loops along the way, in pixelsn_loops_added_inclusive: number of other detected loops in the same DNA object that were added to the path length because they lie on the shortest path from a skeleton endpoint to the loop attachment pointn_loops_excluded_samepos: number of other loops not counted because they are effectively at the same loop position as the current loopmean_dna_intensity: mean intensity of the full DNA moleculestd_dna_intensity: standard deviation of intensity of the full DNA moleculemean_anchor_intensity: mean intensity at the loop anchor positionstd_anchor_intensity: standard deviation of intensity at the loop anchor positionloop_length_nm: length of the loop in nm; empty if no pixel size is providedraw_dist_nm: distance from the closest end to the loop, excluding loops along the way, in nm; empty if no pixel size is provideddist_incl_loops_nm: distance from the closest end to the loop, including loops along the way, in nm; empty if no pixel size is providedloop_length_bp: length of the loop in bp; empty if no calibration is providedraw_dist_bp: distance from the closest end to the loop, excluding loops along the way, in bp; empty if no calibration is provideddist_incl_loops_bp: distance from the closest end to the loop, including loops along the way, in bp; empty if no calibration is providedtouches_edge_dna:TrueorFalsedepending on whether the segmented DNA molecule touches the image edgeattachment_x: x coordinate of the loop anchor in pixelsattachment_y: y coordinate of the loop anchor in pixels
Q4: Protein-DNA associations
The protein-DNA associations module outputs two .csv files.
The first is centered on individual clusters and is called cluster_dna_summary. It contains the same columns as cluster_quantification.csv, with additional columns describing associated DNA.
cluster_dna_summary.csv
Additional columns:
sum_length_px: total length of associated DNA in pixels; empty if no associated DNAsum_length_nm: total length of associated DNA in nm; empty if no associated DNA or if no pixel size is givensum_length_bp: total length of associated DNA in bp; empty if no associated DNA, if no pixel size is given, or if no calibration is appliedn_dna_linked: number of separate DNA segmentations associated with the clusterdna_ids_list: list of global IDs of all associated DNA segmentationstouches_edge_dna:TrueorFalsedepending on whether one or more associated DNA segmentations touch the image edge
The second file is called group_summary and contains information about connected groups of DNA segmentations and clusters.
group_summary.csv
This file contains the following columns:
filename: filename of the corresponding.tiffilen_clusters_in_group: number of clusters in the groupcluster_ids: list of global cluster IDs in the groupdna_ids: list of global DNA IDs in the grouptotal_length_px: total length of DNA in the group in pixels; empty if no DNA is presenttotal_length_nm: total length of DNA in the group in nm; empty if no DNA is present or if no pixel size is giventotal_length_bp: total length of DNA in the group in bp; empty if no DNA is present, if no pixel size is given, or if no calibration is givenlengths_px_list: list of DNA lengths in pixels, in the same order as the DNA IDslengths_nm_list: list of DNA lengths in nm, in the same order as the DNA IDs; empty if no DNA is present or if no pixel size is givenlengths_bp_list: list of DNA lengths in bp, in the same order as the DNA IDs; empty if no DNA is present, if no pixel size is given, or if no calibration is given
Notes
- IDs described as global are only global within a single run or folder.
- If another folder is processed separately, IDs may repeat.
- Several outputs depend on whether pixel size and bp calibration were supplied.
- Empty fields generally indicate that the required metadata was not available or that the calculation was not applicable.
Troubleshooting
macOS: app is blocked on first open
- Go to System Settings → Privacy & Security
- Click Open Anyway for DNAsight
CLI command not found (pip install)
- Make sure your virtual environment is activated
- Reinstall with
pip install dnasightinside the environment
Still stuck?
Open an issue on GitHub with:
- your OS version
- how you installed DNAsight (pip vs standalone)
- the exact error message
Development
For development installs (contributors):
git clone https://github.com/emilywinther/dnasight
cd dnasight
pip install -e .
License
MIT
Contact
For questions or bug reports, please open a GitHub issue.


Download files
Download the file for your platform. If you're not sure which to choose, learn more about installing packages.
Source Distribution
Built Distribution
Filter files by name, interpreter, ABI, and platform.
If you're not sure about the file name format, learn more about wheel file names.
Copy a direct link to the current filters
File details
Details for the file dnasight-1.7.0.tar.gz.
File metadata
- Download URL: dnasight-1.7.0.tar.gz
- Upload date:
- Size: 128.9 kB
- Tags: Source
- Uploaded using Trusted Publishing? Yes
- Uploaded via: twine/6.1.0 CPython/3.13.12
File hashes
| Algorithm | Hash digest | |
|---|---|---|
| SHA256 |
210ececc2e7cf58b90f85d9e5049d5fcdb58c4f555f9a6bbf5a5abb14549d862
|
|
| MD5 |
166a43f3c8310ed058d0508b3799ce4e
|
|
| BLAKE2b-256 |
eecd9049815559538d2e9c3693bc7b347972fcbb6cbbfd52c0aeb6e25ad1905a
|
Provenance
The following attestation bundles were made for dnasight-1.7.0.tar.gz:
Publisher:
publish.yml on kirkegaardlab/dnasight
-
Statement:
-
Statement type:
https://in-toto.io/Statement/v1 -
Predicate type:
https://docs.pypi.org/attestations/publish/v1 -
Subject name:
dnasight-1.7.0.tar.gz -
Subject digest:
210ececc2e7cf58b90f85d9e5049d5fcdb58c4f555f9a6bbf5a5abb14549d862 - Sigstore transparency entry: 1361503372
- Sigstore integration time:
-
Permalink:
kirkegaardlab/dnasight@34a8065f5c7f1a47ce9c558678c2f0d16f50781a -
Branch / Tag:
refs/heads/main - Owner: https://github.com/kirkegaardlab
-
Access:
public
-
Token Issuer:
https://token.actions.githubusercontent.com -
Runner Environment:
github-hosted -
Publication workflow:
publish.yml@34a8065f5c7f1a47ce9c558678c2f0d16f50781a -
Trigger Event:
workflow_dispatch
-
Statement type:
File details
Details for the file dnasight-1.7.0-py3-none-any.whl.
File metadata
- Download URL: dnasight-1.7.0-py3-none-any.whl
- Upload date:
- Size: 124.9 kB
- Tags: Python 3
- Uploaded using Trusted Publishing? Yes
- Uploaded via: twine/6.1.0 CPython/3.13.12
File hashes
| Algorithm | Hash digest | |
|---|---|---|
| SHA256 |
4469cf809234f5ee82a4f84133de09b5e0a0be158f391bcdf9786f90bde3b118
|
|
| MD5 |
44849cbbb5dbe87bec8f8c676a7870b7
|
|
| BLAKE2b-256 |
65ba1e813b447bfe9739e41a84ce9063db9707de2681371cae01a29b94f6eaa8
|
Provenance
The following attestation bundles were made for dnasight-1.7.0-py3-none-any.whl:
Publisher:
publish.yml on kirkegaardlab/dnasight
-
Statement:
-
Statement type:
https://in-toto.io/Statement/v1 -
Predicate type:
https://docs.pypi.org/attestations/publish/v1 -
Subject name:
dnasight-1.7.0-py3-none-any.whl -
Subject digest:
4469cf809234f5ee82a4f84133de09b5e0a0be158f391bcdf9786f90bde3b118 - Sigstore transparency entry: 1361503378
- Sigstore integration time:
-
Permalink:
kirkegaardlab/dnasight@34a8065f5c7f1a47ce9c558678c2f0d16f50781a -
Branch / Tag:
refs/heads/main - Owner: https://github.com/kirkegaardlab
-
Access:
public
-
Token Issuer:
https://token.actions.githubusercontent.com -
Runner Environment:
github-hosted -
Publication workflow:
publish.yml@34a8065f5c7f1a47ce9c558678c2f0d16f50781a -
Trigger Event:
workflow_dispatch
-
Statement type:


