DNA fragmentation analysis from electropherograms

Project description
DNAvi: integration, analysis, and visualization of cell-free DNA fragment traces
1. Description
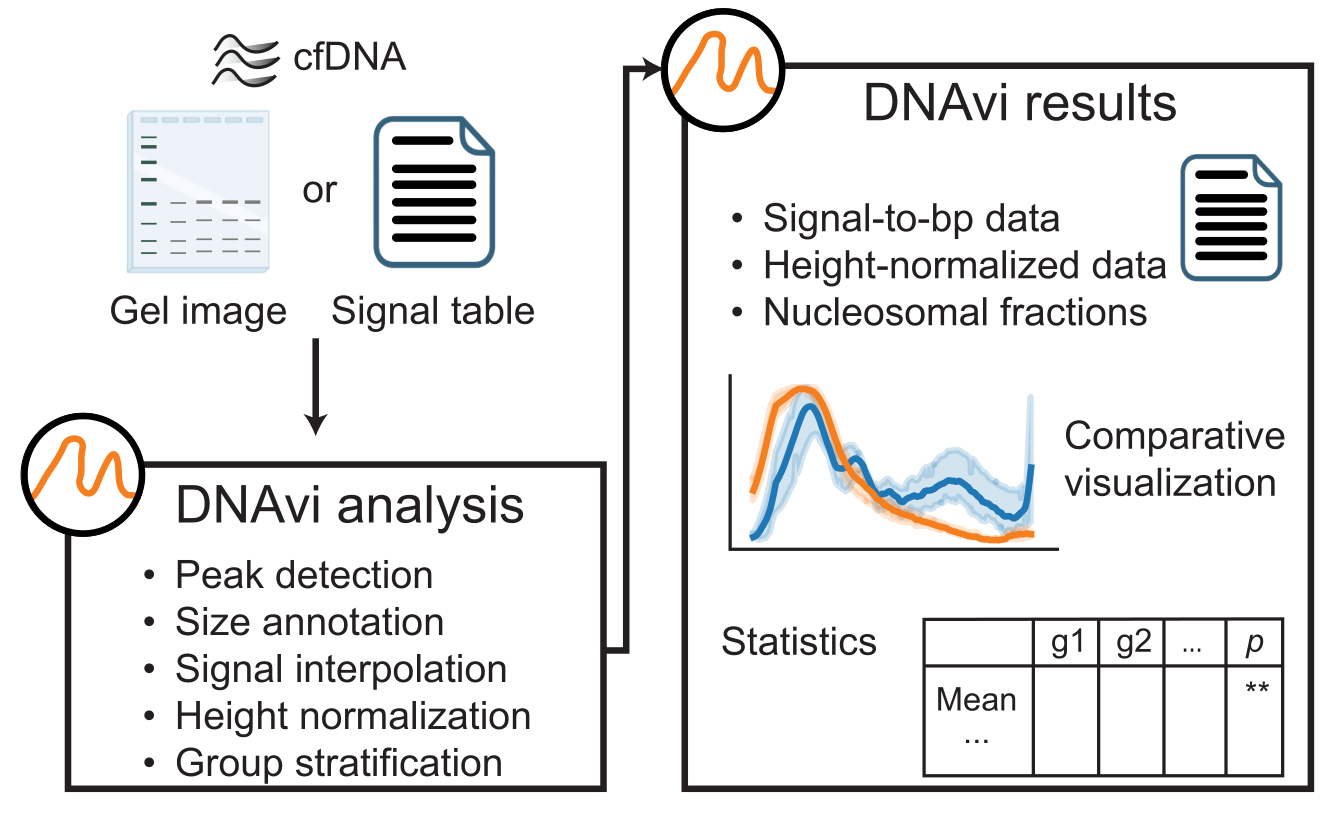
DNAvi is an open-access software to integrate, analyze and visualize multiple cell-free DNA fragmentation profiles from liquid biopsies. It uses either gel images or automated gel electrophoresis device output tables (electropherograms). The tool was tested on a 32 GB memory local PC on Ubuntu 24.04.2 LTS, as well as on Windows 10 and MAC-OS.
2. Run DNAvi
In this example we will run DNAvi on a test electropherogram signal table provided in this package:
cd ../path/to/DNAvi/
dnavi -i tests/electropherogram.csv -l tests/ladder.csv -m tests/metadata.csv
This will result in the following output:
Welcome to
  ____  _   _    _        _
 |  _ |  \ | |  / \__   _(_)
 | | | |  \| | / _ \ \ / / |
 | |_| | |\  |/ ___ \ V /| |
 |____/|_| \_/_/   \_\_/ |_|

    DNA file: tests/electropherogram.csv
    Ladder file: tests/ladder.csv
    Meta file: tests/metadata.csv

------------------------------------------------------------
           ELECTROPHEROGRAM DNA SIZE ANALYSIS
------------------------------------------------------------

        DNA file: tests/electropherogram.csv
        Ladder file: tests/ladder.csv
        Meta file: None

Saving results to: tests/results/

------------------------------------------------------------
... and additional infos depending on the analysis details. Once DNAvi is finished, this message will appear:
You can now go to you results folder:
   ├── results
        ├── plots
        ├── stats
        └── qc
In the plots and stats folder, you will find various visualizations summarizing fragmentomic traces of your samples.
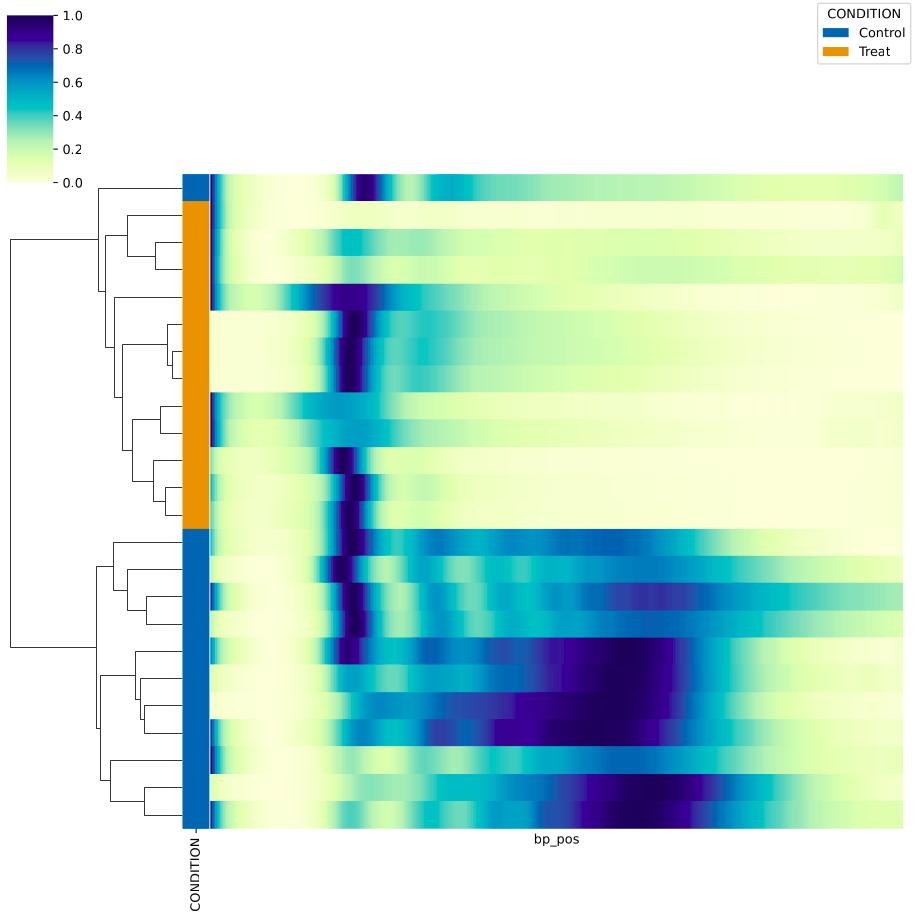
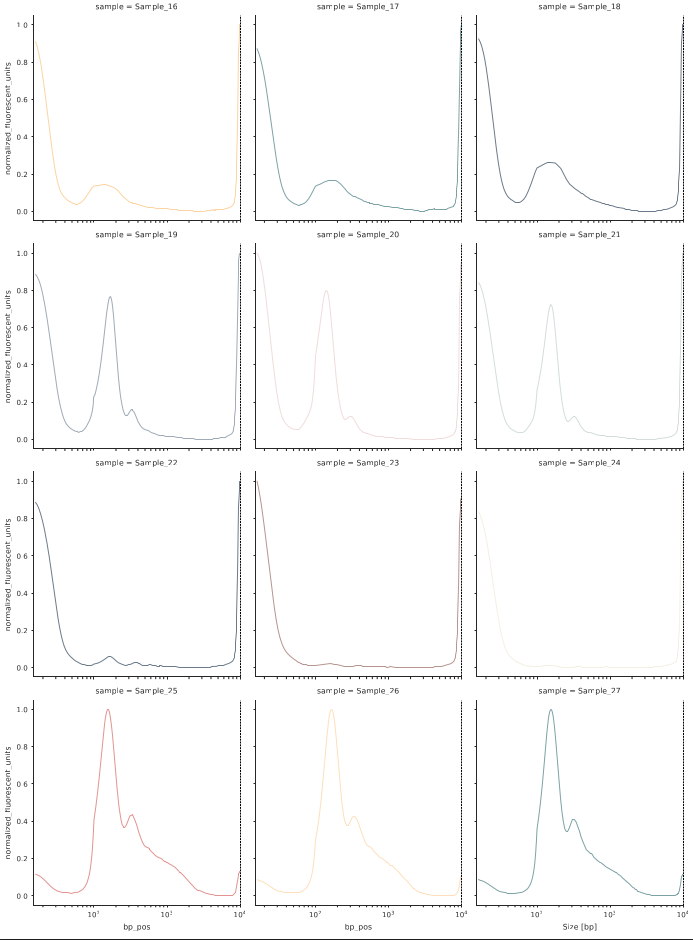
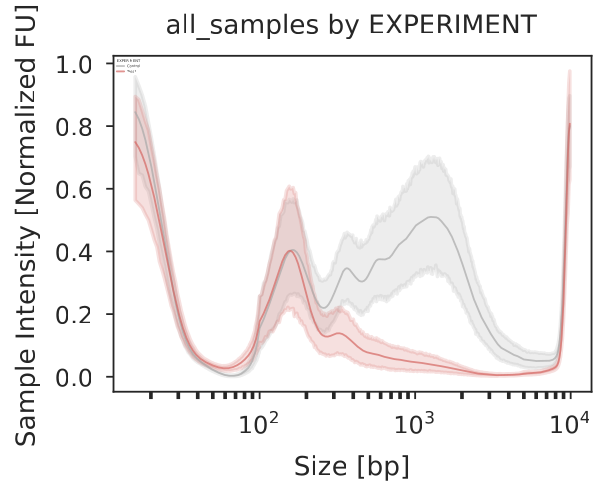
In case you provided a metadata file, each category will result in its own plot. In the example below, the 27 samples stem from two experiments, and we can see the integrated profile plot for each expeirment below:
3. Help and documentation
If you need help, simply run
dnavi --help
Which will result in a display of command line arguments with additional explanations:
Welcome to
  ____  _   _    _        _
 |  _ |  \ | |  / \__   _(_)
 | | | |  \| | / _ \ \ / / |
 | |_| | |\  |/ ___ \ V /| |
 |____/|_| \_/_/   \_\_/ |_|

usage: DNAvi.py [-h] [-i [<input-file-or-folder>]] -l [<ladder-file>] [-m [<metadata-file>]] [-n [<run-name>]] [-c [<config-file>]] [-iv [<(start,step)>]]
                [-p] [-un] [-nt [<sample_name>]] [-ml <int>] [-incl] [-cor] [--verbose] [-v]

Analyse Electropherogram data e.g. for cell-free DNA from liquid biopsies

options:
  -h, --help            show this help message and exit
  -i [<input-file-or-folder>], --input [<input-file-or-folder>]
                        Path to electropherogram table file or image file OR directory containing those files. Accepted formats: .csv/.png/.jpeg/.jpg or
                        directory containing those.
  -l [<ladder-file>], --ladder [<ladder-file>]
                        Path to ladder table file. Accepted format: .csv
  -m [<metadata-file>], --meta [<metadata-file>]
                        Path to metadata table file containing grouping information for input file (e.g. age, sex, disease). Accepted format: .csv
  -n [<run-name>], --name [<run-name>]
                        Name of your run/experiment. Will define output folder name
  -c [<config-file>], --config [<config-file>]
                        Define nucleosomal fractions with this path to a configuration file containing custom (nucleosome) intervals for statistics.
                        Accepted format: tab-separated text files (.txt)
  -iv [<(start,step)>], --interval [<(start,step)>]
                        Auto-generate nucleosomal size intervals by providing (start,step), e.g. start at 100 and increase by 200 bp
  -p, --paired          Perform paired statistical testing
  -un, --unnormalized   Do not perform min/max normalization. ATTENTION: will be DNA-concentration sensitive.
  -nt [<sample_name>], --normalize_to [<sample_name>]
                        Name of the sample to normalize all values to. ATTENTION: will be DNA-concentration sensitive.
  -ml <int>, --marker_lane <int>
                        Change the lane selected as the DNA marker/ladder, default is first lane (1). Using this will force to use the specified column
                        even if other columns are called Ladder already.
  -incl, --include      Include marker bands into analysis and plotting.
  -cor, --correct       Perform advanced automatic marker lane detection in samples with highly variant concentrations (e.g., dilution series), so that
                        the marker borders will be determined for each sample individually
  --verbose             increase output verbosity
  -v, --version         show program's version number and exit

Version: 0.2, created by Anja Hess <github.com/anjahess>.
4. Citation
Anja Hess1,2,3, Dominik Seelow1, and Helene Kretzmer2,4: DNAvi: Integration, statistics, and visualization of cell-free DNA fragment traces (2025).
- Center of Genomic Medicine, Berlin Institute of Health at Charité Universitätsmedizin Berlin, Berlin, Germany
- Max Planck Institute for Molecular Genetics, Berlin, Germany
- Department of Biology, Chemistry and Pharmacy, Freie Universität Berlin, Berlin, Germany
- Digital Health Cluster, Hasso Plattner Institute for Digital Engineering, Digital Engineering Faculty, University of Potsdam, Potsdam, Germany
Release history Release notifications | RSS feed


Download files
Download the file for your platform. If you're not sure which to choose, learn more about installing packages.
Source Distribution
Built Distribution
Filter files by name, interpreter, ABI, and platform.
If you're not sure about the file name format, learn more about wheel file names.
Copy a direct link to the current filters


