Doxyplot is a plotting wrapper around matplotlib for easy plotting.

Project description
Doxyplot
Doxyplot is a plotting wrapper around matplotlib for easy plotting.
Installation
(Not ready yet) Use the package manager pip to install Doxyplot.
pip install doxyplot
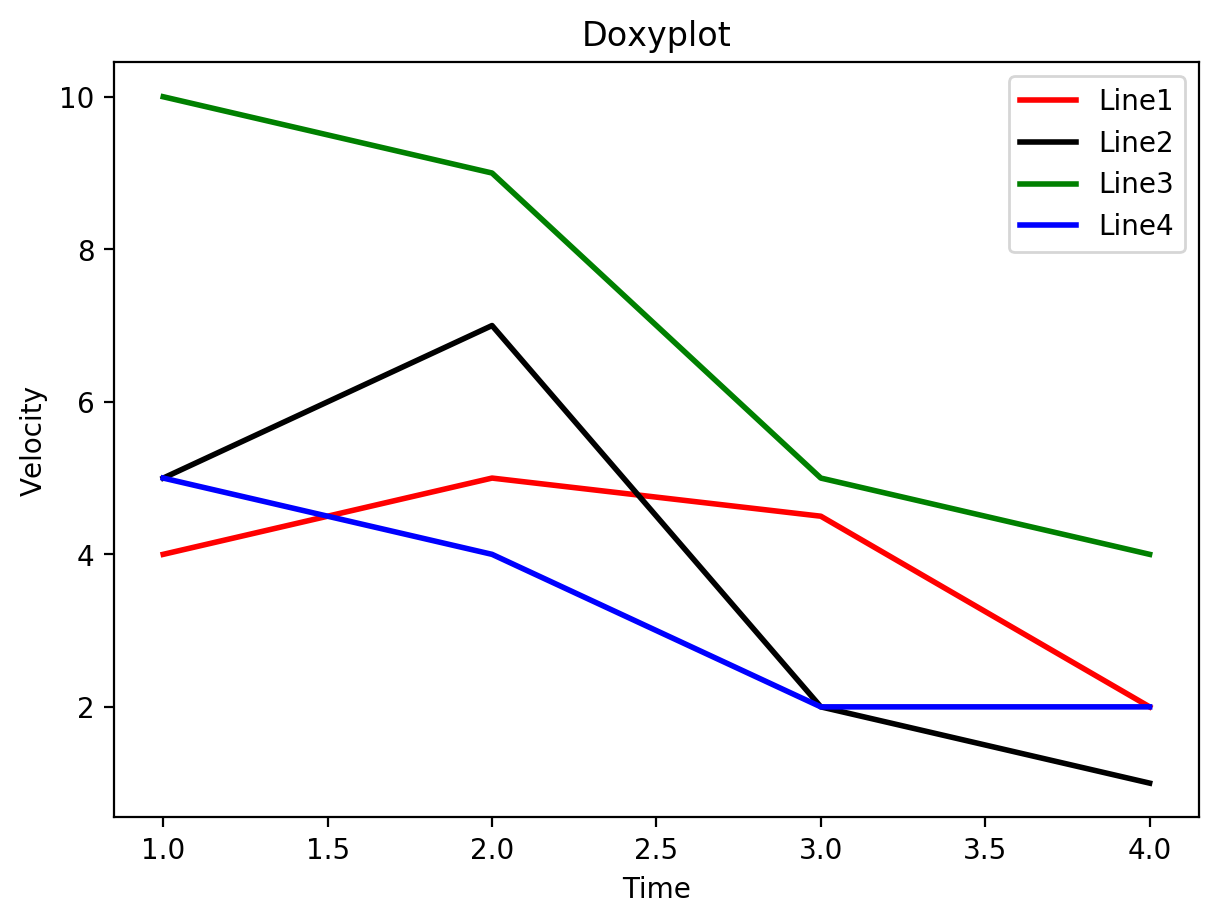
Usage
import doxyplot.doxyplot_core as dp

plot = dp.Doxyplot()

x=[1,2,3,4]
y=[4,5,4.5,2]
y2=[5,7,2,1]
y3=[10,9,5,4]
y4=[5,4,2,2]

plot.append_data(x, y, 'r', 'Line1', linewidth=2.0)
plot.append_data(x, y2, 'k', 'Line2', linewidth=2.0)
plot.append_data(x,y3, c='g', label='Line3')
plot.append_data(x,y4, c='b', label='Line4')
plot.construct_plot("Doxyplot", "Time", "Velocity",save="export.png")
Contributing
Pull requests are welcome. For major changes, please open an issue first to discuss what you would like to change.
License
Release history Release notifications | RSS feed

Download files
Download the file for your platform. If you're not sure which to choose, learn more about installing packages.
Source Distribution
doxyplot-0.1.0.tar.gz
(3.0 kB
view details)
Built Distribution
Filter files by name, interpreter, ABI, and platform.
If you're not sure about the file name format, learn more about wheel file names.
Copy a direct link to the current filters
File details
Details for the file doxyplot-0.1.0.tar.gz.
File metadata
- Download URL: doxyplot-0.1.0.tar.gz
- Upload date:
- Size: 3.0 kB
- Tags: Source
- Uploaded using Trusted Publishing? No
- Uploaded via: twine/3.4.2 importlib_metadata/4.8.1 pkginfo/1.7.1 requests/2.26.0 requests-toolbelt/0.9.1 tqdm/4.62.3 CPython/3.8.2
File hashes
| Algorithm | Hash digest | |
|---|---|---|
| SHA256 |
61be1e1223fec60364a3b716b7d4c93c0c46013f482d402bd4f2665306f3cae8
|
|
| MD5 |
d1e2c1fa95b17aa2d89ca4b8b91bb079
|
|
| BLAKE2b-256 |
14150a4cee1e9ad5a52621a612cb58f0b2fbf21aef5567d6a8259ad61dde6155
|
File details
Details for the file doxyplot-0.1.0-py3-none-any.whl.
File metadata
- Download URL: doxyplot-0.1.0-py3-none-any.whl
- Upload date:
- Size: 4.5 kB
- Tags: Python 3
- Uploaded using Trusted Publishing? No
- Uploaded via: twine/3.4.2 importlib_metadata/4.8.1 pkginfo/1.7.1 requests/2.26.0 requests-toolbelt/0.9.1 tqdm/4.62.3 CPython/3.8.2
File hashes
| Algorithm | Hash digest | |
|---|---|---|
| SHA256 |
080294d62d26c0bc95a5a346249d88e539f0813f07c1685a2e52bc273105f5a7
|
|
| MD5 |
4f99a90371f76923f55b40d70d70c704
|
|
| BLAKE2b-256 |
8eec6ae14fb2ae85397ca4d308d3821a79c06cef0136e9e238d7e8355c78b490
|


