





dpc-radar is a small, typed Python library for the open radar data of the Italian Civil Protection Department (Dipartimento della Protezione Civile, DPC). A national network of weather radars, together with thousands of rain gauges, measures rain over all of Italy, and the DPC publishes a new map every 5 minutes, free for anyone. This library lets you use those maps from a script: which frame is the latest, how to download it, and how to read the API's answers, including its surprises.
async with RadarClient() as radar:
    rain = await radar.latest("CUM24")  # the last 24 hours of rain, all of Italy
print(rain.sample([(15.78, 37.92)]))  # mm at Melito di Porto Salvo (184.9 on 10 October 2026)
Work in progress. dpc-radar is being extracted from Limen. Today it holds the products, the rain grid and the client. The archive, the 2010–2025 history and the criticality bulletins follow, one pull request at a time: see the roadmap.
Contents
- The radar of Italy, in 30 seconds
- What a storm looks like
- The products
- Who is it for
- Quick start
- How it works
- The traps we already fell into
- API at a glance
- Roadmap, and where AI helps
- Contributing
- Data licence and credits
The radar of Italy, in 30 seconds
A weather radar sends out a pulse of microwaves and listens for the echo. Raindrops reflect it: the stronger the echo, the heavier the rain. The DPC joins the radars that cover Italy into one national map, and then corrects the radar with what the rain gauges on the ground really collected. The correction is called the «Merging».
flowchart LR
    R["📡 Weather radars<br/>all over Italy"] --> M1["National mosaic<br/>every 5 minutes"]
    G["🌧️ Rain gauges<br/>thousands on the ground"] --> MG
    M1 --> P1["SRI · SRT1<br/>radar only, 1 km"]
    M1 --> MG["«Merging»<br/>radar corrected with gauges"]
    MG --> P2["CUM3 · 6 · 12 · 24<br/>radar + gauges, 0.01°"]
    P1 & P2 -->|"radar-api.protezionecivile.it"| D["dpc-radar"]
    D --> U["📁 Your analysis<br/>maps · alerts · models"]
What you can do with it, for example:
- know how much it has rained in a place in the last 3, 6, 12 or 24 hours;
- see a storm arriving, 5 minutes at a time;
- feed flood and landslide models with rain that was measured, not forecast;
- keep your own archive: the DPC keeps only about five months.
What a storm looks like
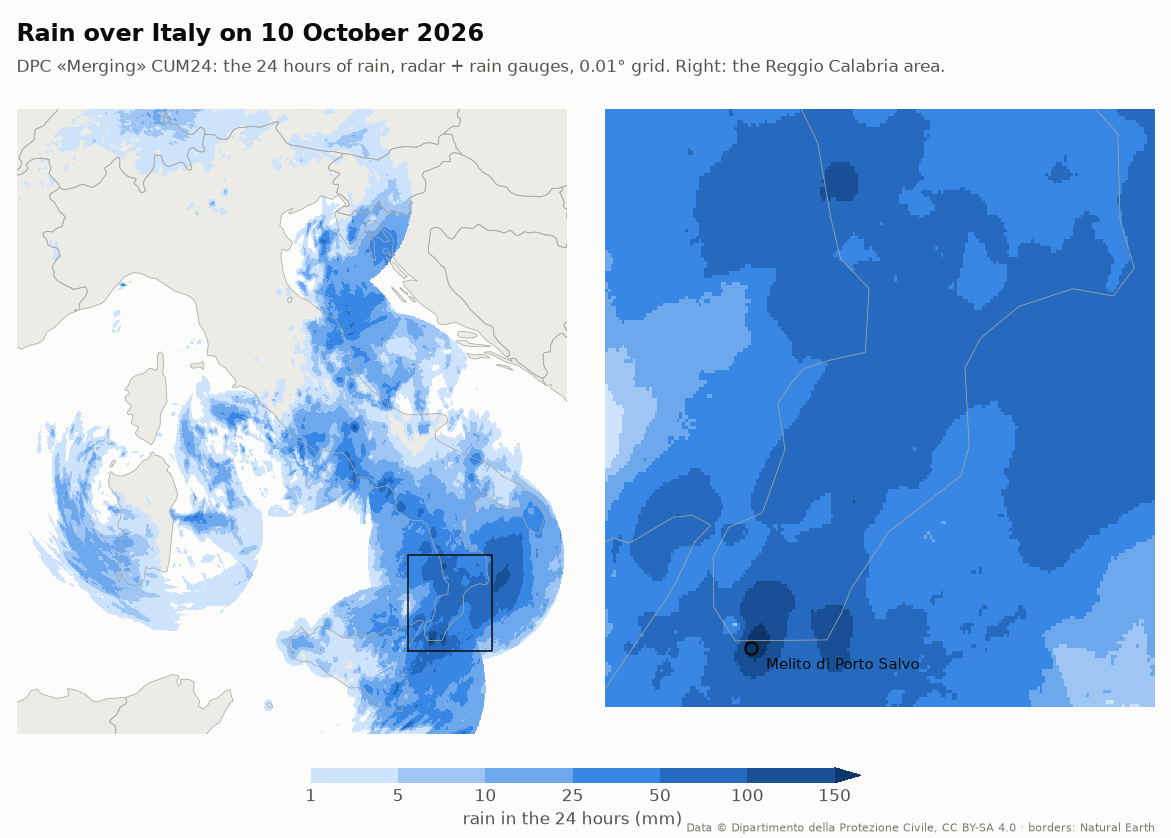
On 10 October 2026 a storm hit the area around Reggio Calabria, in the toe of Italy. This is the rain of those 24 hours, from one frame of the «Merging» CUM24 product:
The radar sees the storm while it happens. Here is the rain intensity (SRI, in mm per hour) at four moments of the same day:
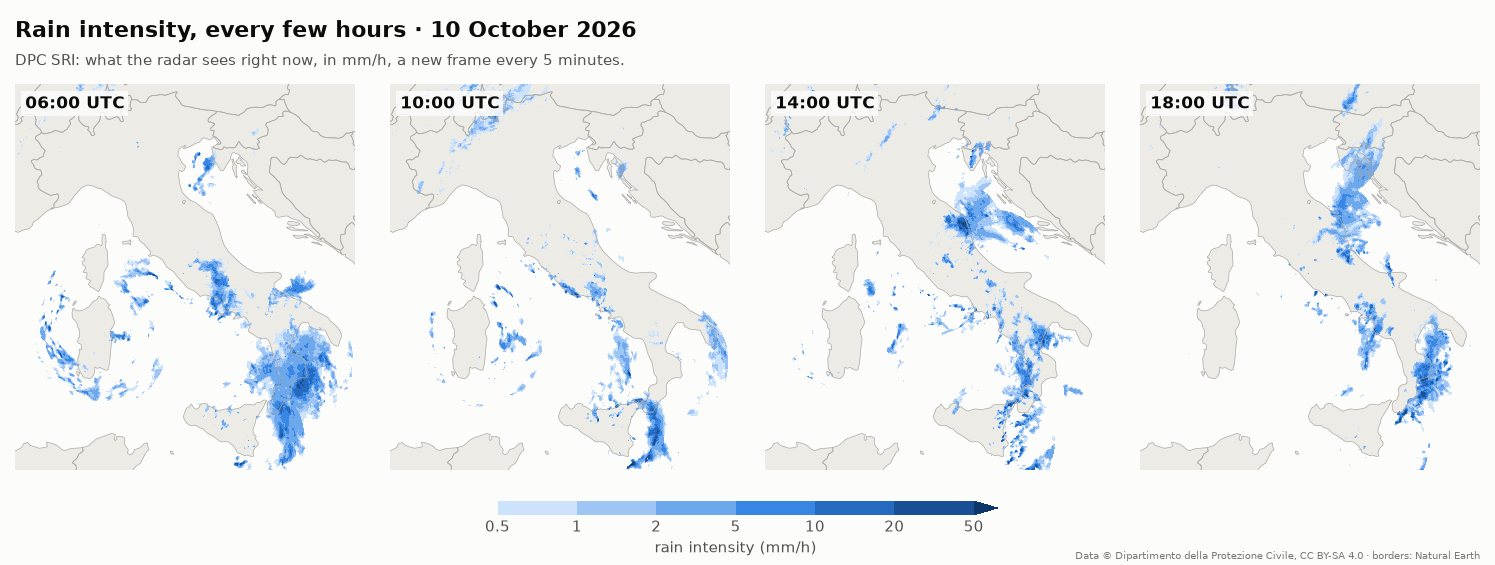
Look at the arcs west of Sardinia at 06:00. Rings centred on a single radar usually mean an artefact, not a storm: the radar picks up echoes from the sea or from bent beams. Check a frame against the one before it before you trust it (the traps).
And this is the same storm in one place, hour by hour. At Melito di Porto Salvo most of the rain fell before dawn, between midnight and 05:00 UTC, with up to 21 mm in a single hour:
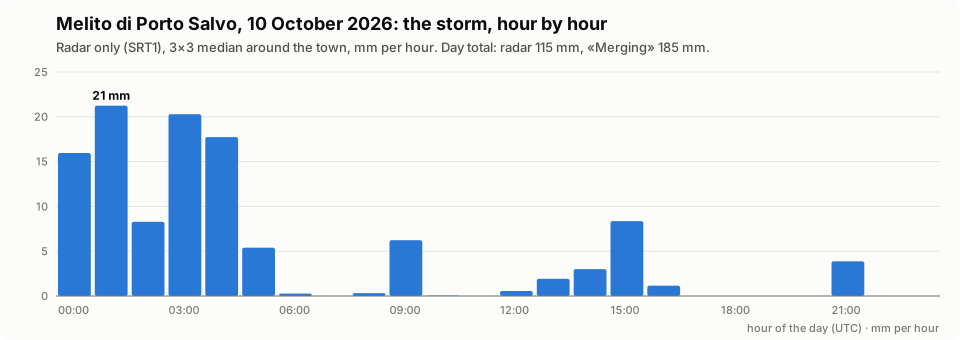
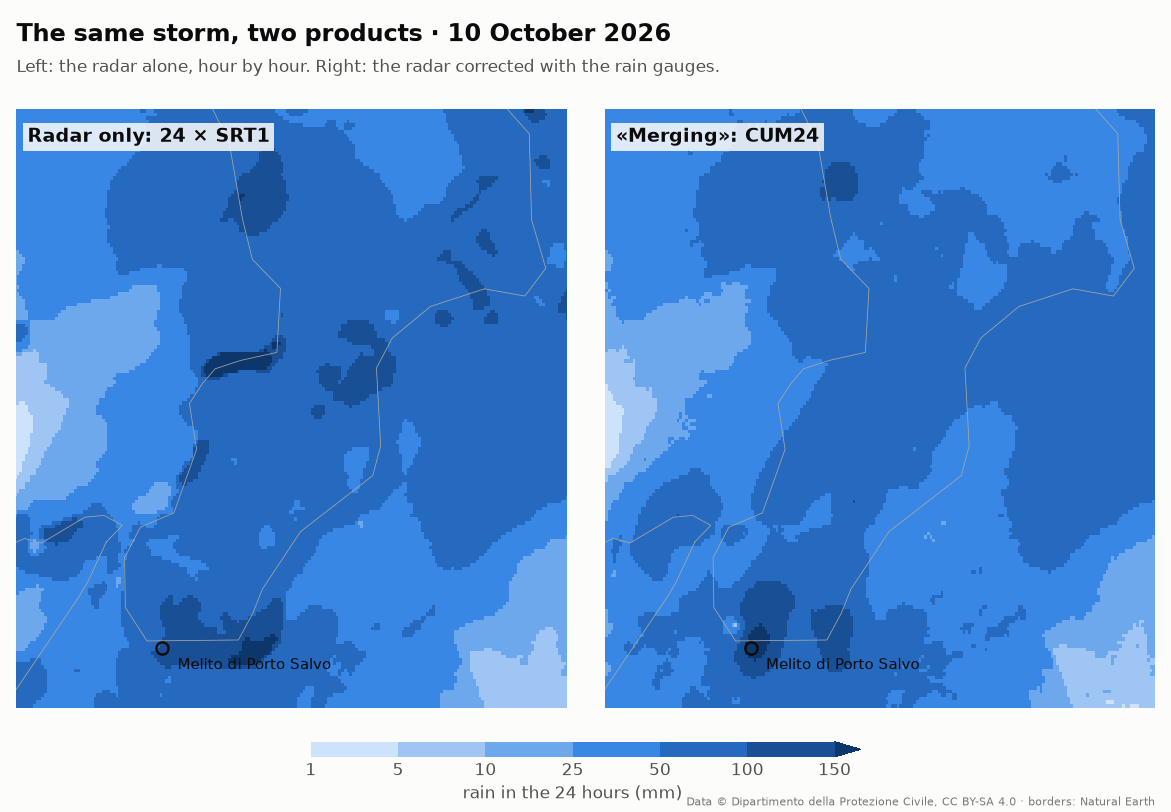
Radar alone, or radar corrected with the gauges? At Melito the gauges («Merging») measured 185 mm in the day, and the radar alone saw only 115 mm. Over the whole box, though, the radar read about 12 % more than the gauges. The radar is wrong in both directions, depending on the place. That is why the «Merging» exists: it keeps the radar's picture and corrects it to what the gauges collected.
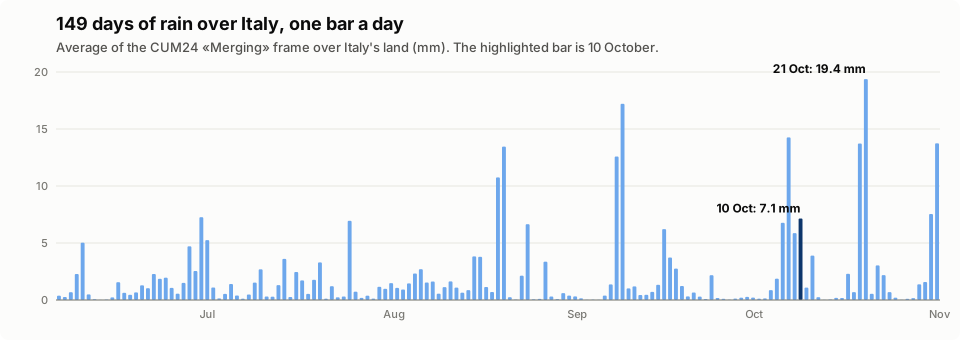
Zoom out, and five months of frames tell the story of a season. Averaged over all of Italy's land, 10 October was not even the wettest day of the autumn: 21 October was (19.4 mm on average against 7.1). A storm that devastates one valley can be a small bar on a national chart.
Every image above is made from real DPC frames by
docs/make_images.py,
with the functions of this library.
The products
| Product | What it measures | Source | Grid | New frame |
|---|---|---|---|---|
SRI |
rain intensity right now (mm/h) | radar only | 1 km | every 5 min |
SRT1 |
rain in the last hour (mm) | radar only | 1 km | every 5 min |
CUM3, CUM6, CUM12, CUM24 |
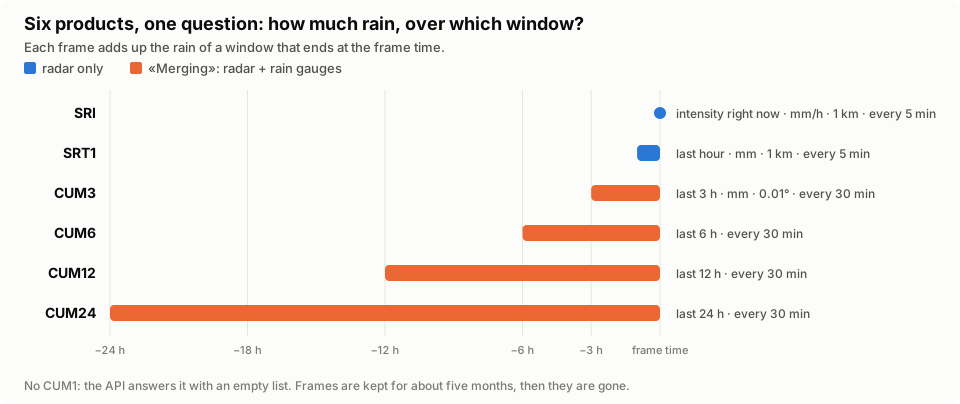
rain in the last 3–24 hours (mm) | «Merging»: radar + rain gauges | 0.01°, EPSG:4326 | every 30 min |
Which one should I use?
- Is it raining now, and how hard? →
SRI. - How much rain fell in the last hour? →
SRT1. - How much rain fell in the last day? →
CUM24(orCUM3–CUM12for shorter windows). The gauges make it the most accurate, but it arrives every 30 minutes, not every 5.
Who is it for
- Researchers and students in hydrology, meteorology and geology who want measured rain in a notebook or a pipeline.
- Civil protection, utilities and engineers who watch rivers, slopes, roads or drains and need rain totals that are repeatable.
- Data journalists and developers who want to show what fell during a storm, with a source anyone can check.
It started inside Limen, where the radar decides when to re-run the risk model (heavy rain on the radar starts a run at once) and the «Merging» totals feed the flood score.
Quick start
1. Install
pip install dpc-radar
Python 3.12 or newer. It depends on httpx, numpy and rasterio.
No account and no key: the DPC data are open.
2. Get the latest frame
import asyncio

from dpc_radar import RadarClient


async def main() -> None:
    async with RadarClient() as radar:
        rain = await radar.latest("CUM24")
    print(rain.product.name, rain.time)  # CUM24 2026-11-04 14:00:00+00:00
    print(rain.data.shape)  # (1233, 1341): 0.01° pixels, NaN where the radar does not see


asyncio.run(main())
3. Read the rain at a place
melito, reggio = (15.78, 37.92), (15.65, 38.11)  # lon, lat in degrees
print(rain.sample([melito, reggio]))  # mm in the last 24 hours, or None if not measured
print(rain.peak((15.25, 37.75, 17.25, 39.45), threshold=50))  # (highest mm, pixels >= 50)
sample reads the median of the 3×3 pixels around each point, never one
pixel, and answers None where the radar has no data: not measured is not
the same as dry.
4. Check a frame before you trust it
async with RadarClient() as radar:
    now = await radar.latest("CUM24")
    before = await radar.at("CUM24", now.time - now.product.period)  # 30 minutes earlier

check = now.check(before, max_step=150)  # mm: more than half an hour of rain
if check.grid is None:
    rain = before  # rejected: this frame jumped up where no rain can fall that fast
else:
    rain = check.grid  # consistent, or the frame before was the wrong one
print(check.verdict, check.jumps)
A frame older than about five months is gone: radar.at(...) returns
ABSENT instead of raising, and never retries it.
5. Look at it
With pip install matplotlib:
import matplotlib.pyplot as plt

h, w = rain.data.shape
left, top = rain.transform.c, rain.transform.f
right, bottom = left + w * rain.transform.a, top + h * rain.transform.e
plt.imshow(rain.data, extent=(left, right, bottom, top), cmap="Blues", vmin=0, vmax=50)
plt.colorbar(label="rain in the last 24 hours (mm)")
plt.show()
Without the client
Every step is also a plain function, if you have your own HTTP stack:
products.last_product_url, parse_last_product, products.download_body,
parse_download, is_expired, then RainGrid.from_geotiff(raw, product, time).
How it works
Two calls, and one surprise
The open API at radar-api.protezionecivile.it has two calls that matter.
The first says which frame is the newest; the second gives a short-lived
download link for one frame.
sequenceDiagram
    autonumber
    participant You as Your script
    participant L as dpc_radar
    participant A as DPC radar API
    participant S as S3 storage

    You->>L: last_product_url(CUM24)
    L-->>You: URL + params
    You->>A: GET /findLastProductByType?type=CUM24
    A-->>You: {"lastProducts": [{"time": 1793790000000, "period": "PT30M"}]}
    You->>L: parse_last_product(answer)
    L-->>You: LastProduct(time, period = 30 min)
    You->>L: download_body(CUM24, time)
    You->>A: POST /downloadProduct {"productType", "productDate"}
    A-->>You: {"url": "https://…s3…"}  (a signed link)
    You->>S: GET the link
    S-->>You: GeoTIFF
What a frame request can answer
flowchart TD
    q(["POST /downloadProduct<br/>(product, time)"]) --> c1{"status 200?"}
    c1 -- yes --> ok(["parse_download → S3 link<br/>download the GeoTIFF"])
    c1 -- no --> c2{"is_expired(status, body)?<br/>a 500 with S3's 403 inside"}
    c2 -- yes --> gone(["the frame is gone<br/>(older than ~5 months)<br/>never retry"])
    c2 -- no --> retry(["a real failure<br/>retry later"])
The building blocks
Three layers. products is pure: it builds requests and reads answers,
with no network. grid turns a GeoTIFF into an array you can sample and
check. client wires them to your httpx.AsyncClient, so timeouts,
retries and proxies stay under your control.
flowchart LR
    subgraph yours["Your code"]
        H["httpx.AsyncClient<br/>or a send= hook"]
    end
    subgraph lib["dpc_radar"]
        direction TB
        CL["client.py<br/>RadarClient · latest · at · ABSENT"]
        PR["products.py<br/>SRI · SRT1 · CUM3–24<br/>requests · parsers · is_expired"]
        GR["grid.py<br/>RainGrid · sample · peak · crop · check"]
        ER["errors.py<br/>DpcRadarError"]
        NX["archive · history · bulletins<br/>(coming from Limen)"]:::next
    end
    H --> CL
    CL --> PR
    CL --> GR
    classDef next stroke-dasharray: 5 5
The traps we already fell into
Every line below cost a bug in Limen. The library handles the ones it can; the others are here so you don't have to find them yourself.
| Trap | What happens | What to do |
|---|---|---|
No CUM1 |
asking for it gives an empty list, not an error | the shortest «Merging» is CUM3; for one hour use SRT1 |
| "Gone" looks like a crash | a frame older than ~5 months answers 500, with S3's 403 Forbidden in the body, not 404 |
is_expired(status, body): never retry those |
| The «Merging» disappears | the DPC keeps about five months, and there is no public archive of it | save the frames you need (the archive module is coming) |
| Two grids | SRI/SRT1 are 1 km in a Transverse Mercator projection; CUM* are 0.01° in EPSG:4326 |
never mix the arrays: reproject one onto the other |
| A corrupted series | in October 2026 every CUM24 frame at :30 carried a smooth bell of up to 20,584 mm over Abruzzo, for days (the :00 frames were right) | never trust one frame alone: compare it with its neighbours, and read a place with the median of the 3×3 pixels around it |
| Not every echo is rain | sea clutter or a radar with a problem can paint rain where there is none, often as a disk around one radar, and it can stay still for hours | a jump between frames does not catch it: see the benchmark |
| Radar alone is not the truth | the radar-only history read between 10 % and 80 % of the gauges in Apulia in 2016 | use the «Merging» when you can; compare on your area |
| Times are in UTC, in milliseconds | the API speaks epoch milliseconds | to_epoch_ms / from_epoch_ms, and always aware datetimes |
The origin header |
the API once refused requests without it; in November 2026 it no longer does | products.HEADERS sends it anyway |
Every trap above is a case in the benchmark:
real frames where we know the answer, and how each cleaning rule scores on
them. Limen's rule today passes 8 of 18 checks; a first frame-level check
(jump-sign) passes 17.
API at a glance
| Name | What it is |
|---|---|
RadarClient(client=None, send=None, retries=3) |
the client: async with, your httpx.AsyncClient or a send hook |
radar.latest(p, cached=None) |
the newest frame as a RainGrid; cached skips the download if it is still the newest |
radar.at(p, time) / radar.download(p, time) |
the frame issued at time as a grid / as GeoTIFF bytes, or ABSENT |
radar.last_product(p) |
time and period of the newest frame |
RainGrid |
one frame: product, time, data (NaN = no data), transform, crs |
grid.sample(points) |
the value at lon/lat points: median of the 3×3 pixels, None if not measured |
grid.peak(bbox, threshold=) / grid.crop(bbox) |
highest value and pixels above a threshold in a box / the box as a grid |
grid.check(previous, max_step=) |
FrameCheck(verdict, grid, jumps): whether to trust a frame, given the one before |
ABSENT |
a frame the DPC no longer keeps |
SRI, SRT1, CUM3, CUM6, CUM12, CUM24 |
the products: name, hours (None for an intensity), merging, description |
PRODUCTS, product(name) |
every product by name; product("cum24") → CUM24 |
products.last_product_url(p) |
URL and params of the "latest frame" request (a GET) |
products.download_url(), products.download_body(p, at) |
URL and JSON body of the "download link" request (a POST) |
parse_last_product(answer) |
LastProduct(product, time, period), or None if the API lists none |
parse_download(answer) |
the signed S3 link of a frame |
is_expired(status, body) |
True when the frame is gone for good |
products.HEADERS, products.NODATA |
the origin header; -9999.0, the no-data value of every product |
products.to_epoch_ms, from_epoch_ms, parse_period |
the API's times and periods (PT5M, PT30M) |
DpcRadarError |
an answer the library cannot read, or a bad argument |
Full reference: https://agentengineering.it/dpc-radar/api/client/
Roadmap, and where AI helps
The plan is on the roadmap and tracked in #10. Each idea is measured against one goal of Limen: anticipate within 72 hours 90 % of the events in the news, with at most 10 % of municipality-days on alert.
flowchart LR
    B["Benchmark<br/>known cases"] --> P0["Phase 0<br/>reliability map<br/>climatology<br/>storm catalogue"]
    P0 --> P1["Phase 1<br/>learned frame check"]
    P1 --> P2["Phase 2<br/>nowcasting<br/>radar–gauge bias"]
    P2 --> P3["Phase 3<br/>MCP · llms.txt<br/>event reports"]
    P0 & P1 & P2 & P3 -.-> L["Limen<br/>fewer false alarms ·<br/>more events anticipated"]
| Idea | In plain words | What Limen gains | Issue |
|---|---|---|---|
| Benchmark | a fixed set of storms and faults where we know the answer | every change measurable | #2 |
| Reliability map | where the radar sees well, and where it is blind | a blind spot is no longer read as "dry" | #3 |
| Rain climatology | how rare is this rain here, from 15 years of radar | alerts on unusual rain, not on one national threshold | #4 |
| Storm catalogue | every storm as an object, and the extreme ones as events to check in the news | many more verified events to measure against | #5 |
| Learned frame check | a model that tells a real storm from a broken frame or clutter | fewer false alarms | #6 |
| Nowcasting | the rain field moved forward along its motion, 0–2 hours | a trigger on rain that is coming | #7 |
| Radar–gauge bias | learn how wrong the radar alone is, and correct it | a history worth backtesting on | #8 |
| AI for agents | an MCP server, llms.txt, reports that cite their frames |
the same facts for Limen's assistant | #9 |
One rule holds for every AI feature: the numbers come from the frames, computed by tested code. A language model may read the news and explain the numbers, never invent them, and nothing here replaces the official DPC alert.
Contributing
Contributions of every size are welcome, from a typo to a new module. You don't need to be a meteorologist: most of the code is plain Python, HTTP and arrays.
git clone https://github.com/agent-engineering-studio/dpc-radar
cd dpc-radar
uv sync          # install everything, dev tools included
make check       # ruff + mypy --strict + pytest, the same gate as CI
make docs        # build this site locally
The tests need no network: they run against answers recorded from the real API.
dpc-radar/
├── src/dpc_radar/
│   ├── products.py   # products, requests, parsers, is_expired: pure functions
│   ├── grid.py       # RainGrid: read a frame, sample, peak, crop, check
│   ├── client.py     # RadarClient: latest, at, download, ABSENT
│   └── errors.py     # DpcRadarError
├── tests/            # offline: synthetic GeoTIFFs and a fake API
│   └── live/         # the same on the real API: uv run pytest -m live
├── benchmarks/       # known cases, and how each cleaning rule scores
└── docs/
    ├── make_images.py  # the images of this README, from real frames
    └── roadmap.md      # what comes next, and where AI helps
Good first issues: a notebook with a storm you remember, a recipe for your favourite HTTP library, a check of the radar against a rain gauge near you. See CONTRIBUTING.md.
Data licence and credits
- Radar data (SRI, SRT1, «Merging» CUM): © Dipartimento della Protezione Civile, open data under CC BY-SA 4.0. Credit the DPC and share data you derive from it under the same licence.
- Criticality bulletins: DPC, CC BY 4.0.
- IT-DPC-SRI (the 2010–2025 history, coming in the
historymodule): Fondazione Bruno Kessler on DPC data, CC BY-SA 4.0, doi:10.5281/zenodo.18637608. - Country borders in the images: Natural Earth, public domain.
This library is not affiliated with the DPC. It is not an alert system: for official warnings, see the DPC criticality bulletin and your regional civil protection.
The code is released under the Apache-2.0 licence.
1 maintainer

Metadata
1 maintainer
Release files for dpc-radar 0.1.0
For a detailed explanation of source distributions (sdists) and built distributions (wheels), please see the package formats documentation.
Source distribution (sdist)
| File | Size | Uploaded | Provenance | Actions |
|---|---|---|---|---|
| dpc_radar-0.1.0.tar.gz | 30.4 kB | With provenance | Details for dpc_radar-0.1.0.tar.gz |
Built distribution (wheel)
| File | Interpreter | ABI | Platform | Actions Reset |
|---|---|---|---|---|
| dpc_radar-0.1.0-py3-none-any.whl | Python 3 | none | any | Details for dpc_radar-0.1.0-py3-none-any.whl |
Total release size: 54.3 kB
Release files / dpc_radar-0.1.0.tar.gz
| Download URL | dpc_radar-0.1.0.tar.gz |
|---|---|
| Size | 30.4 kB |
| Tags | Source |
|
SHA-256 checksum How to use checksums |
0d399a2c81fc7090378b8bd17d48dbb3df357209ebd8290fbcc126327ff962d1
|
|
BLAKE2b-256 checksum How to use checksums |
0efa0da18c8cefc1fd0c8b1c0f96058104e6bfb6df9cd7baae3f9bca7641be29
|
| Upload date | |
|
Uploaded using Trusted Publishing? What is trusted publishing? |
Yes |
| Uploaded via |
twine/7.0.0 CPython/3.13.16
|
Provenance
Provenance describes where a file came from. On PyPI, provenance is shared via attestations, which provide a verifiable record of the build or publishing details. View details, limitations and caveats.


PyPI Publish Attestation
PyPI verified that this artifact, at this checksum, originated from the publisher listed below.
Signed by GitHub Actions, verified by PyPI on Nov 4, 2026.
Transparency logRelease files / dpc_radar-0.1.0-py3-none-any.whl
| Download URL | dpc_radar-0.1.0-py3-none-any.whl |
|---|---|
| Size | 23.9 kB |
| Tags | Python 3 |
|
SHA-256 checksum How to use checksums |
143010f9c1d0e67aafdf92327a6ba869b04fd5569814eadf7f4e0bc214b5683d
|
|
BLAKE2b-256 checksum How to use checksums |
5f48e1b4dd2e565d26dacbdd40646761ca0e4b047407782cbfa45e8e10c414bc
|
| Upload date | |
|
Uploaded using Trusted Publishing? What is trusted publishing? |
Yes |
| Uploaded via |
twine/7.0.0 CPython/3.13.16
|
Provenance
Provenance describes where a file came from. On PyPI, provenance is shared via attestations, which provide a verifiable record of the build or publishing details. View details, limitations and caveats.
PyPI Publish Attestation
PyPI verified that this artifact, at this checksum, originated from the publisher listed below.
Signed by GitHub Actions, verified by PyPI on Nov 4, 2026.
Transparency logSecurity for dpc-radar 0.1.0
Provenance
Provenance describes where a file came from. On PyPI, provenance is shared via attestations, which provide a verifiable record of the build or publishing details. View details, limitations and caveats.
Full provenance
Both files in this release have been uploaded with provenance metadata.
Attestation for dpc_radar-0.1.0.tar.gz
PyPI Publish Attestation
PyPI verified that this artifact, at this checksum, originated from the publisher listed below.
Signed by GitHub Actions, verified by PyPI on Nov 4, 2026.
Transparency logA note on package security
PyPI is a repository for distributing packages, not a service for auditing them. While third-party security researchers and our staff do their best to detect and remove malicious packages, PyPI cannot guarantee the quality, security or suitability of any given package.
To learn more about protecting yourself from malicious actors, visit our package security documentation.














