A Python library for extracting Decision Predicate Graphs and global explanations from ensemble models.


Project description
Decision Predicate Graph (DPG)


DPG is a model-agnostic framework for global and local explanation of tree-based ensemble models. It turns ensemble decision logic into a graph so users can inspect predicates, transitions, predictions, and structural explanation diagnostics in a single representation.
DPG is a graph structure that captures the tree-based ensemble model and learned dataset details, preserving the relations among features, logical decisions, and predictions towards emphasising insightful points. DPG enables graph-based evaluations and the identification of model decisions towards facilitating comparisons between features and their associated values while offering insights into the entire model. DPG provides descriptive metrics that enhance the understanding of the decisions inherent in the model, offering valuable insights.

At a glance
- High-level API for global and local explanation with
DPGExplainer - Graph-based metrics such as constraints, betweenness centrality, and local reaching centrality
- Local path inspection, local-on-global visualization, and faithfulness diagnostics
- Lightweight experiment runners and analysis utilities for sklearn datasets
Quick links
- Installation: Installation
- High-level usage: High-level usage
- Local explanations: Local explanations
- Faithfulness evaluation: Faithfulness evaluation
- Visualizations: https://dpg.readthedocs.io/en/latest/visualization.html
- CLI usage and gallery examples: CLI scripts
- Full docs: https://dpg.readthedocs.io/
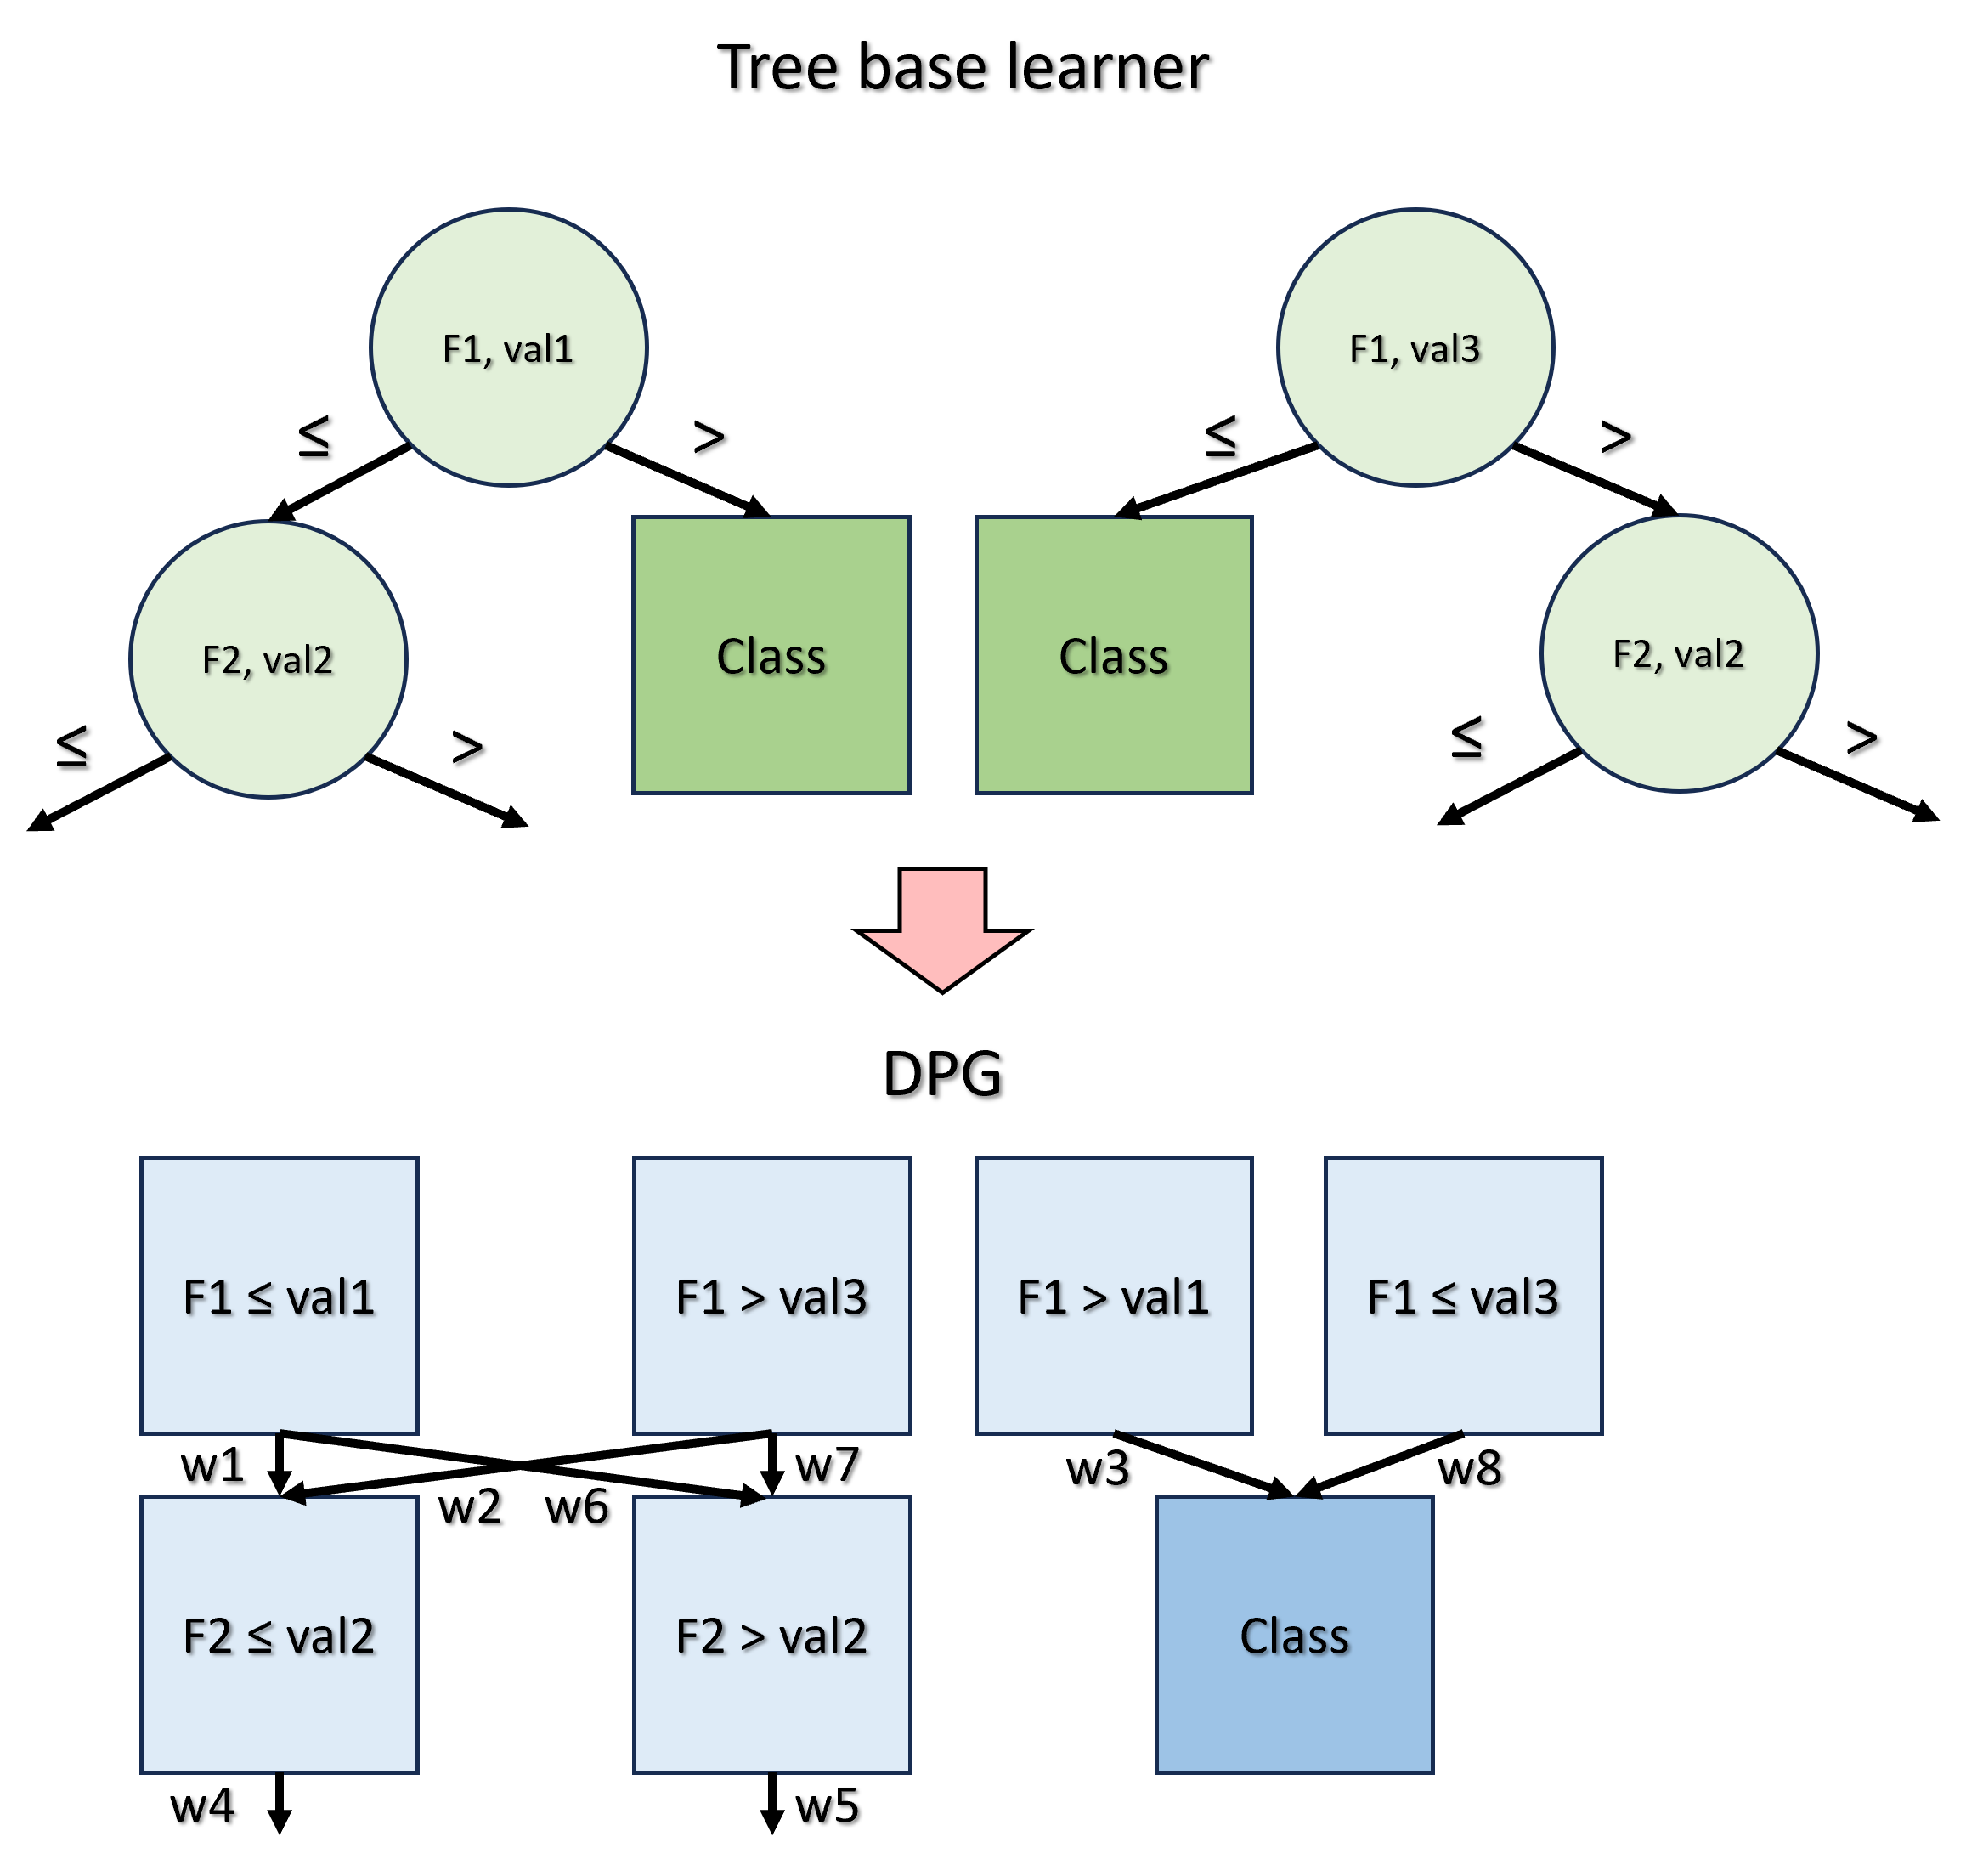
How DPG works
The concept behind DPG is to convert a generic tree-based ensemble model for classification into a graph, where:
- Nodes represent predicates, i.e., the feature-value associations present in each node of every tree;
- Edges denote the frequency with which these predicates are satisfied during the model training phase by the samples of the dataset.
Metrics
The graph-based nature of DPG provides significant enhancements in the direction of a complete mapping of the ensemble structure.
| Property | Definition | Utility |
|---|---|---|
| Constraints | The intervals of values for each feature obtained from all predicates connected by a path that culminates in a given class. | Calculate the classification boundary values of each feature associated with each class. |
| Betweenness centrality | Quantifies the fraction of all the shortest paths between every pair of nodes of the graph passing through the considered node. | Identify potential bottleneck nodes that correspond to crucial decisions. |
| Local reaching centrality | Quantifies the proportion of other nodes reachable from the local node through its outgoing edges. | Assess the importance of nodes similarly to feature importance, but enrich the information by encompassing the values associated with features across all decisions. |
| Community | A subset of nodes of the DPG which is characterised by dense interconnections between its elements and sparse connections with the other nodes of the DPG that do not belong to the community. | Understanding the characteristics of nodes to be assigned to a particular community class, identifying predominant predicates, and those that play a marginal role in the classification process. |
| Constraints | Betweenness centrality | Local reaching centrality | Community |
|---|---|---|---|
 |
 |
 |
 |
| Constraints(Class 1) = val3 < F1 ≤ val1, F2 ≤ val2 | BC(F2 ≤ val2) = 4/24 | LRC(F1 ≤ val1) = 6 / 7 | Community(Class 1) = F1 ≤ val1, F2 ≤ val2 |
Installation
Install the package from PyPI:
pip install dpg
DPG requires Python 3.10+.
If you want graph rendering, install the system Graphviz package as well so the
dot executable is available on your PATH:
- macOS (Homebrew):
brew install graphviz - Ubuntu/Debian:
sudo apt-get install graphviz - Windows (winget):
winget install Graphviz.Graphviz
For local development installs, editable mode, and documentation builds, see docs/README.md.
Documentation
For full documentation, visit https://dpg.readthedocs.io/.
To build and serve documentation locally, see docs/README.md.
Practitioner-focused benchmark material for perc_var and decimal_threshold is available in
tutorials/parameter_sensitivity_benchmark/README.md.
High-level usage
Here is a minimal high-level example:
import pandas as pd
import numpy as np
from sklearn.ensemble import RandomForestClassifier, GradientBoostingClassifier
from dpg import DPGExplainer

# Load dataset (last column assumed to be target)
df = pd.read_csv("datasets/custom.csv", index_col=0)
X = df.iloc[:, :-1]
y = df.iloc[:, -1]

# Train a classifier (supports RandomForest, GradientBoosting, AdaBoost, ExtraTree, and more)
model = RandomForestClassifier(n_estimators=10, random_state=27)
# or: model = GradientBoostingClassifier(n_estimators=10, random_state=27)
model.fit(X, y)

# Build the DPG and extract global explanations
explainer = DPGExplainer(
    model=model,
    feature_names=X.columns,
    target_names=np.unique(y).astype(str).tolist(),
)
explanation = explainer.explain_global(X.values, communities=True)

# Render the graph to disk
explainer.plot("dpg_output", explanation, save_dir="datasets", export_pdf=True)
explainer.plot_communities("dpg_output", explanation, save_dir="datasets", export_pdf=True)
Common workflows
The high-level API is designed to return structured outputs so downstream tools can use them directly.
DPGExplainer.fit(X): builds the DPG structureDPGExplainer.explain_global(X=None, communities=False, community_threshold=0.2): returns aDPGExplanationDPGExplainer.explain_local(sample, sample_id=0, X=None, validate_graph=True): returns aDPGLocalExplanationDPGExplainer.local_path_dataframe(local_explanation): flattens local paths into a tabular viewDPGExplainer.plot(...): renders the standard DPGDPGExplainer.plot_communities(...): renders a community-colored DPGDPGExplainer.plot_local_on_dpg(...): overlays one sample's local paths on the fitted DPGDPGExplainer.evaluate_faithfulness(...): summarizes local explanation fidelity and structural faithfulness over a dataset
DPGExplanation includes dot, graph, nodes, node_metrics, edge_metrics, class_boundaries, and optional communities.
Local explanations
DPG also supports sample-level explanations on top of the fitted global graph.
Graph construction modes
You can control how the graph is built through dpg.graph_construction.mode:
from dpg import DPGExplainer

explainer = DPGExplainer(
    model=model,
    feature_names=X.columns.tolist(),
    target_names=class_names,
    dpg_config={
        "dpg": {
            "default": {
                "perc_var": 1e-9,
                "decimal_threshold": 6,
                "n_jobs": -1,
            },
            "graph_construction": {
                "mode": "execution_trace",  # or "aggregated_transitions"
            },
        }
    },
)
"aggregated_transitions": current default behavior; filters path variants first, then discovers the DPG."execution_trace": builds directly from raw traces and filters edges instead of whole-path variants whenperc_var > 0.
Minimal local workflow
from sklearn.datasets import load_iris
from sklearn.ensemble import RandomForestClassifier
from dpg import DPGExplainer
import numpy as np

X, y = load_iris(return_X_y=True, as_frame=True)
model = RandomForestClassifier(n_estimators=5, random_state=42).fit(X, y)

explainer = DPGExplainer(
    model=model,
    feature_names=X.columns.tolist(),
    target_names=np.unique(y).astype(str).tolist(),
)
explainer.fit(X.values)

local = explainer.explain_local(sample=X.iloc[0].values, sample_id=0)

print(local.majority_vote)
print(local.class_votes)
print(local.sample_confidence)

df_local = explainer.local_path_dataframe(local)
print(df_local.head())
local.tree_paths[*].labels stay in DPG label format such as "sepal width (cm) <= 3.0" and "Class 0".
For easier aggregation, local.class_votes and local.majority_vote use normalized class names such as "0" instead of "Class 0".
Local plotting
explainer.plot_local_on_dpg(
    "iris_local_sample0",
    local_explanation=local,
    true_class_label=str(y.iloc[0]),
    save_dir="results/",
    theme="dpg",
    palette="olive",
    layout_template="vertical",
    show=False,
)
A runnable example is available at examples/local_explanation_iris.py.
Faithfulness evaluation
You can also evaluate local explanations against the fitted black-box model:
details = explainer.evaluate_faithfulness(
    X_test,
    y_true=y_test,
    return_details=True,
)

print(details["faithfulness_score"])
print(details["output_fidelity"])
print(details["mean_trace_coverage_score"])
print(details["mean_recombination_rate"])
This reports:
output_fidelity: agreement between the local explanation and the black-box model- structural metrics such as trace coverage and recombination
- semantic metrics such as evidence margin
- a composite
faithfulness_score
Important:
- the composite score is a heuristic summary, not a calibrated probability
output_fidelityis model agreement, not ground-truth correctnesslocal_accuracyis only reported wheny_trueis provided- structural faithfulness here means recovering the executed decision traces used by the model
Runnable examples
CLI scripts
The library contains two different scripts to apply DPG:
run_dpg_standard.py: with this script it is possible to test DPG on a standard classification dataset provided bysklearnsuch asiris,digits,wine,breast cancer, anddiabetes.run_dpg_custom.py: with this script it is possible to apply DPG to your classification dataset, specifying the target class.
Implementation notes
The library also contains two other essential scripts:
core.pycontains all the functions used to calculate and create the DPG and the metrics.visualizer.pycontains the functions used to manage the visualization of DPG.
Output
The DPG output, through run_dpg_standard.py or run_dpg_custom.py, produces several files:
- the visualization of DPG in a dedicated environment, which can be zoomed and saved;
- a
.txtfile containing the DPG metrics; - a
.csvfile containing the information about all the nodes of the DPG and their associated metrics; - a
.txtfile containing the Random Forest statistics (accuracy, confusion matrix, classification report)
CLI parameter reference
Usage: python run_dpg_standard.py --dataset <dataset_name> --n_learners <integer_number> --pv <threshold_value> --t <integer_number> --model_name <str_model_name> --dir <save_dir_path> --plot --save_plot_dir <save_plot_dir_path> --attribute <attribute> --communities --clusters --threshold_clusters <float> --class_flag --seed <int>
Where:
datasetis the name of the standard classificationsklearndataset to be analyzed;n_learnersis the number of base learners for the ensemble model;pvis the threshold value indicating the desire to retain only those paths that occur with a frequency exceeding a specified proportion across the trees;tis the decimal precision of each feature;model_nameis the name of thesklearnmodel chosen to perform classification. Supported models include:RandomForestClassifier(default)GradientBoostingClassifier(new!)RandomForestRegressorGradientBoostingRegressorExtraTreesClassifierAdaBoostClassifierAdaBoostRegressorBaggingClassifier
diris the path of the directory to save the files;plotis a store_true variable which can be added to plot the DPG;save_plot_diris the path of the directory to save the plot image;attributeis the specific node metric which can be visualized on the DPG;communitiesis a store_true variable which can be added to visualize communities on the DPG;clustersis a store_true variable which can be added to visualize clusters on the DPG;threshold_clustersis the threshold used to detect ambiguous nodes in clusters;class_flagis a store_true variable which can be added to highlight class nodes;seedcontrols the random split.
Disclaimer: attribute, communities, and clusters are mutually exclusive: DPG supports just one visualization mode at a time.
The usage of run_dpg_custom.py is similar, but it requires another parameter:
target_column, which is the name of the column to be used as the target variable;- while
dsis the path of the directory where the dataset is.
Example run_dpg_standard.py
Some examples can be appreciated in the examples folder: https://github.com/Meta-Group/DPG/tree/main/examples
In particular, the following DPG is obtained by transforming a Random Forest with 5 base learners, trained on Iris dataset.
The used command is python run_dpg_standard.py --dataset iris --n_learners 5 --pv 0.001 --t 2 --dir examples --plot --save_plot_dir examples.

The following visualizations are obtained using the same parameters as the previous example, but they show two different metrics: Community and Betweenness centrality.
The used command for showing communities is python run_dpg_standard.py --dataset iris --n_learners 5 --pv 0.001 --t 2 --dir examples --plot --save_plot_dir examples --communities.

The used command for showing a specific property is python run_dpg_standard.py --dataset iris --n_learners 5 --pv 0.001 --t 2 --dir examples --plot --save_plot_dir examples --attribute "Betweenness centrality" --class_flag.

Citation
If you use this for research, please cite. Here is an example BibTeX entry:
@inproceedings{arrighi2024dpg,
  title={Decision Predicate Graphs: Enhancing Interpretability in Tree Ensembles},
  author={Arrighi, Leonardo and Pennella, Luca and Marques Tavares, Gabriel and Barbon Junior, Sylvio},
  booktitle={World Conference on Explainable Artificial Intelligence},
  pages={311--332},
  year={2024},
  isbn = {978-3-031-63797-1},
  doi = {10.1007/978-3-031-63797-1_16},
  publisher = {Springer Nature Switzerland},
}
Release history Release notifications | RSS feed


Download files
Download the file for your platform. If you're not sure which to choose, learn more about installing packages.
Source Distribution
Built Distribution
Filter files by name, interpreter, ABI, and platform.
If you're not sure about the file name format, learn more about wheel file names.
Copy a direct link to the current filters
File details
Details for the file dpg-0.1.6.tar.gz.
File metadata
- Download URL: dpg-0.1.6.tar.gz
- Upload date:
- Size: 61.8 kB
- Tags: Source
- Uploaded using Trusted Publishing? No
- Uploaded via: poetry/2.4.0 CPython/3.13.5 Linux/6.17.2-1-pve
File hashes
| Algorithm | Hash digest | |
|---|---|---|
| SHA256 |
7a0ec2e980ae55d41e899eac8ae317272f8bfdb86c7770383484f9181ba3914b
|
|
| MD5 |
0ca275b99ce0468251682a7ce8fa04e7
|
|
| BLAKE2b-256 |
018c51e9cea6dfdb3e408210cc9b87a85f3daef1d3880fbee6333e74975c4223
|
File details
Details for the file dpg-0.1.6-py3-none-any.whl.
File metadata
- Download URL: dpg-0.1.6-py3-none-any.whl
- Upload date:
- Size: 61.6 kB
- Tags: Python 3
- Uploaded using Trusted Publishing? No
- Uploaded via: poetry/2.4.0 CPython/3.13.5 Linux/6.17.2-1-pve
File hashes
| Algorithm | Hash digest | |
|---|---|---|
| SHA256 |
efea62cd8ea4790cd264ef511eaddf139960bb5cfd88d59b2521b8499463348e
|
|
| MD5 |
ec434ac10ee0a704a4a410c376520965
|
|
| BLAKE2b-256 |
93be7668070b497867c3c9e8ff531344feb0550ded258944a4cd68fcab7fa535
|


