Combines plotnine and dppd
Verified details
These details have been verified by PyPIProject links
GitHub Statistics
Maintainers

Project description
dppd_plotnine
| Build status: |  |
|---|---|
| Documentation | https://dppd_plotnine.readthedocs.io/en/latest/ |
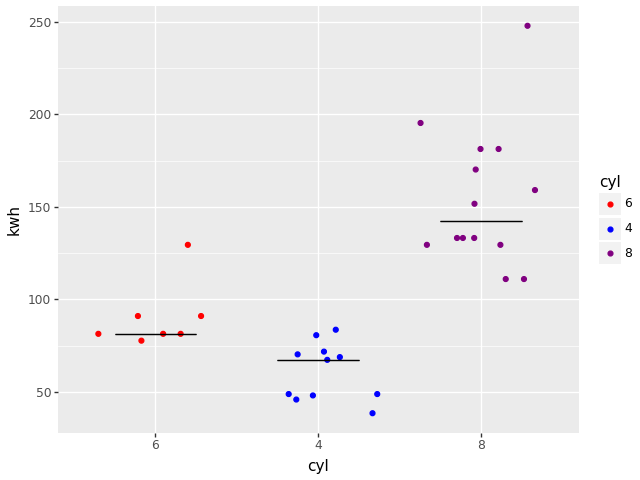
dppd_plotnine combines the power of plotnine and dppd
It allows you to use code like this
   import numpy as np
   from dppd import dppd
   import dppd_plotnine
   from plotnine.data import mtcars
   import plotnine as p9
   dp, X = dppd()

   plot = (
      dp(mtcars)
      .assign(kwh=X.hp * 0.74)
      .categorize("cyl")
      .p9()
      .add_point(
            "cyl",
            "kwh",
            color="cyl",
            position=p9.position_jitter(height=0, random_state=500),
      )
      .add_errorbar(
            x="cyl",
            y="kwh_median",
            ymin="kwh_median",
            ymax="kwh_median",
            data=dp(X.data)
            .groupby("cyl")
            .summarize(("kwh", np.median, "kwh_median"))
            .pd,
      )
      .scale_color_manual(
            ["red", "blue", "purple"]
      )  # after pd, X is what it was before
      .pd
    )
    plot.save("test.png")
Please see our full documentation at https://dppd_plotnine.readthedocs.io/en/latest/ for more details of the straight and enhanced plotnine mappings available.
Project details
Verified details
These details have been verified by PyPIProject links
GitHub Statistics
Maintainers
Release history Release notifications | RSS feed


Download files
Download the file for your platform. If you're not sure which to choose, learn more about installing packages.
Source Distribution
dppd_plotnine-0.2.9.tar.gz
(13.5 kB
view details)
File details
Details for the file dppd_plotnine-0.2.9.tar.gz.
File metadata
- Download URL: dppd_plotnine-0.2.9.tar.gz
- Upload date:
- Size: 13.5 kB
- Tags: Source
- Uploaded using Trusted Publishing? Yes
- Uploaded via: twine/6.1.0 CPython/3.12.9
File hashes
| Algorithm | Hash digest | |
|---|---|---|
| SHA256 |
528fde073c4b7cb7b82affe864ac028709c12d933b558ff518613366a985794d
|
|
| MD5 |
e7d19d99d31751b1e42e1ed0284285ce
|
|
| BLAKE2b-256 |
d09836f2ad0067a722b68ebff2f02fcee8fce51006b0992fc0f61001511a49c3
|
Provenance
The following attestation bundles were made for dppd_plotnine-0.2.9.tar.gz:
Publisher:
pytest.yml on TyberiusPrime/dppd_plotnine
-
Statement:
-
Statement type:
https://in-toto.io/Statement/v1 -
Predicate type:
https://docs.pypi.org/attestations/publish/v1 -
Subject name:
dppd_plotnine-0.2.9.tar.gz -
Subject digest:
528fde073c4b7cb7b82affe864ac028709c12d933b558ff518613366a985794d - Sigstore transparency entry: 219998117
- Sigstore integration time:
-
Permalink:
TyberiusPrime/dppd_plotnine@4f6783a4ad99271fcb5d8da7da4f12b8b48d467b -
Branch / Tag:
refs/tags/v0.2.10 - Owner: https://github.com/TyberiusPrime
-
Access:
public
-
Token Issuer:
https://token.actions.githubusercontent.com -
Runner Environment:
github-hosted -
Publication workflow:
pytest.yml@4f6783a4ad99271fcb5d8da7da4f12b8b48d467b -
Trigger Event:
release
-
Statement type:


