A data logger specializing in reading an array of DS18B20 sensors.

Project description
ds18b20-datalogger
A data logger specializing in reading an array of DS18B20 sensors.
A temperature sensor matrix with heatmap visualization for bee hive monitoring, using Raspberry Pi, Linux, Python, DS18B20, MQTT, Kotori DAQ, and Grafana.
| View from outside | View from inside (sensor tip details) |
|---|---|
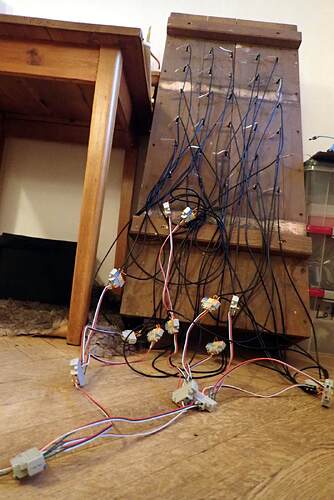 |
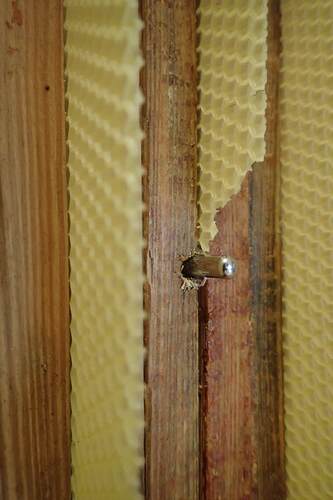 |
Lab protocol and development details: https://community.hiveeyes.org/t/laborprotokoll-4x5-temp-matrix-mit-ds18b20/5102
Project Information
» Documentation | Changelog | PyPI | Issues | Source code | License


What's Inside
- The
ds18b20-dataloggerprogram, reading DS18B20 sensors and publishing readings to MQTT in JSON format. - Configuration file in YAML format, like
datalogger.yaml. - JSON representation for a corresponding Grafana Dashboard
grafana-dashboard.json, when measurement data is submitted and acquired through Kotori DAQ.
Synopsis
Acquire single reading, and echo it on STDOUT in JSON format.
ds18b20-datalogger read datalogger.yaml
Take a single reading, and publish it to the configured MQTT topic.
ds18b20-datalogger run datalogger.yaml
Live
In order to see a running system in action, please enjoy inspecting the Live Grafana Dashboard.
Installation
Install the ds18b20-datalogger package from PyPI using pip.
pip install --upgrade ds18b20-datalogger
See also alternative installation methods and hands-on walkthroughs at development sandbox and production setup.
Configuration
In order to operate the data logger successfully, you will need to configure two important details:
- Sensors: Map one-wire sensor sysfs paths to self-assigned sensor names.
- Telemetry: Adjust MQTT connection settings and MQTT topic.
You can create a blueprint configuration file by using the make-config
subcommand.
ds18b20-datalogger make-config > datalogger.yaml
Appliance: Sensor Wiring and Sensor Mapping
Be aware that you might have to adjust your resistors size. With 30 sensors i had erratic sensor mapping using a 4.7k resistor. I am getting valid mapping using a 2.2k resistor.
Please read more about sensor mapping on our community forum. In practice,
just edit the one-wire section within the configuration file according to
your setup.
Backend: Telemetry and Visualization
The data logger will publish measurements to an MQTT topic, where Kotori DAQ can pick it up, in order to converge into a timeseries database, and displays it on a Grafana Dashboard.
The package includes a corresponding Grafana Dashboard, which can be created
by invoking the make-dashboard subcommand.
ds18b20-datalogger make-dashboard > dashboard.json
On our community forum, you can find relevant discussions about this topic.
Acknowledgements
The original code of this implementation has been discovered on the element14 community forum at Multiple DS18B20 Temp sensors interfacing with Raspberry Pi, shared by @laluha. Thanks!
Contributing
In order to learn how to start hacking on this program, please have a look at the documentation about how to install a development sandbox.
Contributions of any kind are always welcome and appreciated. Thank you.
Release history Release notifications | RSS feed


Download files
Download the file for your platform. If you're not sure which to choose, learn more about installing packages.
Source Distribution
Built Distribution
Filter files by name, interpreter, ABI, and platform.
If you're not sure about the file name format, learn more about wheel file names.
Copy a direct link to the current filters
File details
Details for the file ds18b20_datalogger-0.0.4.tar.gz.
File metadata
- Download URL: ds18b20_datalogger-0.0.4.tar.gz
- Upload date:
- Size: 64.2 kB
- Tags: Source
- Uploaded using Trusted Publishing? No
- Uploaded via: twine/5.0.0 CPython/3.12.2
File hashes
| Algorithm | Hash digest | |
|---|---|---|
| SHA256 |
0931d9bdd61430f20f68c08bcd2b865aa3bf2c86a4c7a5338d896bad1e0b0030
|
|
| MD5 |
65a65cd346f7fc36abd0fba5e3c9a744
|
|
| BLAKE2b-256 |
e47c55fc71b163074aee6437fa1d9eb7845d14b2aa145671e8a4dc2d00e65586
|
File details
Details for the file ds18b20_datalogger-0.0.4-py3-none-any.whl.
File metadata
- Download URL: ds18b20_datalogger-0.0.4-py3-none-any.whl
- Upload date:
- Size: 48.4 kB
- Tags: Python 3
- Uploaded using Trusted Publishing? No
- Uploaded via: twine/5.0.0 CPython/3.12.2
File hashes
| Algorithm | Hash digest | |
|---|---|---|
| SHA256 |
48f371e2dfb03d809a1465f21c1d30568c08c6a680339c840c8baf6aabb8eb53
|
|
| MD5 |
35ae74f47c5ab0b269d12a5316c406c2
|
|
| BLAKE2b-256 |
88f32cb53829c07e71bd734a7e80f0ca1f8f5274cde93a1bf1f8a4b4abb39f8a
|


