A Prometheus metrics exporter for the dump1090 Mode S decoder for RTLSDR

Project description
dump1090 Exporter
Dump1090 is a simple Mode S decoder for RTLSDR devices that is commonly used for tracking aircraft. Dump1090 makes a number of operating metrics available to track the performance of the tool and its environment.
The dump1090exporter collects statistics from dump1090 and exposes it to the Prometheus monitoring server for aggregation and later visualisation (e.g. using Grafana).
This exporter has been reported to work with:
- the dump1090 mutability fork
- the dump1090-fa fork
- readsb
Install
The dump1090 exporter is implemented as a Python3.6+ package that can be installed using the Python package manager pip. It is recommended to install this package into a virtual environment.
$ pip install dump1090exporter
The package can optionally make use of the uvloop package which provides a more efficient implementation of the asyncio event loop.
$ pip install dump1090exporter[uvloop]
The dump1090exporter has also been packaged into a Docker container. See the Docker section below for more details about that.
Run
The dump1090 exporter can be run from the command line using the console entry point script configured as part of the installation.
The dump1090 exporter accepts a number of command line arguments which can be displayed using the standard command line help request.
$ dump1090exporter -h
An example usage is shown below.
$ dump1090exporter \
  --resource-path=http://192.168.1.201:8080/data \
  --port=9105 \
  --latitude=-34.9285 \
  --longitude=138.6007 \
  --log-level info
The --resource-path argument defines the common base path to the various
dump1090 resources used by the exporter. The resource path can be a URL or a
file system location.
In the example command the exporter is instructed to monitor a dump1090 instance running on a machine with the IP address 192.168.1.201 using the port 8080.
The dump1090exporter can also monitor dump1090 state via the file system if
you run it on the same machine as the dump1090 process. In this scenario you
would pass a file system path to the --resource-path command line argument.
For example:
$ dump1090exporter \
  --resource-path=/path/to/dump1090-base-dir/data \
  ...
A more concrete example for dump1090-fa would be:
$ dump1090exporter \
  --resource-path=/run/dump1090-fa/ \
  ...
The exporter uses the resources-path value to construct the following
resources:
- {resource-path}/receiver.json
- {resource-path}/aircraft.json
- {resource-path}/stats.json
Receiver data is read from {resource-path}/receiver.json every 10 seconds
until a location can be obtained. Once a location has been read from the
resource then it is only polled every 300 seconds. However, in most cases the
dump1090 tool is not configured with the receivers position.
Aircraft data is read from {resource-path}/aircraft.json every 10 seconds.
This can be modified by specifying a new value with the --aircraft-interval
argument.
Statistics data is read from {resource-path}/stats.json every 60 seconds,
as the primary metrics being exported are extracted from the last1min time
period. This too can be modified by specifying an alternative value with the
--stats-interval argument.
The example command uses the --port argument to instruct the exporter to
exposes a metrics service on port 9105. This is where Prometheus would scrape
the metrics from. By default the port is configured to use 9105 so it only
needs to be specified if you want to change the port to a different value.
The example command uses the --latitude and --longitude arguments
to instruct the exporter to use a specific receiver origin (lat, lon). By
providing the exporter with the receiver's location it can calculate ranges
to aircraft. Note that if the receiver position is set within the dump1090
tool (and accessible from the {resource-path}/receivers.json resource)
then the exporter will use that data as the origin.
The metrics that the dump1090 exporter provides to Prometheus can be accessed for debug and viewing using curl or a browser by fetching from the metrics route url. For example:
$ curl -s http://0.0.0.0:9105/metrics | grep -v "#"
dump1090_aircraft_recent_max_range{time_period="latest"} 1959.0337385807418
dump1090_messages_total{time_period="latest"} 90741
dump1090_recent_aircraft_observed{time_period="latest"} 4
dump1090_recent_aircraft_with_multilateration{time_period="latest"} 0
dump1090_recent_aircraft_with_position{time_period="latest"} 1
dump1090_stats_cpr_airborne{time_period="last1min"} 176
dump1090_stats_cpr_airborne{time_period="total"} 18293
...
The metrics exposed by the dump1090-exporter are all prefixed with the dump1090_ string so as to provide a helpful namespacing which makes them easier to find in visualisation tools such as Grafana.
The exporter exposes generalised metrics for statistics and uses the multi dimensional label capability of Prometheus metrics to include information about which group the metric is part of.
To extract information for the peak signal metric that dump1090 aggregated
over the last 1 minute you would specify the time_period for that group:
dump1090_stats_local_peak_signal{job="dump1090", time_period="last1min"}
In the stats.json data there are 5 top level keys that contain statistics
for a different time period, defined by the "start" and "end" subkeys. The top
level keys are:
- latest which covers the time between the end of the "last1min" period and the current time. In my dump1090 setup this is always empty.
- last1min which covers a recent 1-minute period. This may be up to 1 minute out of date (i.e. "end" may be up to 1 minute old)
- last5min which covers a recent 5-minute period. As above, this may be up to 1 minute out of date.
- last15min which covers a recent 15-minute period. As above, this may be up to 1 minute out of date.
- total which covers the entire period from when dump1090 was started up to the current time.
By default only the last1min time period is exported as Prometheus can be used for accessing historical data.
Prometheus Configuration
Prometheus needs to be told where to fetch the dump1090 metrics from. The Prometheus configuration file should be updated with a new entry under the 'scrape_configs' block, that looks something like this:
scrape_configs:
  - job_name: 'dump1090'
    scrape_interval: 10s
    scrape_timeout: 5s
    static_configs:
      - targets: ['192.168.1.201:9105']
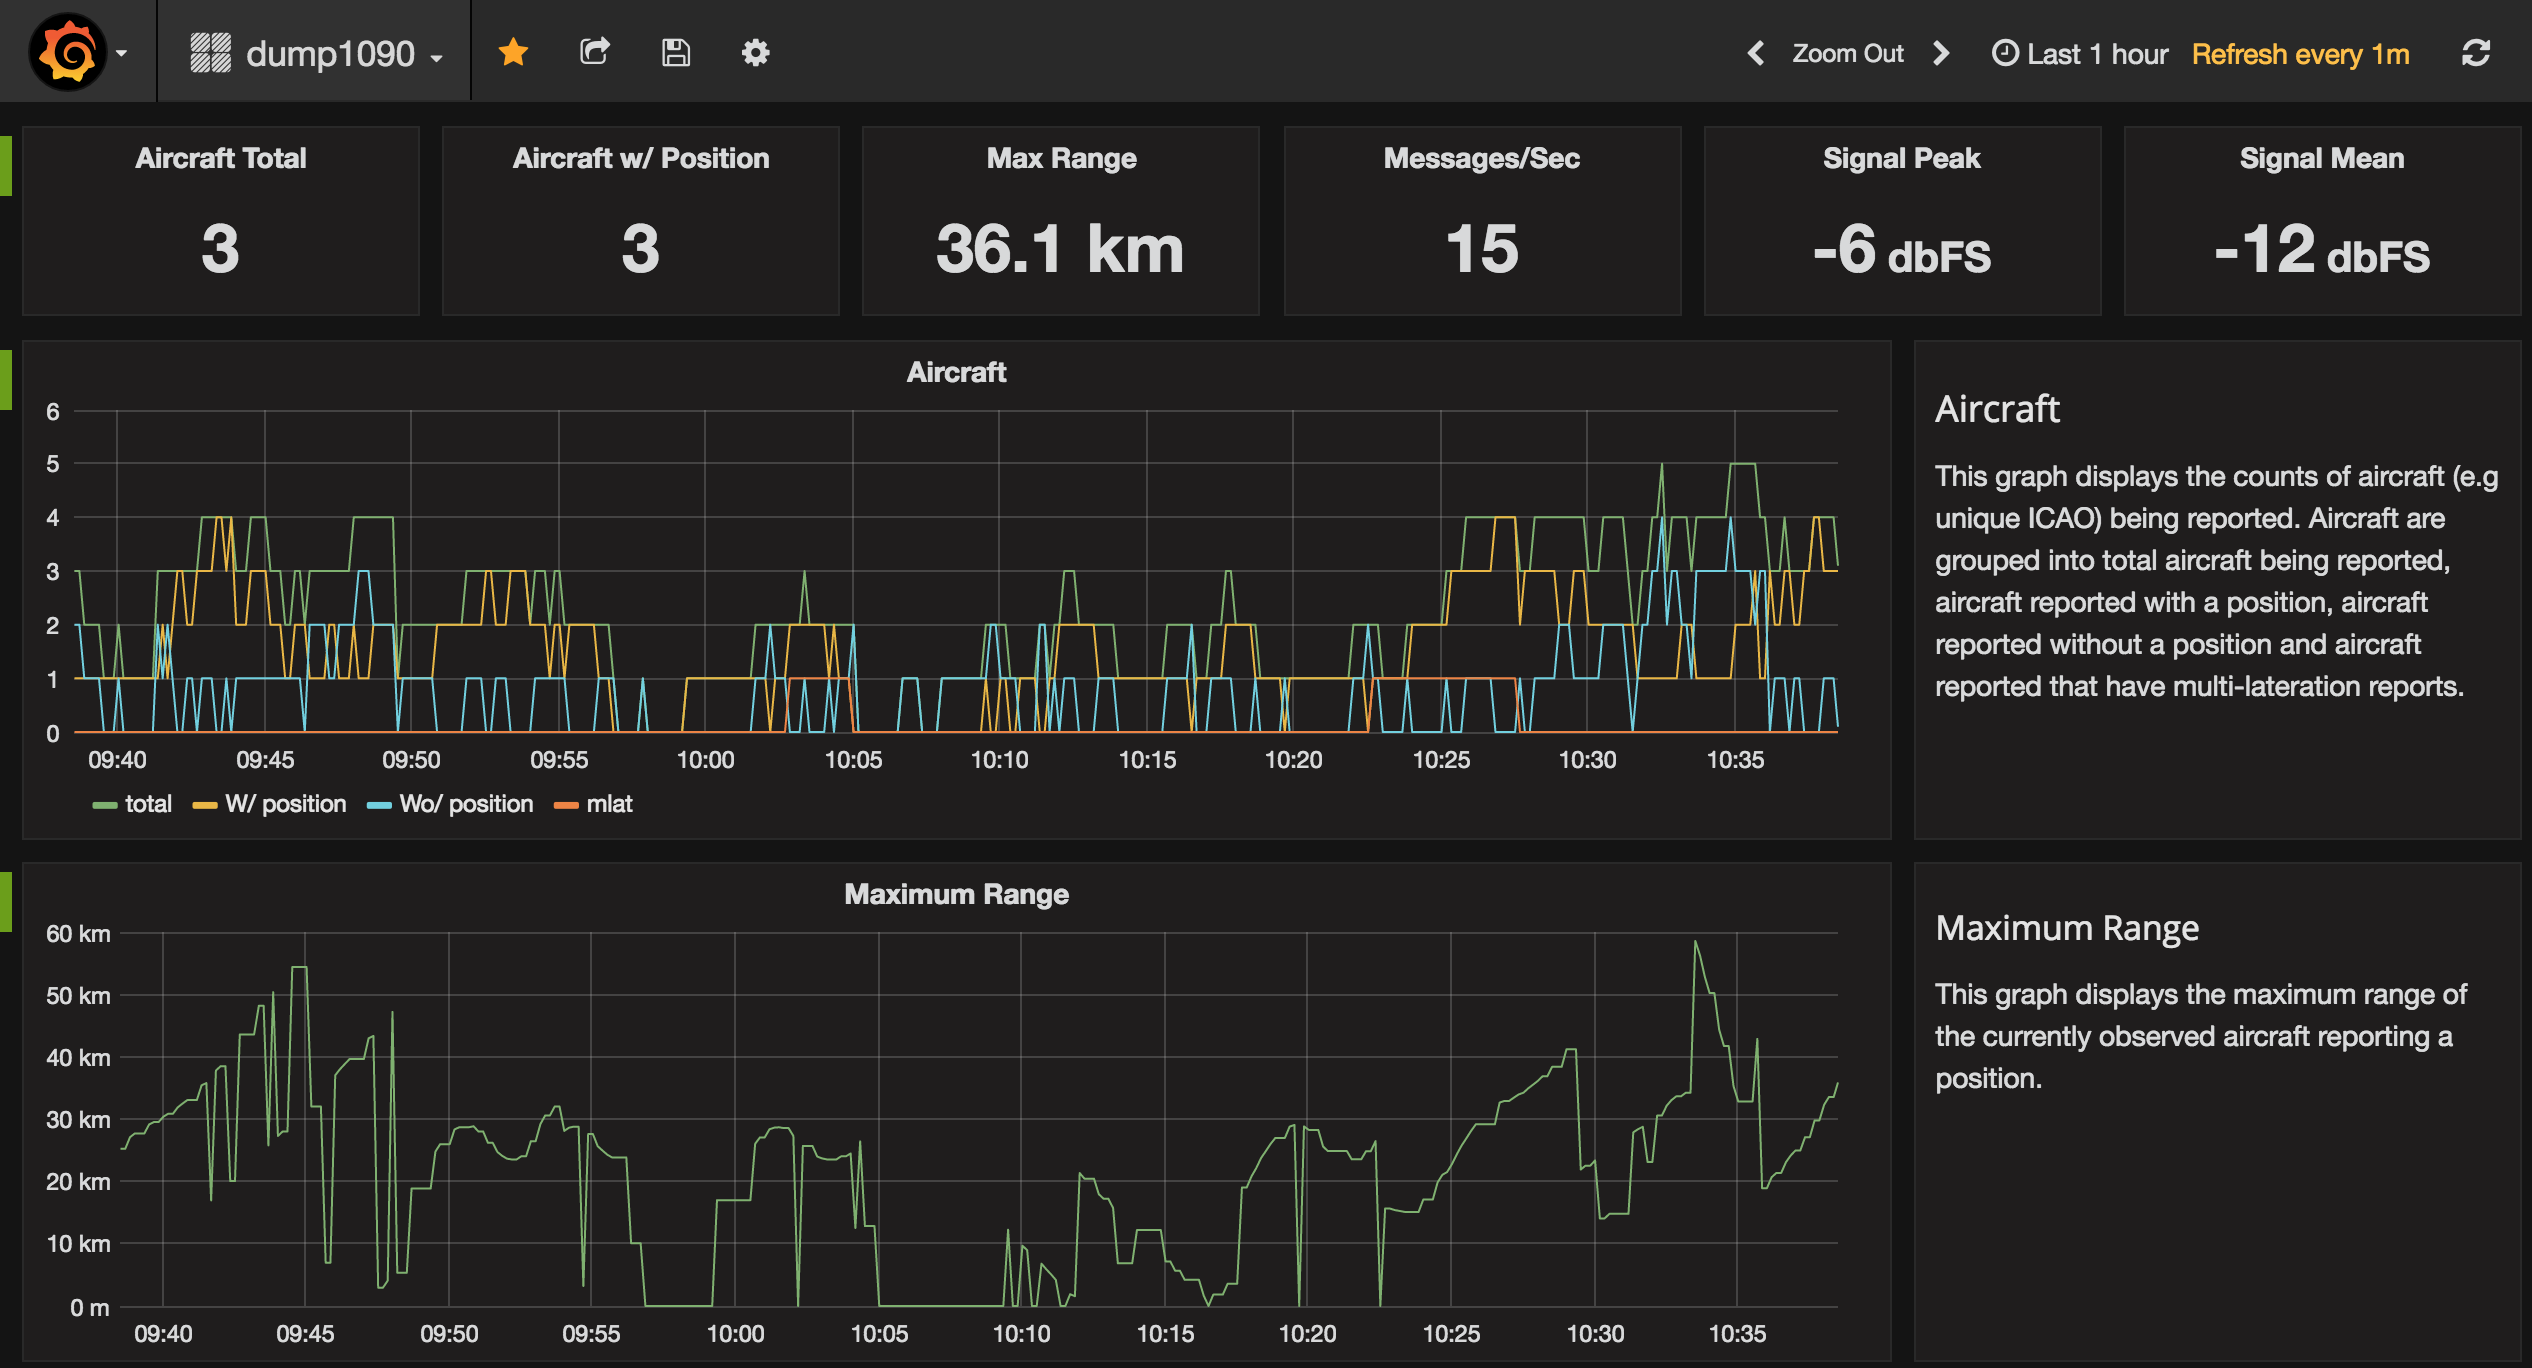
Visualisation
The Granfana visualisation tool can display nice looking charts and it supports Prometheus. A dump1090export Grafana dashboard has been created to demonstrate how the data provided by the exporter can be visualised.
Docker
The dump1090 exporter has been packaged into a Docker container on DockerHub.
This can simplify running it in some environments. The container is configured
with an entry point that runs the dump1090 exporter application. The default
command argument is --help which will display help information.
$ docker run -it --rm clawsicus/dump1090exporter
usage: dump1090exporter [-h] [--resource-path <dump1090 url>]
...
To run the dump1090 exporter container in your environment simply pass your own custom command line arguments to it:
$ docker run -p 9105:9105 \
  --detach \
  clawsicus/dump1090exporter \
  --resource-path=http://192.168.1.201:8080/data \
  --latitude=-34.9285 \
  --longitude=138.6007
You can then check the metrics being exposed to Prometheus by fetching them using curl.
$ curl http://127.0.0.1:9105/metrics
Next you would configure a Prometheus server to scape the dump1090exporter container on port 9105.
Demonstration
A demonstration environment can be found in the demo directory. It uses
Docker Compose to orchestrate containers running dump1090exporter, Prometheus
and Grafana to facilitate experimentation with metric collection and graphing.
This provides a really quick and easy method for checking out the dump1090exporter.
Developer Notes
Python Release Process
The following steps are used to make a new software release:
-
Ensure current branch is set to master and is up to date.
-
Create a virtual environment, install dependencies and the dump1090exporter.
$ make venv
$ source venv/bin/activate
(d1090exp) $
-
Ensure all checks are passing.
(d1090exp) $ make checks
-
Ensure that the version label in
__init__.pyhas been updated. -
Create the distribution. This project produces an artefact called a pure Python wheel. Only Python3 is supported by this package.
(d1090exp) $ make dist
-
Upload the new release to PyPI.
(d1090exp) $ make dist-upload
-
Create and push a repo tag to Github.
$ git tag YY.MM.MICRO -m "A meaningful release tag comment"
$ git tag  # check release tag is in list
$ git push --tags origin master
-
Github will create a release tarball at:
-
Docker Release Process
The following steps are used to make a new software release:
-
Generate the dump1090exporter Python package distribution.
(d1090exp) $ make dist
-
Log in to the Docker user account which will hold the public image.
(d1090exp) $ docker login
username
password
-
Build the dump1090exporter Docker container.
(d1090exp) $ docker build -t clawsicus/dump1090exporter .
-
Perform a simple test of the container by specifying its full namespace to run that container image.
$ docker run -it --rm clawsicus/dump1090exporter
usage: dump1090exporter [-h] [--resource-path <dump1090 url>]
...
-
Test the container by configuring it to connect to a dump1090 service.
$ docker run -p 9105:9105 \
  --detach \
  clawsicus/dump1090exporter \
  --resource-path=http://192.168.1.201:8080/data \
  --latitude=-34.9285 \
  --longitude=138.6007
Confirm that metrics are being collected and exposed by checking metrics are being exposed to Prometheus by fetching them using curl.
$ curl http://127.0.0.1:9105/metrics
-
Publish the new container to DockerHub using:
(d1090exp) $ docker push clawsicus/dump1090exporter:<version>
Release history Release notifications | RSS feed


Download files
Download the file for your platform. If you're not sure which to choose, learn more about installing packages.
Source Distributions
Built Distribution
Filter files by name, interpreter, ABI, and platform.
If you're not sure about the file name format, learn more about wheel file names.
Copy a direct link to the current filters
File details
Details for the file dump1090exporter-22.3.0-py3-none-any.whl.
File metadata
- Download URL: dump1090exporter-22.3.0-py3-none-any.whl
- Upload date:
- Size: 15.3 kB
- Tags: Python 3
- Uploaded using Trusted Publishing? No
- Uploaded via: twine/1.13.0 pkginfo/1.5.0.1 requests/2.18.4 setuptools/40.6.2 requests-toolbelt/0.9.1 tqdm/4.33.0 CPython/3.6.8
File hashes
| Algorithm | Hash digest | |
|---|---|---|
| SHA256 |
5946750948289c747a7beb14bb317529bfb0c5dd418d06d2897693a000b4462c
|
|
| MD5 |
433f85aaec1df4898bb5eb35397bb85d
|
|
| BLAKE2b-256 |
2d74de01df4d6cb9119621da315b4e9e7888730605e338a22551a5f90c7a0b33
|


