Plot standard ECG chart from data

Project description
ECG plot
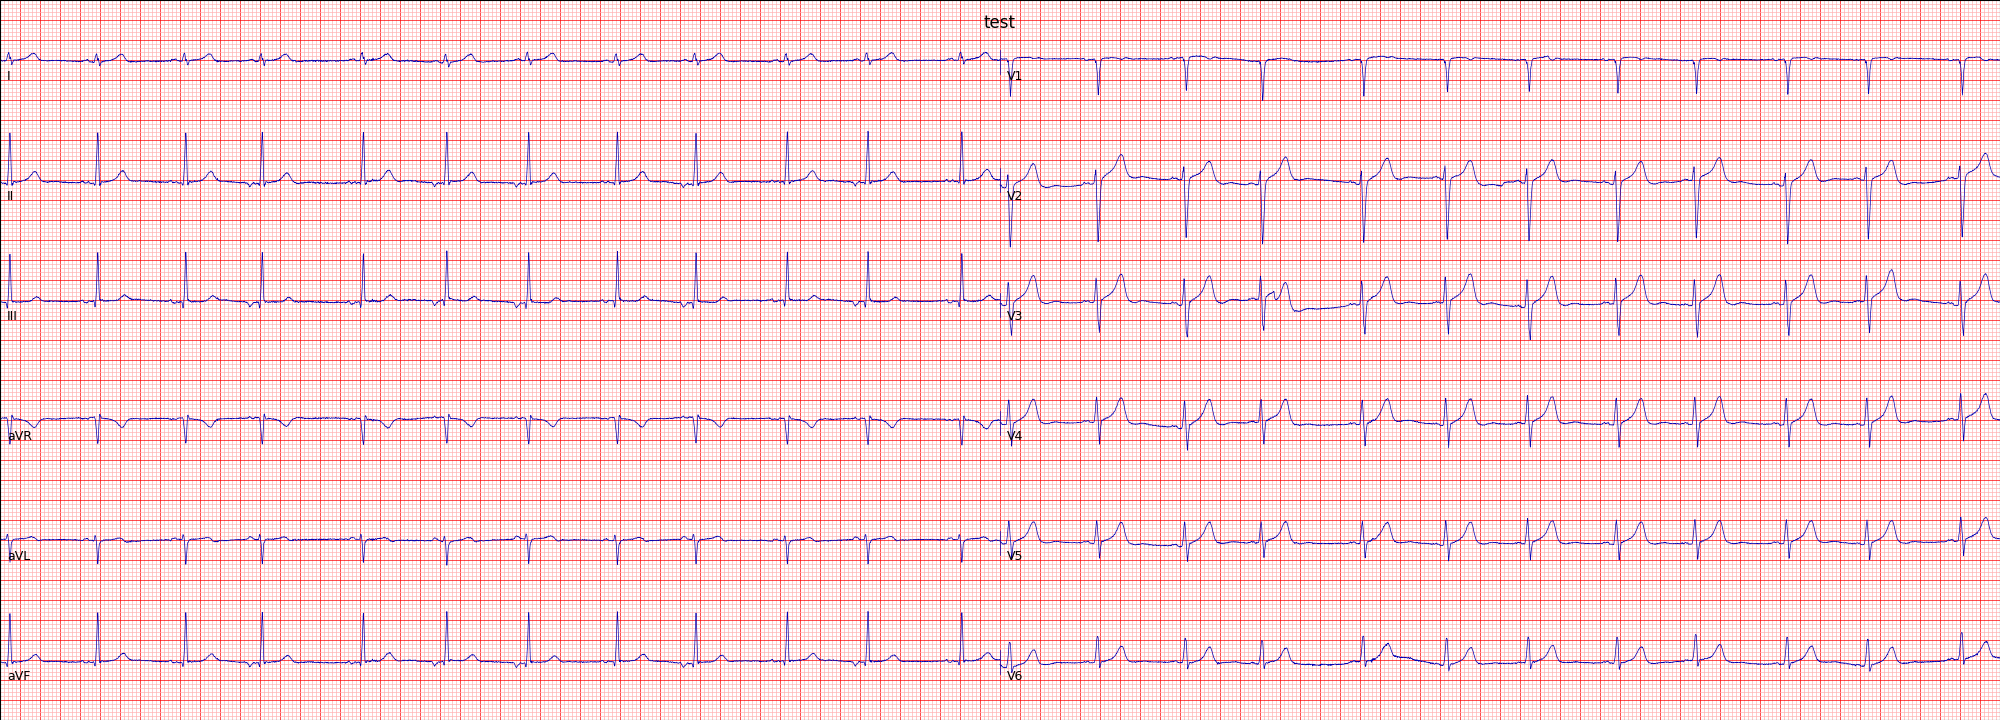
Plot standard ECG chart from data.
- Support both direct plotting and plotting SVG preview in browser (currently only works on mac)
- Support saving PNG and SVG to disk
- Support customer defined lead order
- Support customer defined column count
Install
pip install ecg_plot
Notice
- Input data should be m x n matrix, which m is lead count of ECG and n is length of single lead signal.
- Default sample rate is 500 Hz.
Example
Plot 12 lead ECG
params:
| parameter | description |
|---|---|
| ecg | m x n ECG signal data, which m is number of leads and n is length of signal. |
| sample_rate | Sample rate of the signal. |
| title | Title which will be shown on top off chart |
| lead_index | Lead name array in the same order of ecg, will be shown on left of signal plot, defaults to ['I', 'II', 'III', 'aVR', 'aVL', 'aVF', 'V1', 'V2', 'V3', 'V4', 'V5', 'V6'] |
| lead_order | Lead display order |
| columns | display columns, defaults to 2 |
| style | display style, defaults to None, can be 'bw' which means black white |
| row_height | how many grid should a lead signal have |
| show_lead_name | show lead name |
| show_grid | show grid |
| show_separate_line | show separate line |
import ecg_plot

ecg = load_data() # load data should be implemented by yourself
ecg_plot.plot(ecg, sample_rate = 500, title = 'ECG 12')
ecg_plot.show()
Plot single lead ECG
import ecg_plot

ecg = load_data() # load data should be implemented by yourself
ecg_plot.plot_1(ecg[1], sample_rate=500, title = 'ECG')
ecg_plot.show()
Save result as png
import ecg_plot

ecg = load_data() # load data should be implemented by yourself
ecg_plot.plot_12(ecg, sample_rate = 500, title = 'ECG 12')
ecg_plot.save_as_png('example_ecg','tmp/')
License: MIT


Download files
Download the file for your platform. If you're not sure which to choose, learn more about installing packages.
Source Distribution
ecg_plot-0.2.8.tar.gz
(4.4 kB
view details)
Built Distribution
Filter files by name, interpreter, ABI, and platform.
If you're not sure about the file name format, learn more about wheel file names.
Copy a direct link to the current filters
File details
Details for the file ecg_plot-0.2.8.tar.gz.
File metadata
- Download URL: ecg_plot-0.2.8.tar.gz
- Upload date:
- Size: 4.4 kB
- Tags: Source
- Uploaded using Trusted Publishing? No
- Uploaded via: twine/3.3.0 pkginfo/1.6.1 requests/2.25.0 setuptools/51.0.0.post20201207 requests-toolbelt/0.9.1 tqdm/4.55.2 CPython/3.9.1
File hashes
| Algorithm | Hash digest | |
|---|---|---|
| SHA256 |
0ec1f79d86d05c208b46f41d40501c7d4c17e35c70f16858ffbabc3a19eb4f5e
|
|
| MD5 |
e18a5fb37b3c8c74c49668238875d567
|
|
| BLAKE2b-256 |
a0b89a51a54637210d0a163ecf6443ecb1f9f431178ff288e755787998d44b59
|
File details
Details for the file ecg_plot-0.2.8-py3-none-any.whl.
File metadata
- Download URL: ecg_plot-0.2.8-py3-none-any.whl
- Upload date:
- Size: 9.2 kB
- Tags: Python 3
- Uploaded using Trusted Publishing? No
- Uploaded via: twine/3.3.0 pkginfo/1.6.1 requests/2.25.0 setuptools/51.0.0.post20201207 requests-toolbelt/0.9.1 tqdm/4.55.2 CPython/3.9.1
File hashes
| Algorithm | Hash digest | |
|---|---|---|
| SHA256 |
ebb30fe0364e910767174d749fd86dad1f31c026b33d711511fc024cd4d0df1e
|
|
| MD5 |
eb5955f69dc512648f2f179c5a483210
|
|
| BLAKE2b-256 |
383b8d0260457aa12db2337ab6feaeb5738a3449130d9014c86c6e0304acde55
|


