
EDB (Evan's Debugger) → MCP server. 147 debugging tools for AI-assisted reverse engineering. GDB MI + pwntools + Binary Ninja integration.

Project description
EDB Debugger MCP





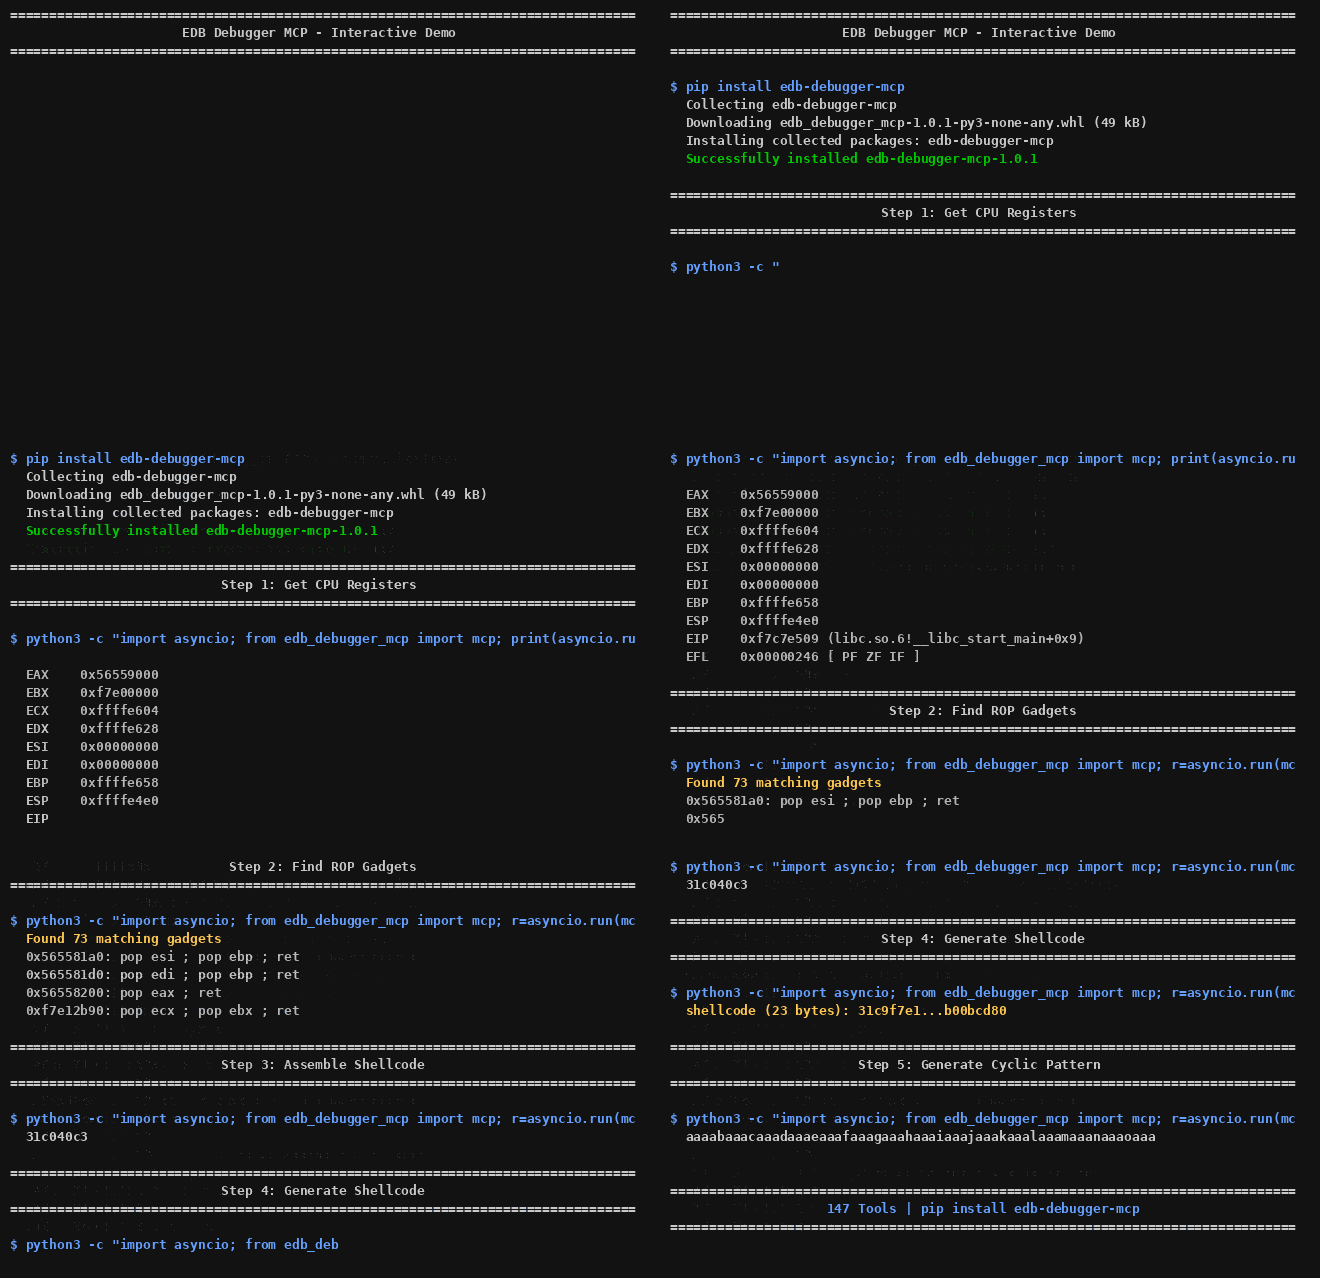
About
EDB (Evan's Debugger) is a feature-rich, open-source GUI debugger for Linux (x86/x86-64), known for its intuitive interface, powerful plugin system (22 plugins), and extensive debugging capabilities — breakpoints, memory analysis, ROP tool, heap analyzer, and more. However, EDB has always been limited to manual GUI interaction — until now.
EDB Debugger MCP bridges EDB's debugging engine with modern AI via the Model Context Protocol (MCP). Every EDB feature is exposed as a tool callable by an AI assistant — Claude Desktop, Cursor, or any MCP host — effectively giving AI a debugger's intuition. The server exposes 147 debugging tools (83 Pydantic models, 123 backend methods, ~6100 LOC).
Behind the scenes, it translates AI requests into GDB MI commands via a high-performance async backend, then formats results back as structured data. Combined with pwntools integration (ROP, shellcode, cyclic, ELF), it becomes a complete AI-powered reverse engineering workstation.
| Stat | Value |
|---|---|
| Total tools | 147 (135 edb_ + 12 pwntools_) |
| EDB feature coverage | 22/22 plugins · 29/29 actions · 13/13 dialogs · 6/6 views |
| Code size | ~6100 LOC · 83 Pydantic models · 123 backend methods |
EDB · GDB · MCP · FastMCP · pwntools · Binary Ninja
Table of Contents
- Quick Start
- Features
- Use Cases
- Requirements
- Installation
- Usage
- Architecture
- pwntools Tools
- EDB Plugin Mapping
- Binary Ninja Integration
- Project Structure
- Tool Reference
- License
Quick Start
pip install edb-debugger-mcp
edb-debugger-mcp &
Then add to Claude Desktop config and ask: "Load /bin/ls, find ROP gadgets with pop eax, and generate execve shellcode" — the AI handles the rest.
Features
- Program Control — Load, run, pause, continue, restart, attach/detach, kill
- Breakpoints — Software/hardware breakpoints, watchpoints (read/write/access), conditional, ignore count, commands, catchpoints, export/import
- Step Operations — Step into/over/out, step instruction, step-over instruction, reverse step/continue
- Register Management — Read/write all CPU/FPU/SIMD registers, formatted dump, flag analysis, changed registers
- Memory Operations — Hex dump, write memory/bytes, fill pattern, search, compare regions, set permissions
- Disassembly — Full/range disassembly, current instruction, assembly patching, NOP fill
- Stack Analysis — Stack dump, push/pop/modify, frame info, backtrace, arguments, locals
- Symbol Resolution — Symbol lookup, modules, sections, entry point, symbol map, binary info
- Thread Support — List/switch threads, process info, thread info
- Expression Evaluation — C expression, variable get/set, string reading, type info (ptype/whatis)
- Code Analysis — Source listing, function info/bounds, references, ROP gadgets, basic blocks, CFG
- Code Patching — Assemble instruction, NOP range, fill zero, label address, comments/annotations
- Session Management — Save/load sessions, bookmark addresses, export/import breakpoints
- Remote Debugging — Connect to remote GDB server, generate core dumps
- Environment — Get/set/unset env vars, set working directory, TTY, signal handling
- Configuration — ASLR toggle, lazy binding toggle, debug output, session logging, signal ignore list
- Utility — Binary string convert (hex↔ascii↔utf-16), file↔VA offset convert, font config
- Pwntools Integration — Assembly/disassembly (Keystone/Capstone), ELF analysis, ROP gadget search, shellcode generation, cyclic pattern, format string payloads, pack/unpack
Use Cases
- CTF Exploit Development —
pwntools_cyclic→ offset →edb_find_rop_gadgets→pwntools_shellcraft→pwntools_asm - Malware Analysis —
edb_attach_process→edb_set_breakpoint→edb_read_memory→edb_generate_core_dump - Bug Hunting —
edb_disable_aslr→edb_run→edb_search_memory→edb_analyze_heap - Vulnerability Research —
edb_evaluate_expression→edb_get_stack→edb_instruction_detail→edb_call_function - Reverse Engineering —
edb_disassemble_range→edb_generate_cfg→edb_find_strings→edb_lookup_symbol
Requirements
- Python >= 3.10
- GDB (GNU Debugger) installed on the system
- Linux (x86-64 recommended)
Installation
# Clone the repository
git clone https://github.com/oakkaya/edb-debugger-mcp.git
cd edb-debugger-mcp

# Install dependencies
pip install -r requirements.txt

# (Optional) Install with pip
pip install -e .
Usage
Standalone
python edb_debugger_mcp.py
This starts the MCP server on stdio, ready to accept MCP protocol messages.
Testing
# Compile a test binary
gcc -g -o /tmp/test_bin /path/to/test.c

# Then run the server manually or use an MCP client
Claude Desktop Integration
If installed via pip:
{
  "mcpServers": {
    "edb-debugger-mcp": {
      "command": "edb-debugger-mcp"
    }
  }
}
If installed from source:
{
  "mcpServers": {
    "edb-debugger-mcp": {
      "command": "python",
      "args": ["/path/to/edb_debugger_mcp/edb_debugger_mcp.py"]
    }
  }
}
Config file location:
- macOS:
~/Library/Application Support/Claude/claude_desktop_config.json - Linux:
~/.config/Claude/claude_desktop_config.json - Windows:
%APPDATA%\Claude\claude_desktop_config.json
Other MCP Hosts
The same server works with any MCP-compatible host. Example configurations:
opencode (~/.config/opencode/config.json):
{
  "mcpServers": {
    "edb-debugger-mcp": {
      "command": "edb-debugger-mcp"
    }
  }
}
Cursor (Project Settings → MCP Servers):
{
  "mcpServers": {
    "edb-debugger-mcp": {
      "command": "edb-debugger-mcp"
    }
  }
}
Continue.dev (~/.continue/config.json):
{
  "experimental": {
    "mcpServers": {
      "edb-debugger-mcp": {
        "command": "edb-debugger-mcp"
      }
    }
  }
}
Architecture
┌─────────────────────┐     MCP Protocol      ┌──────────────────────┐
│   MCP Client        │ ◄──────────────────►  │   FastMCP Server     │
│ (Claude, Cursor)    │     stdio JSON-RPC    │   edb_debugger_mcp.py│
└─────────────────────┘                       └──────────┬───────────┘
                                                          │
                                                      GDB MI
                                                   (--interpreter=mi2)
                                                          │
                                                 ┌────────┴───────────┐
                                                 │   GDB Backend      │
                                                 │   gdb_backend.py   │
                                                 │  (async subprocess)│
                                                 │  MI parser + 123   │
                                                 │  public methods    │
                                                 └────────────────────┘
The server uses GDB's MI (Machine Interface) protocol (--interpreter=mi2) to communicate with GDB as a subprocess. The backend:
- Sends MI/CLI commands via stdin, parses structured MI responses
- Handles
*stoppedasync events for breakpoint hits - Manages process lifecycle (start, kill, detach)
- Provides
readelf-based file offset ↔ VA conversion
Note: The EDB action/dialog/view counts listed in this README cover all of EDB's UI elements. Since this project is an MCP server, UI-only features (About dialog, font selector, Reset UI, window layout) cannot be mapped. All functional debugging capabilities (breakpoint, register, memory, stack, thread, expression, patching, analysis, ROP, session) are 100% covered.
pwntools Tools
The server integrates pwntools — the CTF/exploit development framework — as 12 MCP tools callable alongside the EDB debugger tools.
| Tool | Description |
|---|---|
pwntools_analyze_elf |
Full ELF binary analysis (headers, sections, symbols, security, strings) |
pwntools_find_rop |
Search for ROP gadgets by regex |
pwntools_build_rop_chain |
Build a ROP chain with ordered gadgets |
pwntools_shellcraft |
Generate shellcode for a given arch/OS (execve, bind/rev shell, etc.) |
pwntools_cyclic |
Generate De Bruijn cyclic pattern for offset discovery |
pwntools_cyclic_find |
Find offset of a value in cyclic pattern |
pwntools_pack |
Pack integer to bytes (little/big endian, 8/16/32/64-bit) |
pwntools_unpack |
Unpack bytes to integer |
pwntools_disasm_bytes |
Disassemble raw bytes with pwntools (architecture-aware) |
pwntools_asm_instructions |
Assemble assembly instructions to bytes |
pwntools_fmtstr_payload |
Generate format string write payload |
pwntools_hexdump_data |
Hex dump with ASCII side (colored, offset-labeled) |
Usage: ask the AI "Find ROP gadgets with pop rdi" or "Generate x64 execve shellcode" — no separate setup needed.
EDB Plugin Mapping
| Plugin | MCP Coverage |
|---|---|
| DebuggerCore | Execution, stepping, breakpoints, registers, memory, state |
| BreakpointManager | edb_set_breakpoint, edb_list_breakpoints, edb_export/import |
| HardwareBreakpoints | edb_set_hardware_breakpoint, edb_set_watchpoint |
| InstructionInspector | edb_instruction_detail |
| Assembler | edb_assemble (Keystone optional) |
| BinaryInfo | edb_get_binary_info |
| BinarySearcher | edb_search_memory |
| Backtrace | edb_get_backtrace |
| FasLoader | edb_load_symbol_file |
| DumpState | edb_dump_state |
| FunctionFinder | edb_list_functions |
| OpcodeSearcher | edb_search_instructions |
| References | edb_find_references, edb_string_references |
| ROPTool | edb_find_rop_gadgets |
| HeapAnalyzer | edb_analyze_heap |
| Analyzer | edb_analyze_region, edb_analyze_basic_blocks |
| SymbolViewer | edb_lookup_symbol |
| ProcessProperties | edb_get_process_properties |
| ODbgRegisterView | edb_get_registers, edb_get_fpu_state, edb_get_simd_state |
| Bookmarks | edb_add_bookmark, edb_list_bookmarks, edb_remove_bookmark |
| CheckVersion | Automatically handled |
| DebuggerErrorConsole | edb_set_debug_output |
Binary Ninja Integration
⚠ Experimental / untested — Binary Ninja is a commercial product (not available in this environment). The plugin code is structurally complete and follows the BN plugin API, but has not been verified at runtime. PRs welcome.
The binaryninja_mcp/ directory contains a full Binary Ninja plugin that bridges the decompiler with the live debugger. Features:
- Register overlay — HLIL comments with live register values
- Single-click breakpoints — Right-click to toggle software/hardware breakpoints
- In-place patching — NOP, assemble, range-NOP from the disassembly context menu
- Step control — Step into/over/out, run, pause via Plugins menu
- Sidebar widget — Live register summary in the "EDB Debugger" tab
Install: ln -s $(pwd)/binaryninja_mcp ~/.binaryninja/plugins/edb-debugger-bridge
Project Structure
edb-debugger-mcp/
├── gdb_backend.py          # GDB MI backend (123 public methods, MI parser, session mgmt)
├── edb_debugger_mcp.py     # FastMCP server (135 edb_ tools, 83 Pydantic models)
├── pwntools_mcp.py         # Pwntools integration (12 pwntools_ tools: ROP, shellcode, ELF, asm, fmtstr)
├── binaryninja_mcp/        # Binary Ninja plugin (register overlay, right-click BP/patch, step)
├── pyproject.toml          # Project configuration
├── requirements.txt        # Python dependencies
├── README.md               # This file
├── LICENSE                 # MIT License
└── .gitignore              # Git ignore rules
Tool Reference (147 tools)
Click to expand the full tool reference (17 categories, 147 tools)
Program Control (12 tools)
| Tool | Description |
|---|---|
edb_load_program |
Load binary for debugging with optional args/working dir |
edb_attach_process |
Attach to running process by PID |
edb_detach_process |
Detach from debugged process |
edb_kill_process |
Kill the debugged process |
edb_run |
Start/restart execution |
edb_continue |
Continue after breakpoint/pause |
edb_pause |
Interrupt the running program |
edb_restart |
Kill and restart with breakpoints preserved |
edb_continue_to |
Run until target address is reached |
edb_remote_connect |
Connect to remote GDB server (gdbserver) |
edb_generate_core_dump |
Generate core dump of current process state |
edb_send_signal |
Send signal to debugee |
Step Operations (8 tools)
| Tool | Description |
|---|---|
edb_step_into |
Step into next instruction (source level) |
edb_step_over |
Step over next call (source level) |
edb_step_out |
Execute until function returns |
edb_step_instruction |
Step one instruction (assembly level, into calls) |
edb_step_over_instruction |
Step over one instruction (assembly level) |
edb_reverse_step |
Step backward one instruction (needs record) |
edb_reverse_continue |
Continue backward (needs record) |
edb_jump_to_address |
Set EIP/RIP to arbitrary address |
Breakpoints (14 tools)
| Tool | Description |
|---|---|
edb_set_breakpoint |
Set breakpoint at function/address/file:line |
edb_set_hardware_breakpoint |
Set hardware-assisted breakpoint |
edb_set_watchpoint |
Set watchpoint (write/read/access) |
edb_set_catchpoint |
Set catchpoint (exception/event/syscall) |
edb_set_trace_point |
Set conditional logging breakpoint |
edb_set_breakpoint_condition |
Add condition to breakpoint |
edb_set_breakpoint_ignore_count |
Set breakpoint ignore count |
edb_breakpoint_commands |
Set commands to run on breakpoint hit |
edb_remove_breakpoint |
Remove breakpoint by number |
edb_enable_breakpoint |
Enable disabled breakpoint |
edb_disable_breakpoint |
Disable breakpoint |
edb_list_breakpoints |
List all breakpoints with status |
edb_breakpoint_export |
Export breakpoints to JSON file |
edb_breakpoint_import |
Import breakpoints from JSON file |
Register Operations (8 tools)
| Tool | Description |
|---|---|
edb_get_registers |
Get all CPU register values |
edb_get_register |
Get single register value |
edb_set_register |
Modify a register value |
edb_dump_registers |
Formatted register dump with flag analysis |
edb_get_changed_registers |
Show all registers (EDB-style changed highlighting) |
edb_get_fpu_state |
Get FPU register state (ST0-ST7, control/status words) |
edb_get_simd_state |
Get SIMD register state (XMM/YMM/ZMM) |
edb_get_arch_info |
Get architecture info (pointer size, CPU type) |
Memory Operations (13 tools)
| Tool | Description |
|---|---|
edb_read_memory |
Hex dump memory at address with configurable format |
edb_read_memory_as |
Read memory as specified data type (int, float, char, etc.) |
edb_write_memory |
Write value to memory address |
edb_write_memory_bytes |
Write raw hex bytes to memory |
edb_search_memory |
Search memory for byte/string pattern |
edb_dump_memory_to_file |
Dump memory range to file |
edb_fill_memory |
Fill memory range with byte pattern |
edb_get_memory_map |
Get process memory map with permissions |
edb_get_memory_region_info |
Get memory region config (base, size, perms) |
edb_set_memory_permissions |
Set memory region permissions (R/W/X) |
edb_compare_memory |
Compare two memory regions |
edb_compare_sections |
Compare binary sections with in-memory data |
edb_binary_string_convert |
Convert between hex/ASCII/UTF-16 representations |
Disassembly (7 tools)
| Tool | Description |
|---|---|
edb_disassemble |
Disassemble at address or function name |
edb_disassemble_range |
Disassemble address range with configurable length |
edb_get_current_instruction |
Get instruction at program counter |
edb_nop_range |
NOP out instruction range |
edb_assemble |
Assemble instruction at address (Keystone optional) |
edb_search_instructions |
Search for instruction patterns (OpcodeSearcher) |
edb_generate_cfg |
Generate control flow graph in DOT format |
Stack & Frames (10 tools)
| Tool | Description |
|---|---|
edb_get_stack |
Dump stack contents |
edb_get_stack_frame |
Get stack frame details (RBP, RSP, return addr) |
edb_get_backtrace |
Get full call stack backtrace |
edb_get_frame_info |
Get detailed stack frame info |
edb_get_arguments |
Get function arguments |
edb_get_locals |
Get local variables |
edb_get_variable |
Get variable value |
edb_set_variable |
Modify variable value |
edb_stack_push |
Push value onto program stack |
edb_stack_pop |
Pop value from program stack |
edb_stack_modify |
Modify value at stack top without changing RSP |
Symbol Analysis (9 tools)
| Tool | Description |
|---|---|
edb_lookup_symbol |
Look up symbol address and type |
edb_list_functions |
List functions in binary |
edb_get_function_info |
Get function details (name, address, bounds) |
edb_get_function_bounds |
Get function start/end addresses |
edb_list_modules |
List loaded shared libraries |
edb_get_section_info |
Get ELF section information |
edb_get_entry_point |
Get program entry point |
edb_get_binary_info |
Get binary file info (arch, type, sections) |
edb_generate_symbols |
Generate binary symbol map (FAS loader) |
Thread & Process (6 tools)
| Tool | Description |
|---|---|
edb_list_threads |
List all threads with status |
edb_get_current_thread |
Get current thread info |
edb_set_current_thread |
Switch to different thread |
edb_get_process_properties |
Get process properties |
edb_inferior_info |
Get inferior/process info |
edb_list_features |
List GDB features and capabilities |
Expression & Data (7 tools)
| Tool | Description |
|---|---|
edb_evaluate_expression |
Evaluate C expression |
edb_ptype |
Print type definition of expression |
edb_whatis |
Print type name of expression |
edb_get_string |
Read null-terminated string from memory |
edb_find_strings |
Find printable strings in memory region |
edb_find_references |
Find code references to address |
edb_string_references |
Find string references in binary |
Code Analysis (6 tools)
| Tool | Description |
|---|---|
edb_list_source |
Display source code |
edb_list_source_files |
List compiled source files |
edb_analyze_region |
Analyze code region for functions |
edb_analyze_calls_at |
Analyze function calls at address |
edb_analyze_basic_blocks |
Analyze basic blocks in region |
edb_analyze_heap |
Analyze heap memory (HeapAnalyzer) |
Patching & Annotations (8 tools)
| Tool | Description |
|---|---|
edb_call_function |
Call function in debugged process |
edb_label_address |
Label an address in disassembly view |
edb_add_comment |
Add comment/annotation at address |
edb_list_comments |
List all address annotations |
edb_remove_comment |
Remove annotation at address |
edb_add_bookmark |
Add bookmark at address |
edb_list_bookmarks |
List all bookmarks |
edb_remove_bookmark |
Remove bookmark at address |
Session & Environment (12 tools)
| Tool | Description |
|---|---|
edb_session_save |
Save current debugging session to JSON |
edb_session_load |
Load debugging session from JSON |
edb_set_working_directory |
Set program working directory |
edb_set_environment_variable |
Set environment variable for debugee |
edb_unset_environment_variable |
Unset environment variable |
edb_get_environment |
Show environment variables |
edb_set_tty |
Set terminal for program I/O |
edb_configure_debugger |
Configure debugger settings |
edb_show_configuration |
Show GDB configuration |
edb_disable_aslr |
Toggle ASLR for debugee |
edb_disable_lazy_binding |
Toggle lazy binding |
edb_load_symbol_file |
Load symbol file (FAS loader) |
Debugger Control (12 tools)
| Tool | Description |
|---|---|
edb_get_status |
Get full debugger state |
edb_get_stop_reason |
Get last stop reason |
edb_instruction_detail |
Get detailed instruction info (InstructionInspector) |
edb_dump_state |
Dump full process state (DumpState plugin) |
edb_signal_handling |
Configure signal handling |
edb_list_signals |
List signals and their handling |
edb_set_debug_output |
Configure GDB debug output |
edb_set_session_logging |
Log GDB I/O to file |
edb_view_at_address |
View address in CPU/Dump/Stack views |
edb_list_plugins |
List loaded debugger plugins |
edb_list_stack_arguments |
List stack frame arguments |
edb_find_rop_gadgets |
Find ROP gadgets in binary |
File Utils (2 tools)
| Tool | Description |
|---|---|
edb_va_to_file_offset |
Convert virtual address to file offset |
edb_file_offset_to_va |
Convert file offset to virtual address |
License
MIT License — see LICENSE for details.
Release history Release notifications | RSS feed


Download files
Download the file for your platform. If you're not sure which to choose, learn more about installing packages.
Source Distribution
Built Distribution
Filter files by name, interpreter, ABI, and platform.
If you're not sure about the file name format, learn more about wheel file names.
Copy a direct link to the current filters
File details
Details for the file edb_debugger_mcp-1.0.6.tar.gz.
File metadata
- Download URL: edb_debugger_mcp-1.0.6.tar.gz
- Upload date:
- Size: 509.0 kB
- Tags: Source
- Uploaded using Trusted Publishing? No
- Uploaded via: twine/6.2.0 CPython/3.13.12
File hashes
| Algorithm | Hash digest | |
|---|---|---|
| SHA256 |
647802708cb0420a0d0da631650a0e36edd3f1df077e71266a2b0ae711f2b3f1
|
|
| MD5 |
c3a9b8de30b77470e342e36f95f88f15
|
|
| BLAKE2b-256 |
3856f99b4dfe41378bf9489f7c7d77888d5f119b4e654c7072277dedaf3daa24
|
File details
Details for the file edb_debugger_mcp-1.0.6-py3-none-any.whl.
File metadata
- Download URL: edb_debugger_mcp-1.0.6-py3-none-any.whl
- Upload date:
- Size: 64.5 kB
- Tags: Python 3
- Uploaded using Trusted Publishing? No
- Uploaded via: twine/6.2.0 CPython/3.13.12
File hashes
| Algorithm | Hash digest | |
|---|---|---|
| SHA256 |
7358c689f07e6fa3d517922ee8d856718c7f6672b70ad74ef56746383d8295b8
|
|
| MD5 |
bb1beb174a15dbe8d8ec4234bd658a8d
|
|
| BLAKE2b-256 |
e46d367ff3a71880924d976b58efb49c2f2439c5d6d183309eae587e39314001
|






