
elastica
Estimate how price-sensitive your customers really are from plain sales data, with double machine learning, and turn that into a price recommendation you can defend.


Why
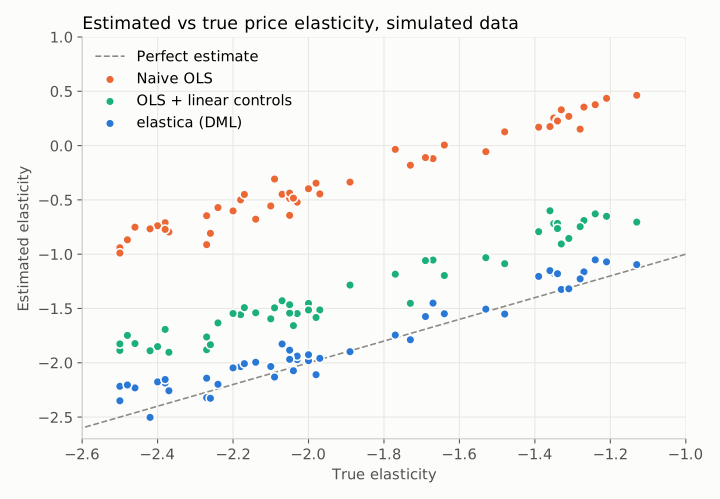
The usual way to measure price elasticity, regressing log quantity on log price, is wrong whenever something moves price and demand together. Retailers raise prices in high season, when demand is high anyway, so the naive slope says customers barely react to price. In the benchmark above it is not just off: for many products it comes out positive.
elastica removes that confounding with double machine learning (Chernozhukov et al., 2018): it predicts both price and demand from the calendar and your controls with gradient boosting, then estimates the elasticity from what is left. You get a confidence interval, diagnostics that tell you when not to trust the number, and a price recommendation that stays close to the prices you have actually tried.
Benchmark
examples/benchmark.py simulates 50 products with a known elasticity, seasonality and two week-long sales peaks that raise both price and demand, then compares three estimators on the same data:
| Method | Mean absolute error | Mean bias |
|---|---|---|
| Naive OLS (log q on log p) | 1.59 | +1.59 |
| OLS + the same controls, linear | 0.55 | +0.55 |
| elastica (DML) | 0.12 | +0.09 |
elastica's 95 % confidence interval contains the true value in 80 % of runs. The shortfall from 95 % comes from the sharp sales peaks: with two years of daily data the nuisance models cannot fully learn them, which leaves a small bias toward zero. Without the peaks, coverage is 19 of 20 runs. Reproduce it with uv run --group docs python examples/benchmark.py.
Install
pip install elastica
Requires Python 3.11+. Dependencies: numpy, pandas, scikit-learn.
Quickstart
Generate a demo dataset with known answers, then estimate and price (from a clone of this repository, prefix each command with uv run):
$ elastica simulate -o sales.csv
true elasticities: SKU-001 -2.2, SKU-002 -1.87, SKU-003 -1.53, SKU-004 -1.2

$ elastica estimate sales.csv --controls promo
Product  Elasticity  95% CI low  95% CI high  Naive  Periods
-------  ----------  ----------  -----------  -----  -------
SKU-001       -2.02       -2.23        -1.81  -0.55      730
SKU-002       -1.77       -1.97        -1.58  -0.32      730
SKU-003       -1.47       -1.66        -1.27  -0.05      730
SKU-004       -1.07       -1.26        -0.89   0.35      730

$ elastica price sales.csv --controls promo --cost unit_cost
Product  Elasticity  Current  Recommended  Range low  Range high  Profit  Revenue
-------  ----------  -------  -----------  ---------  ----------  ------  -------
SKU-001       -2.02   105.34       109.15      99.95      123.10   +0.1%    -3.6%
SKU-002       -1.77    67.42        72.35      64.06       80.91   +0.4%    -5.3%
SKU-003       -1.47   128.62       154.35     146.68      154.35   +4.6%    -8.1%
SKU-004       -1.07    96.10       115.33     115.33      115.33  +13.1%    -1.3%

SKU-003: price capped at the top of the band; consider testing a wider band in small steps

SKU-004: the confidence interval includes -1; elastic vs inelastic is uncertain; price capped at the top of the band; consider testing a wider band in small steps
Range is the recommended price at each end of the elasticity's confidence interval. Profit and Revenue are the expected changes per period if the model's assumptions hold.
Your data
One row per sale or per product and day, in CSV or Parquet. Only three columns are required; name them however you like:
| Field | Flag | Required | Notes |
|---|---|---|---|
| Date | --date |
yes | Any format pandas can parse. |
| Price | --price |
yes | Unit price actually paid. |
| Quantity | --quantity |
yes | Units sold. |
| Product | --product |
no | Pass --product '' if the file has a single product. |
| Unit cost | --cost |
no | Needed for profit-maximizing prices; or pass --unit-cost 42 for all products. |
| Controls | --controls a,b |
no | Anything else that moves price or demand: promotions, store, channel, stock-outs. Text columns are one-hot encoded. |
Rows are aggregated to product × day (--frequency W or M for weekly or monthly) with a quantity-weighted price. Calendar features (trend, month, day of year, week of year, day of week) are added automatically. Periods with zero sales are dropped and counted.
How it works
For each product, on log-log data:
log q = θ · log p + g(X) + ε      θ is the elasticity
log p =         m(X) + v
- Cross-fitting.
gandmare learned with gradient boosting on K−1 folds and predicted on the held-out fold, so no observation is predicted by a model that saw it. - Partialling out.
θis the slope of the outcome residuals on the price residuals: the part of price variation the calendar and controls cannot explain. - Inference. Standard errors come from the Neyman-orthogonal score; the whole procedure is repeated with new splits (3 by default) and aggregated by the median.
- Pricing. Demand is treated as constant-elasticity around the current price, so the profit-maximizing price is
cost · θ / (1 + θ)whenθ < −1. The result is clamped to a band around the current price (default 80 %–120 %), because the approximation is only reliable near prices you have observed.
Every estimate reports the naive slope and an OLS with linear controls next to the DML estimate, plus the cross-fitted R² of both nuisance models.
Warnings you may see
| Warning | Meaning |
|---|---|
| weakly identified | The controls explain almost all price changes. There is too little independent price variation to learn from; run a price test. |
| positive elasticity | Demand rises with price. A confounder is probably missing from --controls. |
| confidence interval includes −1 | The data cannot tell elastic from inelastic demand, so the direction of the optimal price change is uncertain. |
| capped at the band | The optimum is outside the prices you have tried. Move toward it in small, measured steps. |
Python API
import elastica

sim = elastica.simulate()
panel = elastica.prepare(sim.transactions, elastica.Schema(cost="unit_cost", controls=("promo",)))

for item in elastica.estimate(panel):
    r = item.result
    rec = elastica.recommend(item)
    print(
        f"{item.product}: {r.elasticity:.2f} [{r.ci_low:.2f}, {r.ci_high:.2f}]  naive {r.naive_elasticity:+.2f}  ->  {rec.current_price:.2f} to {rec.recommended_price:.2f} ({rec.reason})"
    )
SKU-001: -2.02 [-2.23, -1.81]  naive -0.55  ->  105.34 to 109.15 (optimum inside the band)
SKU-002: -1.77 [-1.97, -1.58]  naive -0.32  ->  67.42 to 72.35 (optimum inside the band)
SKU-003: -1.47 [-1.66, -1.27]  naive -0.05  ->  128.62 to 154.35 (capped at the top of the band)
SKU-004: -1.07 [-1.26, -0.89]  naive +0.35  ->  96.10 to 115.33 (capped at the top of the band)
More:
elastica.estimate(panel, pooled=True): one estimate across products with product fixed effects, for SKUs with little history.elastica.EstimateOptions(learner=..., folds=Folds.TIME, n_folds=5, n_repeats=3, confidence=0.9): any scikit-learn regressor works aslearner. Time-blocked folds are more conservative and need about three seasons of history.elastica.estimate_elasticity(y, d, x): the estimator on raw arrays.elastica.demand_curve(...),estimates_frame,recommendations_frame: tables for plotting and reporting.
Limits
- Causal only under the usual assumption: everything that moves both price and demand is in the date or in
--controls. If a competitor's price drives yours and is not in the data, the estimate is biased. - Own-price elasticity only; cross-price effects and substitution between products are not modelled.
- The price recommendation is a starting point for a test, not an order.
Development
uv sync
uv run pytest
uv run ruff check . && uv run ruff format --check . && uv run mypy .
See CONTRIBUTING.md.
License
MIT © Diego Tepichin
1 maintainer

Metadata
1 maintainer
Release files for elastica 1.0.0
For a detailed explanation of source distributions (sdists) and built distributions (wheels), please see the package formats documentation.
Source distribution (sdist)
| File | Size | Uploaded | Provenance | Actions |
|---|---|---|---|---|
| elastica-1.0.0.tar.gz | 27.6 kB | Without provenance | Details for elastica-1.0.0.tar.gz |
Built distribution (wheel)
| File | Interpreter | ABI | Platform | Actions Reset |
|---|---|---|---|---|
| elastica-1.0.0-py3-none-any.whl | Python 3 | none | any | Details for elastica-1.0.0-py3-none-any.whl |
Total release size: 48.0 kB
Release files / elastica-1.0.0.tar.gz
| Download URL | elastica-1.0.0.tar.gz |
|---|---|
| Size | 27.6 kB |
| Tags | Source |
|
SHA-256 checksum How to use checksums |
bfeabda6cae858eae5eff94c6b8c49340a4f1d1994334ac1ce2a1f26c3ddec1f
|
|
BLAKE2b-256 checksum How to use checksums |
d5f0af6fe0cfe3c280c1074535adbe62e7edb2954ae0ae00edb822fd108f0ec8
|
| Upload date | |
|
Uploaded using Trusted Publishing? What is trusted publishing? |
No |
| Uploaded via |
uv/0.12.18 {"installer":{"name":"uv","version":"0.12.18","subcommand":["publish"]},"python":null,"implementation":{"name":null,"version":null},"distro":{"name":"macOS","version":null,"id":null,"libc":null},"system":{"name":null,"release":null},"cpu":null,"openssl_version":null,"setuptools_version":null,"rustc_version":null,"ci":null}
|
Release files / elastica-1.0.0-py3-none-any.whl
| Download URL | elastica-1.0.0-py3-none-any.whl |
|---|---|
| Size | 20.4 kB |
| Tags | Python 3 |
|
SHA-256 checksum How to use checksums |
36fdb42929a92c00ad123df7921b8b17aabed351cd4878581113961bd57b2d81
|
|
BLAKE2b-256 checksum How to use checksums |
3e0002453bb64dbcdd92df50041d9a34b6df571ce79c4fd7ddffda0463d6f4bf
|
| Upload date | |
|
Uploaded using Trusted Publishing? What is trusted publishing? |
No |
| Uploaded via |
uv/0.12.18 {"installer":{"name":"uv","version":"0.12.18","subcommand":["publish"]},"python":null,"implementation":{"name":null,"version":null},"distro":{"name":"macOS","version":null,"id":null,"libc":null},"system":{"name":null,"release":null},"cpu":null,"openssl_version":null,"setuptools_version":null,"rustc_version":null,"ci":null}
|
Security for elastica 1.0.0
Provenance
Provenance describes where a file came from. On PyPI, provenance is shared via attestations, which provide a verifiable record of the build or publishing details. View details, limitations and caveats.
No provenance found
None of the files in this release were uploaded with provenance metadata.
A note on package security
PyPI is a repository for distributing packages, not a service for auditing them. While third-party security researchers and our staff do their best to detect and remove malicious packages, PyPI cannot guarantee the quality, security or suitability of any given package.
To learn more about protecting yourself from malicious actors, visit our package security documentation.













