Network graphing utilities for email/mailbox (.mbox) data

Project description
Email Network
Description
Network graphing utilities for email/mailbox data.
For the social scientists, creating social networks from your mailbox data and among other things:
- Discover subgroups within your organization (whether the different task forces established were as cohesive as it seems on the outside)
- Study social actors (most emails from Marketing involve Peter and Andy) and their relative influence
- Identify the key social groups (Sales team hangs out a lot, but the IT / product division less so)
- Key account managers of the company (Despite being with the company only recently, Margaretha is connected to more key clients than her peers)
If you're a graph theorist and looking for something more statistical:
- Support directed and undirected graphs (implemented in version 0.0.2, see below)
- Also output statistical measurements such as centrality distribution (planned for version 0.0.3)
- Betweenness, closeness, hubness, distance histograms plotting (planned for version 0.0.3)
- Exports to
.graphmlformat for use in other graphing software (implemented in version 0.0.2)
Dependencies
- Python 3.7+
- Only dependencies are NetworkX and Matplotlib
Example Usage
To install emailnetwork:
pip install emailnetwork
A sample .mbox file is provided to you, but you can obtain export your own mailbox from your email service provider. If you use Google (Gmail), you can use the Google Takeout service to export your mail data.
from emailnetwork.extract import MBoxReader
reader = MBoxReader('path-to-mbox.mbox')
print(f'{len(reader)} emails in the sample mbox.')

# extract a specific email
email = reader.mbox[5]
emailmsg = extract_meta(email)

# filter emails by certain date
thisyearmails = reader.filter_by_date('>=', '2021-01-05')

# print email domains of recipients
print(emailmsg.recipients)
print(emailmsg.recipients[0].domain)

# extract all emails
emails = reader.extract()
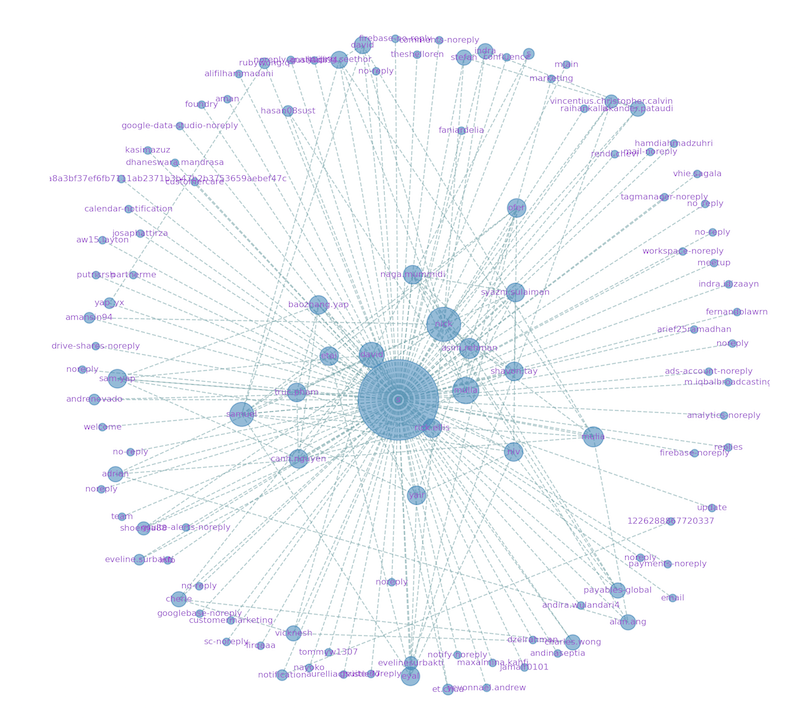
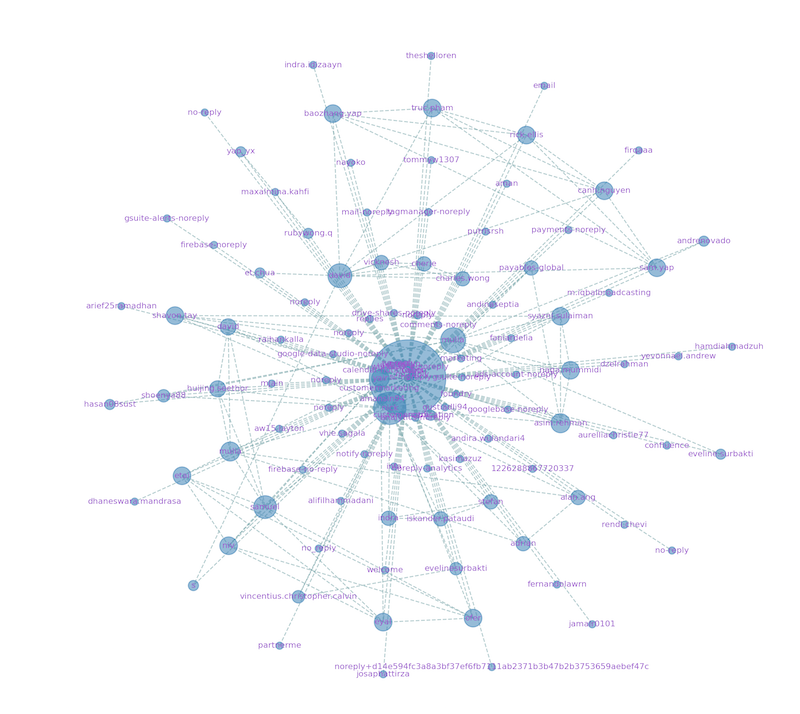
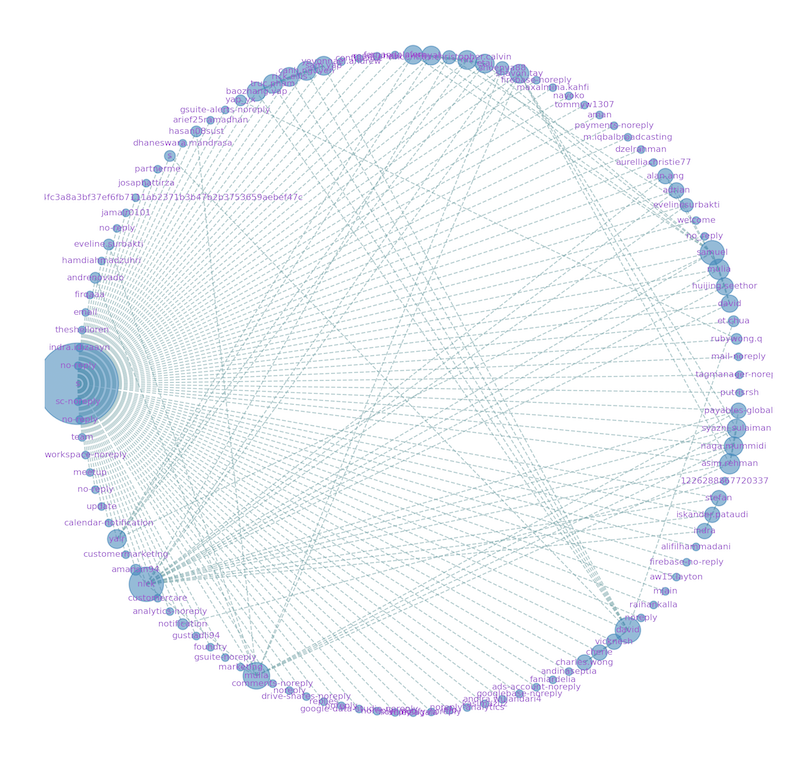
For graph visualization:
from emailnetwork.extract import MBoxReader
# Read from .mbox
MBOX_PATH = f'{os.path.dirname(__file__)}/tests/test.mbox'
reader = MBoxReader(MBOX_PATH)
# Try the following:
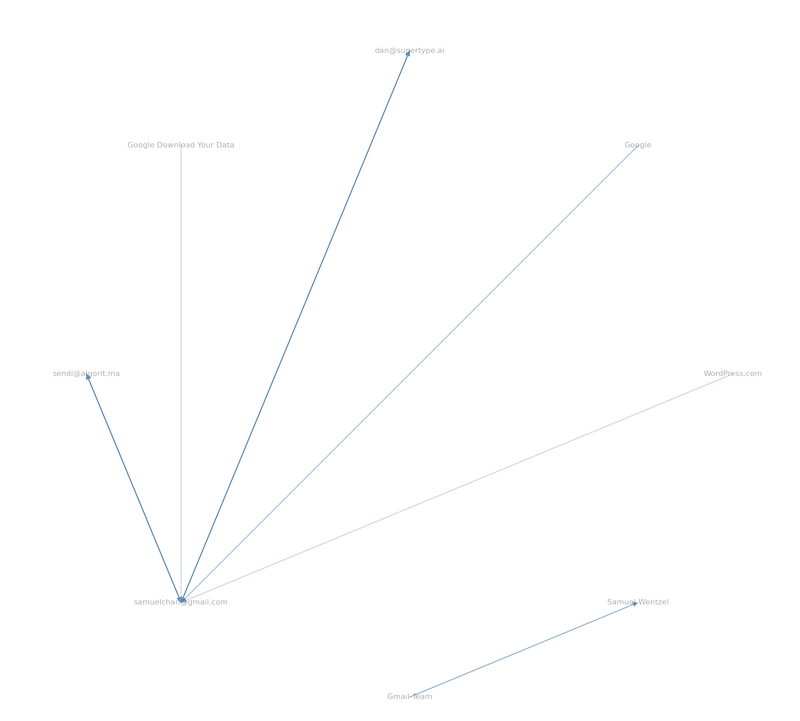
# plot a single directed graph the email at index 3
plot_single_directed(reader,3)
# plot a single undirected graph the email at index 3, show title in plot
plot_single_undirected(reader, 1, showtitle=True)
# plot a directed graph, optionally specifying a layout style
plot_directed(reader)
plot_directed(reader, 'shell')
# optionally export a .graphml to your working directory for use
# in other network / graphing software
plot_undirected(reader, 'spring', graphml=True)
Email Header Analysis
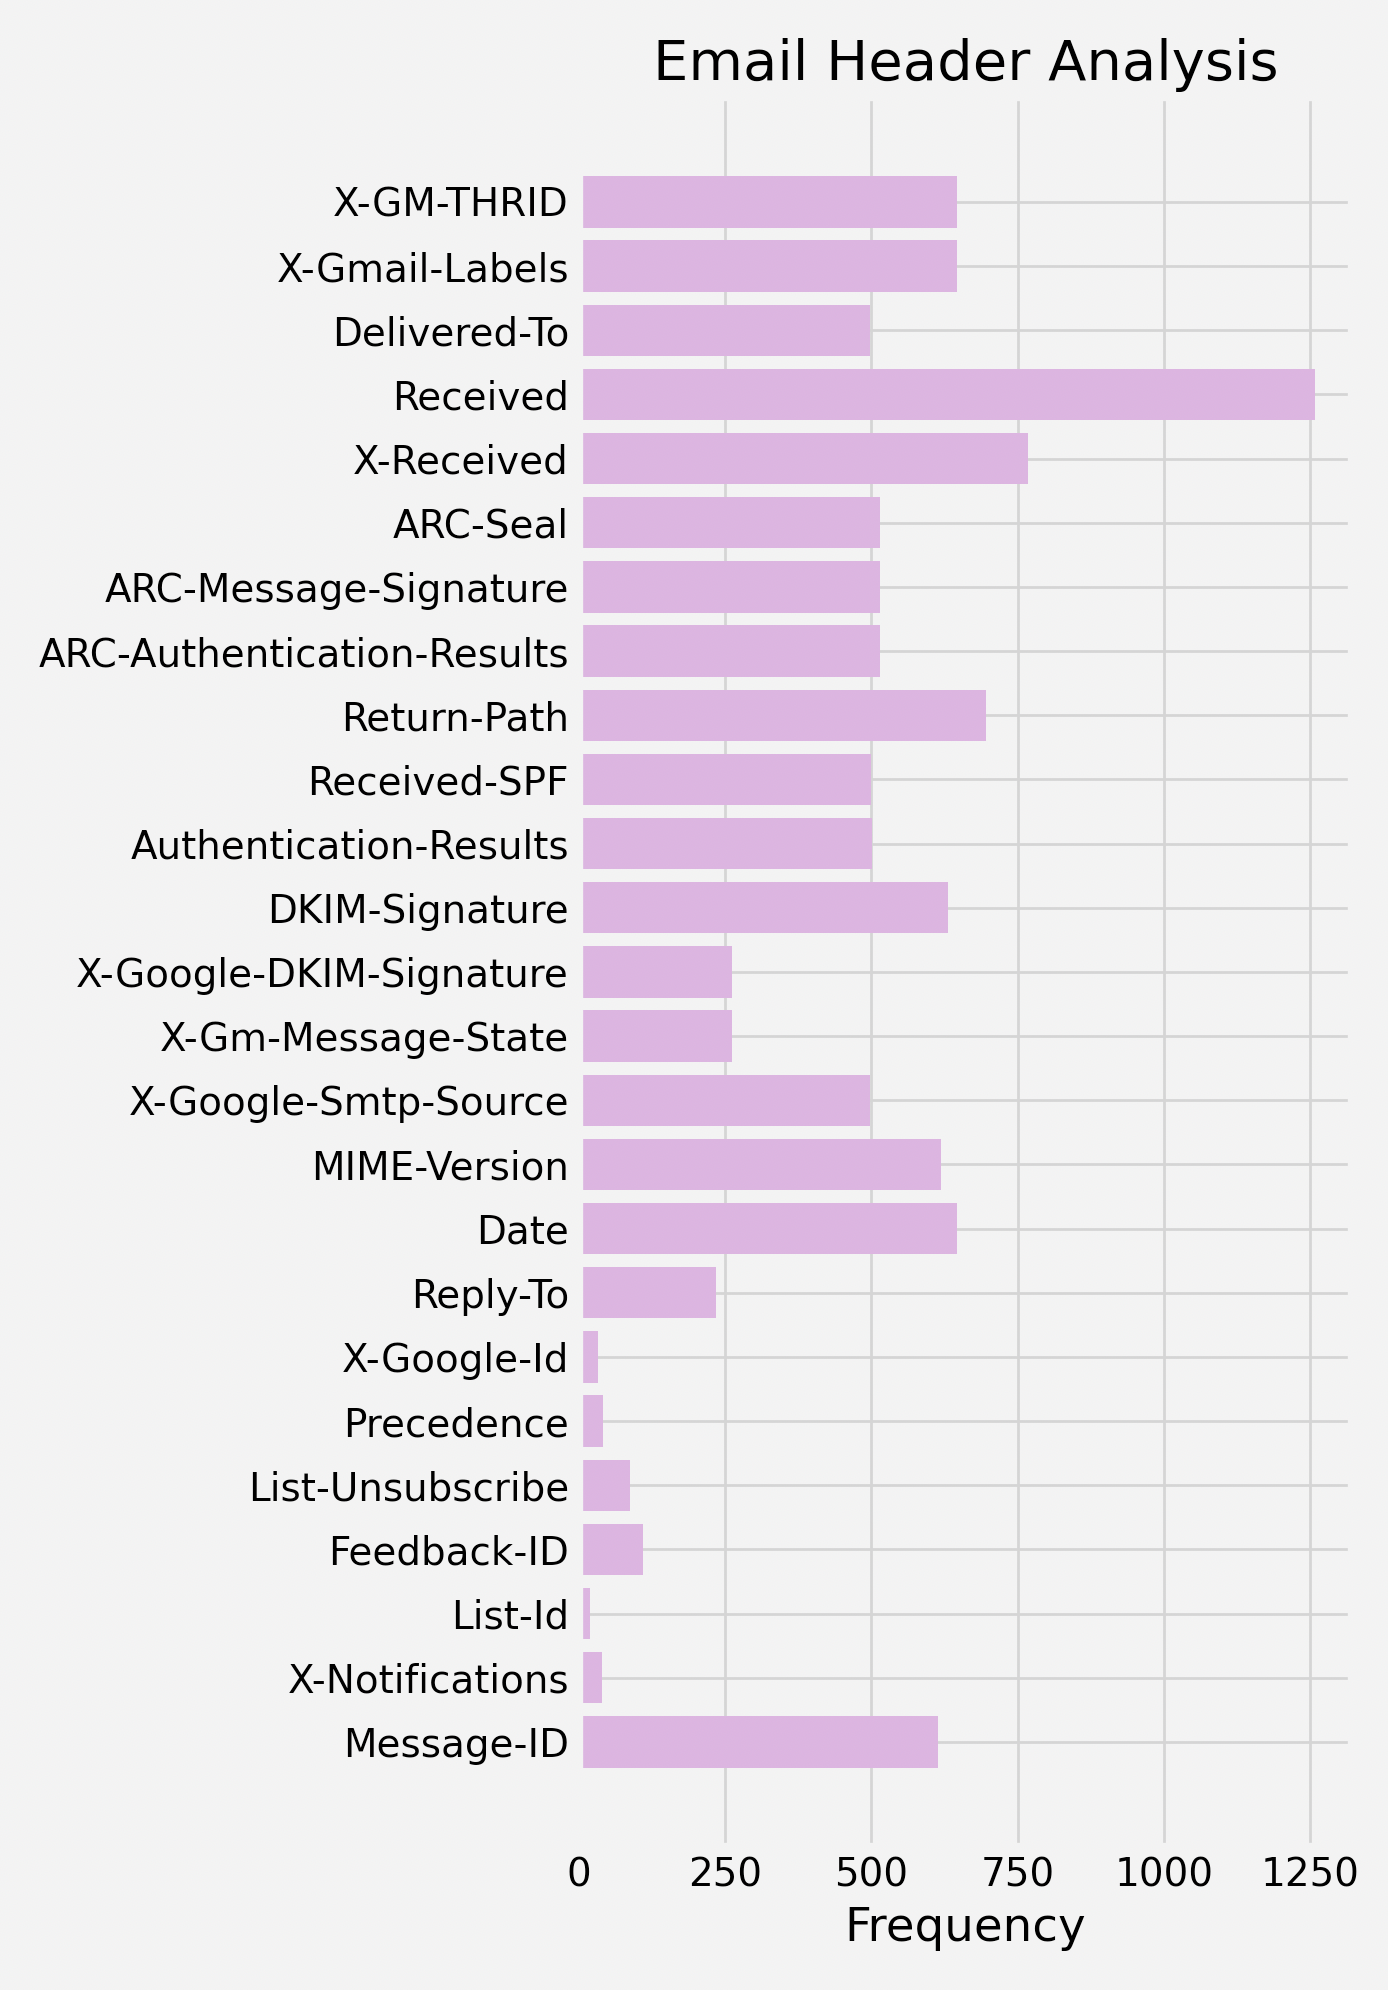 To obtain a histogram:
from emailnetwork.extract import MBoxReader
reader = MBoxReader('path-to-mbox')
headers = HeaderCounter(reader)
headers.histogram()
# to show only top 10 header, set an optional n parameter
# headers.histogram(n=10)
Because HeaderCounter is a subclass of Python's Counter, you can also perform operations such as headers.most_common(8) to get the 8 most-common headers from the mbox file.
If you want to find all email headers with the word "spam" in it (e.g spam score, other antispam mechanism), you can use Python's filter() function:
reader = MBoxReader('path-to-mbox')
headers = HeaderCounter(reader)
spamheaders = list(filter(lambda v: "spam" in v.lower(), headers.keys()))
# return:
# ['X-Spam-Checked-In-Group', 'X-Microsoft-Antispam-PRVS', 'X-Microsoft-Antispam-Untrusted', 'X-Microsoft-Antispam-Message-Info-Original', 'X-Forefront-Antispam-Report-Untrusted', 'x-ms-exchange-antispam-messagedata', 'X-Microsoft-Antispam', 'X-Microsoft-Antispam-Message-Info', 'X-Forefront-Antispam-Report', 'X-Mimecast-Spam-Score', 'x-microsoft-antispam-prvs', 'x-microsoft-antispam', 'x-microsoft-antispam-message-info', 'x-forefront-antispam-report']
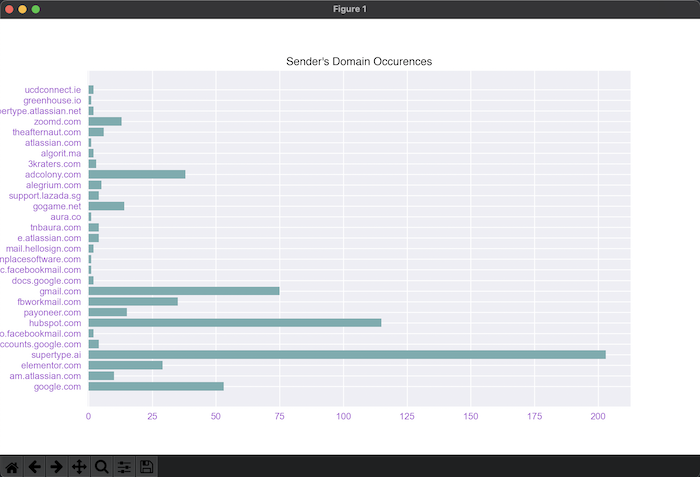
Mailbox Summary
To get a simple barchart on the distribution of email domains in your .mbox, you can create a DomainSummary object and call the .plot() function:
from emailnetwork.summary import DomainSummary
summary = DomainSummary(reader)
summary.plot()
You can also return a Counter() (a subclass of dict) instead of a plot:
summary.summary
# return:
# Counter({'supertype.ai': 203, 'hubspot.com': 115, 'gmail.com': 75, 'google.com': 53, 'adcolony.com': 38, 'fbworkmail.com': 35, 'elementor.com': 29, 'payoneer.com': 15, 'gogame.net': 14, 'zoomd.com': 13, 'am.atlassian.com': 10, 'theafternaut.com': 6, 'alegrium.com': 5, 'accounts.google.com': 4, 'e.atlassian.com': 4, 'tnbaura.com': 4, 'support.lazada.sg': 4, '3kraters.com': 3, 'go.facebookmail.com': 2, 'docs.google.com': 2, 'mail.hellosign.com': 2, 'algorit.ma': 2, 'supertype.atlassian.net': 2, 'ucdconnect.ie': 2, 'mc.facebookmail.com': 1, 'inplacesoftware.com': 1, 'aura.co': 1, 'atlassian.com': 1, 'greenhouse.io': 1})
Why Python 3.7+?
Python 3.7+ is required because the package is written to take advantage of many features of Python 3.7 and above.
Examples of features that were used extensively in the creation of this package:
- Dataclasses, new in Python 3.7
- Insertion-ordered Dictionaries, new in Python 3.7
- Typing (Type hints), new in Python 3.5
- Formatted string literal, new in Python 3.6
Testing
Git clone, and run nosetests. You can also run nosetests with coverage:
nosetests --with-coverage --cover-package=emailnetwork

.........
Name                       Stmts   Miss  Cover
----------------------------------------------
emailnetwork/__init__.py       2      0   100%
emailnetwork/emails.py        55     11    80%
emailnetwork/extract.py       54     11    80%
emailnetwork/graph.py        120     82    32%
emailnetwork/network.py       13      7    46%
emailnetwork/utils.py         32     17    47%
emailnetwork/version.py        1      0   100%
----------------------------------------------
TOTAL                        277    128    54%
----------------------------------------------------------------------
Ran 9 tests in 3.226s

OK
All tests are located in the /tests/ directory.
Authors and Copyright
Samuel Chan, Supertype Supertype
Vincentius Christopher Calvin, Supertype https://supertype.ai
If you find the code useful in your project, please link to this repository in your citation.
The MIT License (MIT)
Copyright (c) 2021 Supertype Pte Ltd
Permission is hereby granted, free of charge, to any person obtaining a copy of this software and associated documentation files (the "Software"), to deal in the Software without restriction, including without limitation the rights to use, copy, modify, merge, publish, distribute, sublicense, and/or sell copies of the Software, and to permit persons to whom the Software is furnished to do so, subject to the following conditions:
- The above copyright notice and this permission notice shall be included in all copies or substantial portions of the Software.
THE SOFTWARE IS PROVIDED "AS IS", WITHOUT WARRANTY OF ANY KIND, EXPRESS OR IMPLIED, INCLUDING BUT NOT LIMITED TO THE WARRANTIES OF MERCHANTABILITY, FITNESS FOR A PARTICULAR PURPOSE AND NONINFRINGEMENT. IN NO EVENT SHALL THE AUTHORS OR COPYRIGHT HOLDERS BE LIABLE FOR ANY CLAIM, DAMAGES OR OTHER LIABILITY, WHETHER IN AN ACTION OF CONTRACT, TORT OR OTHERWISE, ARISING FROM, OUT OF OR IN CONNECTION WITH THE SOFTWARE OR THE USE OR OTHER DEALINGS IN THE SOFTWARE.
Release history Release notifications | RSS feed


Download files
Download the file for your platform. If you're not sure which to choose, learn more about installing packages.
Source Distribution
Built Distribution
Filter files by name, interpreter, ABI, and platform.
If you're not sure about the file name format, learn more about wheel file names.
Copy a direct link to the current filters
File details
Details for the file emailnetwork-0.0.2.tar.gz.
File metadata
- Download URL: emailnetwork-0.0.2.tar.gz
- Upload date:
- Size: 280.0 kB
- Tags: Source
- Uploaded using Trusted Publishing? No
- Uploaded via: twine/3.4.1 importlib_metadata/3.7.3 pkginfo/1.7.0 requests/2.25.1 requests-toolbelt/0.9.1 tqdm/4.57.0 CPython/3.9.1
File hashes
| Algorithm | Hash digest | |
|---|---|---|
| SHA256 |
1a77e72281bd1a9783f3cf646f326906415354b5aea8d381de9da668a96ae975
|
|
| MD5 |
79bd3ffbe8f69306be1b771a12ce6e37
|
|
| BLAKE2b-256 |
8884556c803aeddfeb18072991d7d33f75b8a8b0e148049be38f3e0f30b2b39c
|
File details
Details for the file emailnetwork-0.0.2-py3-none-any.whl.
File metadata
- Download URL: emailnetwork-0.0.2-py3-none-any.whl
- Upload date:
- Size: 281.1 kB
- Tags: Python 3
- Uploaded using Trusted Publishing? No
- Uploaded via: twine/3.4.1 importlib_metadata/3.7.3 pkginfo/1.7.0 requests/2.25.1 requests-toolbelt/0.9.1 tqdm/4.57.0 CPython/3.9.1
File hashes
| Algorithm | Hash digest | |
|---|---|---|
| SHA256 |
308738c824386a5d15f48725c36ceb84c6b341b67d0eded85f491ff827c51d07
|
|
| MD5 |
7d7bd93fba6b45033d157f248905abfb
|
|
| BLAKE2b-256 |
4398675c5e867665924db07b95536577379bb2b87fa6cb3cbfeafce400c75f83
|


