A tool for plotting Energy Diagrams using Matplotlib.

Project description
PyEnergyDiagrams

energydiagram Python module for plotting energy profile diagrams using Matplotlib.
Installation
If you are new to Python, the easiest way to get started is to use a distribution like Anaconda. Then you can use the terminal to install the module using pip:
pip install energydiagram
For installing the development version:
pip install git+https://github.com/giacomomarchioro/PyEnergyDiagrams
The only requirement is matplotlib, which is installed by default using Anaconda.
How to use it?
from energydiagram import ED
diagram = ED()
diagram.round_energies_at_digit = 2
diagram.bottom_text_fontsize = 'small'
diagram.top_text_fontsize = 'small'
diagram.offset = 2
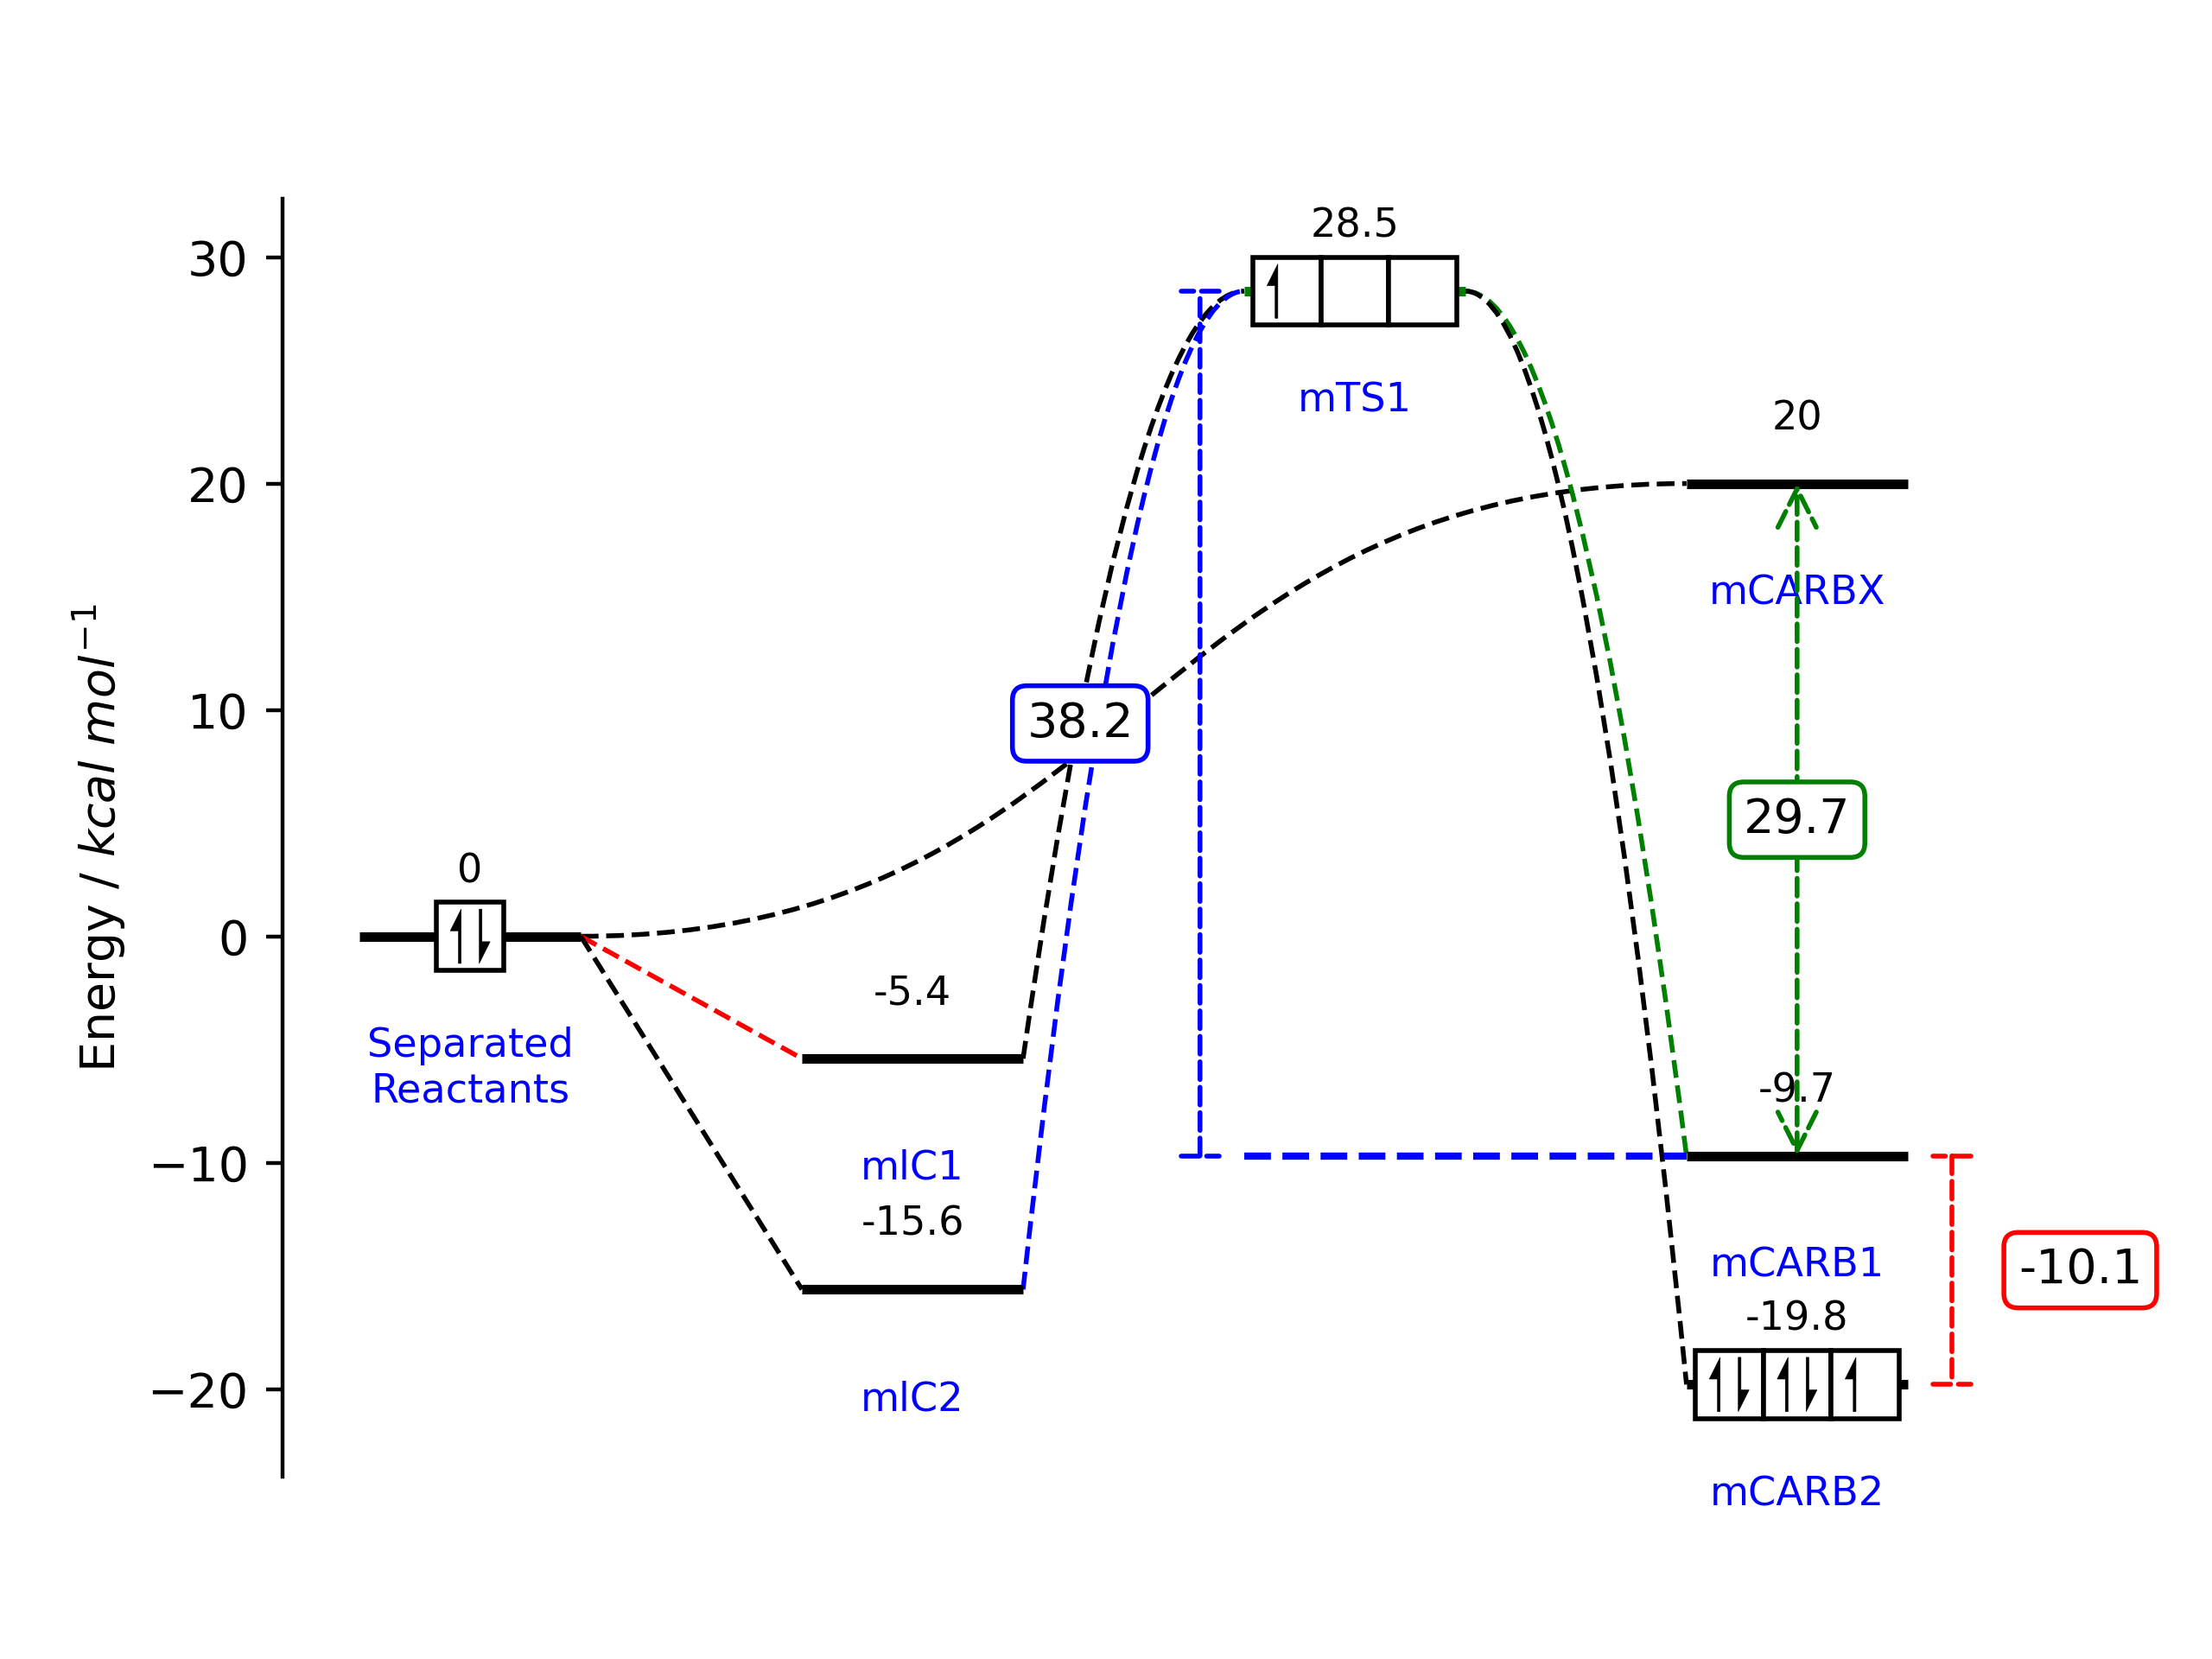
diagram.add_level(0, 'Separated\nReactants')
diagram.add_level(-5.4, 'mlC1')
diagram.add_level(-15.6, 'mlC2', 'last',) #Using 'last' or 'l' it will be together with the previous level
diagram.add_level(28.5, 'mTS1', color='g')
diagram.add_level(-9.7, 'mCARB1')
diagram.add_level(-19.8, 'mCARB2', 'last')
diagram.add_level(20, 'mCARBX', 'last')
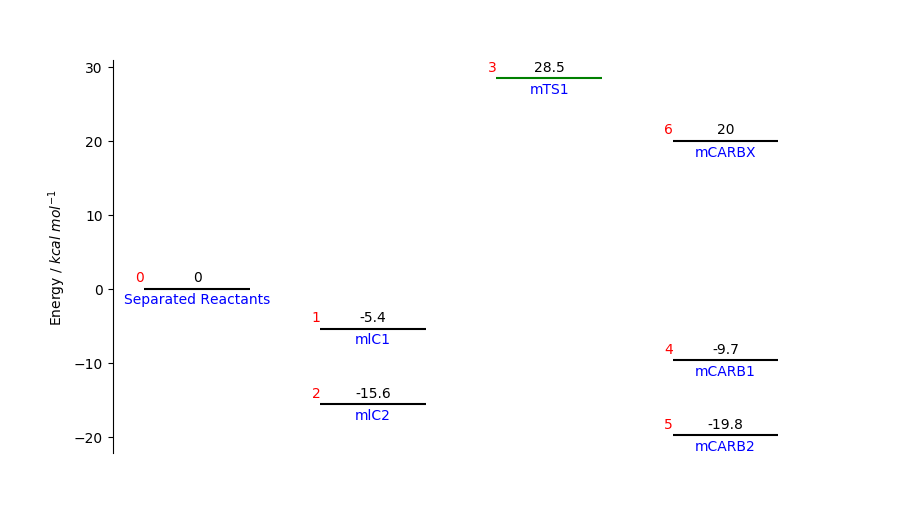
Show the IDs (red numbers) to understand how to link the levels:
diagram.plot(show_IDs=True)
Add the links using diagram.add_link(starting_level_ID,ending_level_ID):
diagram.add_link(0, 1, color='r')
diagram.add_link(0, 2)
diagram.add_link(2, 3, color='b', line_order=2)  # change line order to make a curved link
diagram.add_link(1, 3, line_order=2)
diagram.add_link(3, 4, color='g', line_order=2)
diagram.add_link(3, 5, line_order=2)
diagram.add_link(0, 6, line_order=3)
# now we create the plot, this will update the figure
diagram.plot(ylabel="Energy / $kcal$ $mol^{-1}$") # this is the default ylabel
To show it you can use diagram.fig.show() while for saving it use diagram.fig.savefig('myEnergyDiagra.pdf').
Electron boxes
The electron boxes can be added using:
diagram.add_electronbox(level_id=0, boxes=1, electrons=2, side=3, spacing_f=3)
diagram.add_electronbox(3, 3, 1, 3, 3)
diagram.add_electronbox(5, 3, 5, 3, 3)
The electron spin is automatically changed following the aufbau principle.
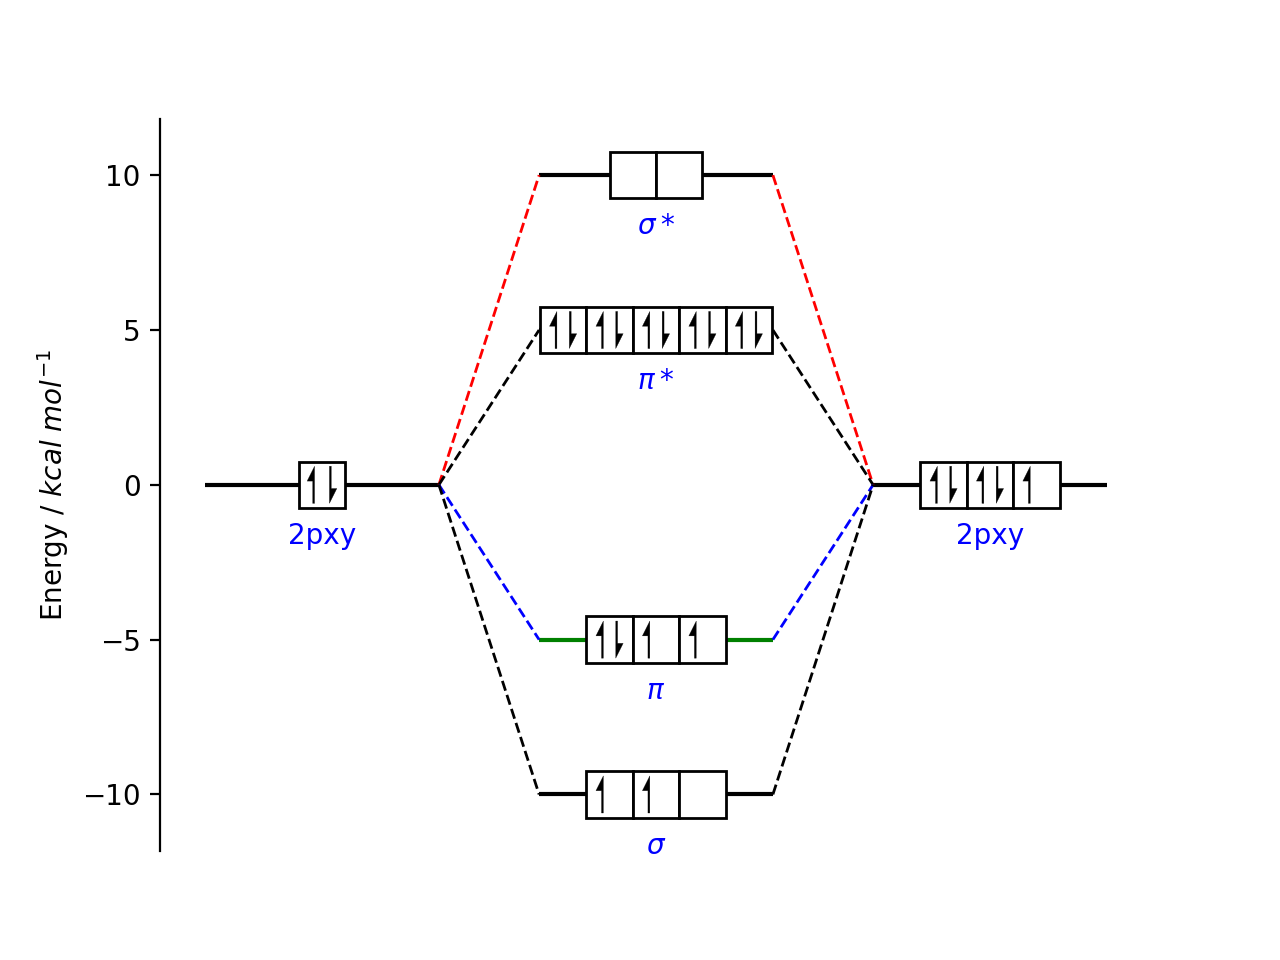
from energydiagram import ED
diagram2 = ED()
diagram2.add_level(0,'2pxy',top_text='')
diagram2.add_level(10,r'$\sigma*$',top_text='')
diagram2.add_level(5,r'$\pi*$','last',top_text='')
diagram2.add_level(-5,r'$\pi$','last',color='g',top_text='')
diagram2.add_level(-10,r'$\sigma$',top_text='',position='l')
diagram2.add_level(0,'2pxy',top_text='')
for i in range(1,5):
    diagram2.add_link(0,i,color='g')
    diagram2.add_link(i,5,color='b')
diagram2.add_electronbox(level_id=0, boxes=1, electrons=2, side=1.5, spacing_f=2.5)
diagram2.add_electronbox(1,2,0,1.5,3)
diagram2.add_electronbox(2,5,10,1.5,3)
diagram2.add_electronbox(3,3,4,1.5,3)
diagram2.add_electronbox(4,3,2,1.5,3)
diagram2.add_electronbox(5,3,5,1.5,3)
diagram2.offset *= 1.5
diagram2.plot()
Arrows between levels
You can caluclate the energy betwen two layers and show arrows using:
diagram.add_arrow(3, 4, position='left', color='blue')
diagram.add_arrow(6, 4, position='center')
diagram.add_arrow(5, 4, position='right', color='r')
Troubleshooting and fine-tuning
Most of the time, there could be a problem with text padding. Some parameters can be changed in this way.
diagram.offset = 10
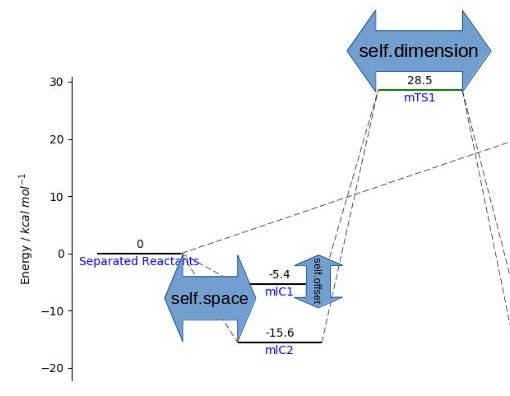
To make the change effective, you must use the command diagram.plot() again. Remember that once you have made a first attempt at plotting. You can adjust the plot as every matplotlib plot. For convenience you can access ax and fig from the instance of the class.
# we adjust some parameters
diagram.ax.set_ylabel('My label')
diagram.fig.set_figwidth(10)
# don't want tikcs on the y label
diagram.ax.set_yticks([])
# I want to show on the x axis instead
diagram.ax.axes.get_xaxis().set_visible(True)
diagram.ax.spines['bottom'].set_visible(True)
diagram.ax.set_xlabel("My x label")
# we replot the figure (sometimes we have to resize with the mouse the figure so we force to refresh)
# diagram.fig.show()
If you use the command diagram.plot() now all the changes will be overwritten, so these minor adjustment must be done after.
Testing
python3.12 -m unittest tests/test_energydiagram.py
Contributors
Thanks to Kalyan Jyoti Kalita for the arrow functionality and O2-AC, agrass15268 for bug fixing.
Release history Release notifications | RSS feed

Download files
Download the file for your platform. If you're not sure which to choose, learn more about installing packages.
Source Distribution
Built Distribution
Filter files by name, interpreter, ABI, and platform.
If you're not sure about the file name format, learn more about wheel file names.
Copy a direct link to the current filters
File details
Details for the file energydiagram-1.0.0.tar.gz.
File metadata
- Download URL: energydiagram-1.0.0.tar.gz
- Upload date:
- Size: 11.3 kB
- Tags: Source
- Uploaded using Trusted Publishing? No
- Uploaded via: twine/6.1.0 CPython/3.12.9
File hashes
| Algorithm | Hash digest | |
|---|---|---|
| SHA256 |
b9f4c5fad83221a15a51ce740ff9271e8125fb00e54eaf3c7d42ea58b3201d11
|
|
| MD5 |
960c18ac12feb55b3d14addd9a70d360
|
|
| BLAKE2b-256 |
c160d83f99d524988b378eb9bbb9086e5789b30473e20f37da2ae2b1b0911372
|
File details
Details for the file energydiagram-1.0.0-py3-none-any.whl.
File metadata
- Download URL: energydiagram-1.0.0-py3-none-any.whl
- Upload date:
- Size: 9.8 kB
- Tags: Python 3
- Uploaded using Trusted Publishing? No
- Uploaded via: twine/6.1.0 CPython/3.12.9
File hashes
| Algorithm | Hash digest | |
|---|---|---|
| SHA256 |
c8900ee9e149f75ce649f2c2a6aff6ca43766987d06e6bc55706e5435a169b49
|
|
| MD5 |
7d86922c04f41dd1b2f8913faa5ba1b5
|
|
| BLAKE2b-256 |
c3288d6f14a288197050bb603e3e9ba6067bf580d50d371562b5db3679cefab9
|


