
entroscope






The definitive entropy toolkit for time series data. Nine entropy measures, one consistent interface, working directly on pandas and polars Series and numpy arrays. Results are validated against antropy, EntropyHub and scipy.
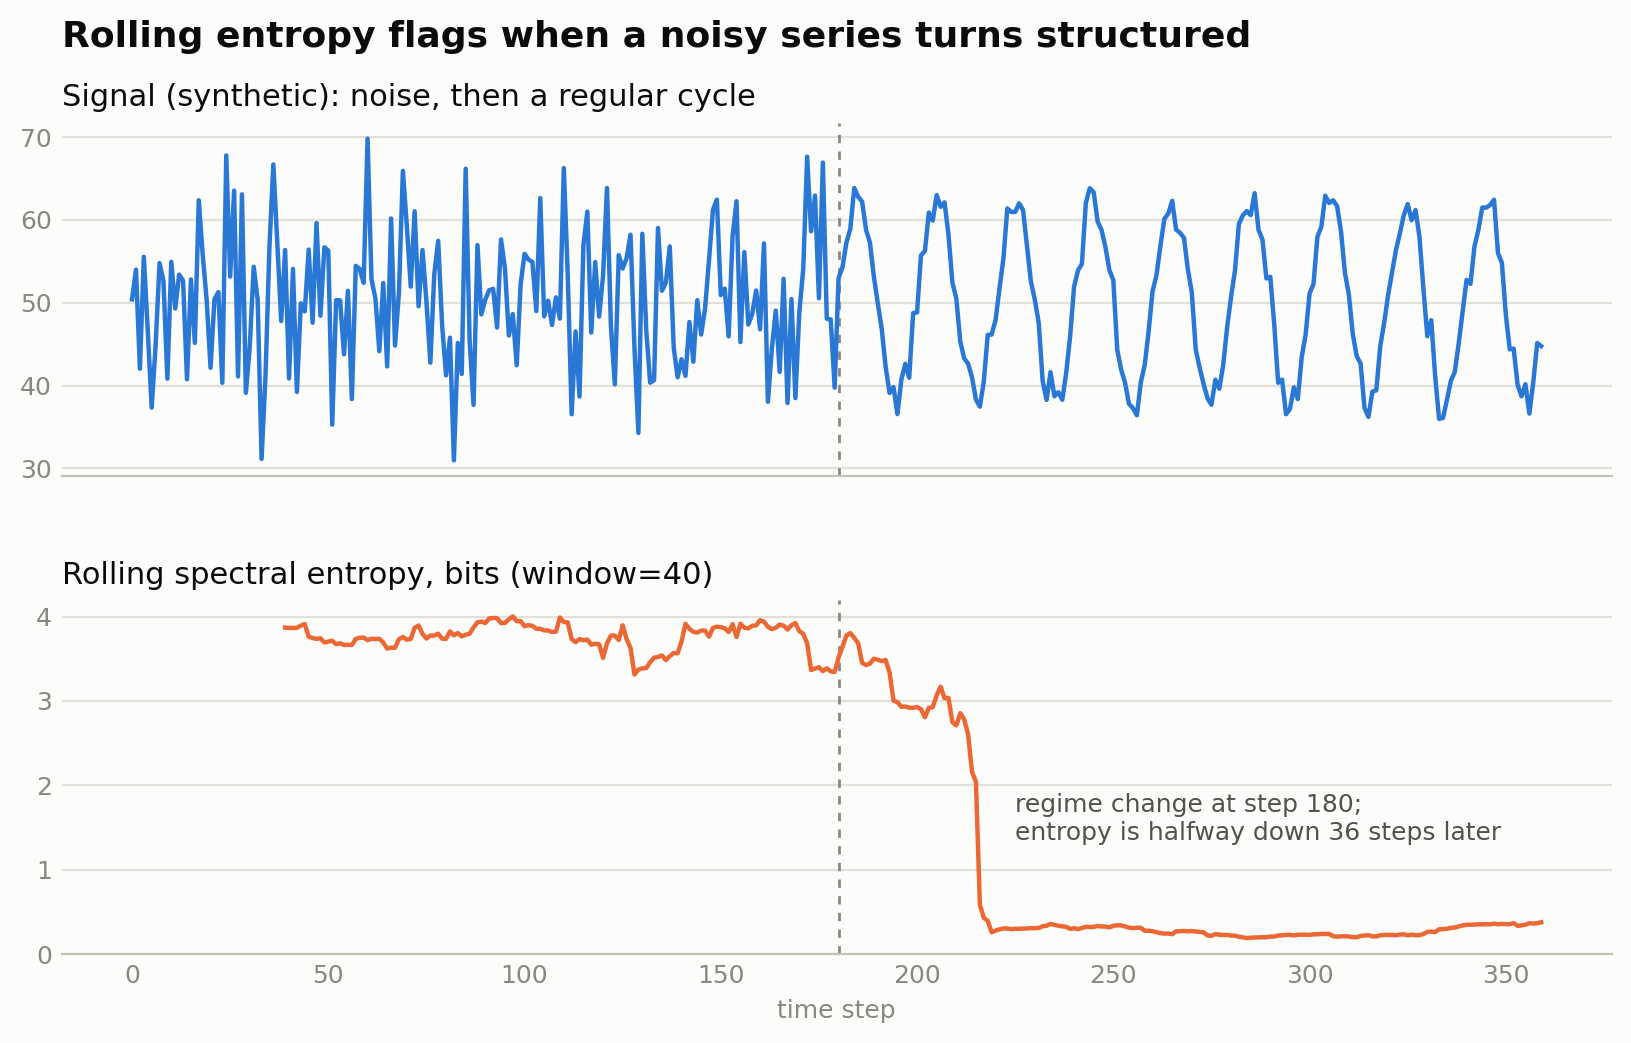
It started in NextOnMenu: a falling Shannon entropy of a food's regional search interest turned out to be an early signal that it was about to trend. Computing it meant re-writing the same histogram-and-log boilerplate every time. entroscope is that code, written once.
pip install entroscope
Quick start
import pandas as pd
from entroscope import shannon

s = pd.Series([10, 20, 15, 80, 90, 85, 88, 92])

shannon.compute(s)              # 1.75 (a single entropy value, in bits)
shannon.rolling(s, window=20)   # rolling entropy over time (a Series)
shannon.delta(s, window=20)     # rate of change of entropy
shannon.normalized(s)           # entropy scaled to [0, 1]
shannon.plot(s, window=20)      # a matplotlib Figure
Every method accepts a pd.Series or a np.ndarray. Pass a Series and you
get a Series back with its index preserved; pass an array and you get an array.
Headless environments (Docker, CI)
entroscope does not change your matplotlib backend on import, so interactive
plotting in notebooks keeps working. In a headless environment (a Docker
container or CI runner) where you want a guaranteed non-interactive backend, set
the standard environment variable:
export MPLBACKEND=Agg # or, in a Dockerfile: ENV MPLBACKEND=Agg
The nine measures
| Measure | Import | Captures |
|---|---|---|
| Shannon | entroscope.shannon |
Uncertainty in a binned distribution |
| Permutation | entroscope.permutation |
Ordinal-pattern complexity (robust to noise) |
| Sample | entroscope.sample |
Regularity / predictability |
| Approximate | entroscope.approximate |
Regularity (less noise-sensitive, faster) |
| Spectral | entroscope.spectral |
Spread of the power spectrum (frequency domain) |
| Differential | entroscope.differential |
Continuous entropy via a fitted distribution |
| Multiscale | entroscope.multiscale |
Sample entropy across coarse-grained time scales |
| Transfer | entroscope.transfer |
Directional information flow X → Y (KSG/binned) |
| Divergence | entroscope.divergence |
KL and Jensen-Shannon distance between samples |
One consistent API
Every measure exposes the same methods, so switching measures is a one-word change:
| Method | Input | Returns |
|---|---|---|
compute(x, **params) |
Series or ndarray | float |
rolling(x, window, **params) |
Series or ndarray | Series/ndarray, same length (NaN warm-up) |
delta(x, window, **params) |
Series or ndarray | Series/ndarray (first difference) |
normalized(x, **params) |
Series or ndarray | float in [0, 1] (shannon/permutation/spectral only) |
plot(x, window, **params) |
Series or ndarray | matplotlib.figure.Figure |
Shannon additionally provides geographic(df, col=...) for spatial distributions
(e.g. search interest by region). Multiscale provides compute and plot.
The two-input measures take a pair of series. transfer.compute(x, y) (plus
rolling, delta, plot) estimates how much x's past tells you about y's
future; divergence.kl(p, q) and divergence.js(p, q) (plus plot) compare two
samples' distributions over shared bins.
Visualization
from entroscope import plot

# overlay several measures on one axis
plot.compare(s, measures=["shannon", "permutation", "spectral"], window=20)

# a grid of every measure at once
plot.dashboard(s, window=20)

# highlight where entropy drops sharply (trend / regime-change detection)
plot.drop_events(s, measure="shannon", window=20, threshold=0.4)
All plot functions return a matplotlib.figure.Figure and never call
plt.show(), so they're safe in scripts, notebooks, and CI alike.
Integrations
polars: pass a polars Series anywhere a pandas Series works; rolling and delta results come back as a polars Series with the same name.
scikit-learn: EntropyFeatures turns time-series windows into entropy
features inside a pipeline:
from sklearn.ensemble import RandomForestClassifier
from sklearn.pipeline import make_pipeline
from entroscope.features import EntropyFeatures

# windows: shape (n_windows, window_length); one row per window
model = make_pipeline(EntropyFeatures(), RandomForestClassifier())
model.fit(windows, labels)
Install the optional dependencies with pip install "entroscope[sklearn]" or
"entroscope[polars]". See the integrations guide.
Validated results
Every measure is checked against an independent implementation, on every CI run:
| Measure | Checked against |
|---|---|
| sample, approximate, permutation | antropy and EntropyHub: exact match (< 1e-10) |
| spectral | antropy: exact match |
| multiscale | EntropyHub MSEn: exact match |
| shannon, differential (normal) | scipy: exact match |
| transfer | analytic Gaussian closed form and Kraskov (2004) |
Details, including two definitions corrected along the way, are in
docs/validation.md. Run the checks yourself with
pip install -e ".[dev,reference]" && pytest tests/test_reference.py.
Real-world examples
Runnable scripts live in examples/; worked write-ups are in
docs/examples/:
- Food trends: detect when search interest stops being random (the original NextOnMenu use case).
- Finance: market uncertainty via permutation and spectral entropy.
- Medical: HRV, EEG seizure onset, respiration, and continuous glucose.
- Business: sales demand, web-traffic anomalies, price volatility, and manufacturing QC.
# food-trend analysis: entropy drops before a trend goes mainstream
import pandas as pd
from entroscope import shannon

matcha = pd.read_csv("matcha_trends.csv")["interest"]
shannon.plot(matcha, window=20, title="Matcha entropy over time")
A sustained drop in rolling entropy means a signal is becoming structured rather than noisy, an early indicator of a forming pattern.
Requirements
Python 3.9+, with numpy, pandas, scipy, and matplotlib (installed automatically).
Contributing
Contributions are welcome. See CONTRIBUTING.md for setup, the test/lint commands, and how to add a new entropy measure.
License
1 maintainer

Release files for entroscope 0.3.0
For a detailed explanation of source distributions (sdists) and built distributions (wheels), please see the package formats documentation.
Source distribution (sdist)
| File | Size | Uploaded | |
|---|---|---|---|
| entroscope-0.3.0.tar.gz | 35.1 kB | Details |
Built distribution (wheel)
| File | Interpreter | ABI | Platform | Reset |
|---|---|---|---|---|
| entroscope-0.3.0-py3-none-any.whl | Python 3 | none | any | Details |
Total release size: 58.4 kB
Release files / entroscope-0.3.0.tar.gz
| Download URL | entroscope-0.3.0.tar.gz |
|---|---|
| Size | 35.1 kB |
| Tags | Source |
|
SHA-256 checksum How to use checksums |
b23a3d9ee94ae14cfa43b69d54d798d78fb12035b962e69b3c5ab85b8df73b1f
|
|
BLAKE2b-256 checksum How to use checksums |
d69c10accc042aae3078195975788bd2afcdd2f54b8bd1633ac8313fecc7aae8
|
| Upload date | |
|
Uploaded using Trusted Publishing? What is trusted publishing? |
No |
| Uploaded via |
twine/6.2.0 CPython/3.13.5
|
Release files / entroscope-0.3.0-py3-none-any.whl
| Download URL | entroscope-0.3.0-py3-none-any.whl |
|---|---|
| Size | 23.3 kB |
| Tags | Python 3 |
|
SHA-256 checksum How to use checksums |
e82b47a3bbb4de008a9adcb121161193b8d39584ff272017de9500865306a3d3
|
|
BLAKE2b-256 checksum How to use checksums |
77a904f2178db7f5ca7f5585898b8c3d17fa3d3e2be35b15aeb0e3e319037316
|
| Upload date | |
|
Uploaded using Trusted Publishing? What is trusted publishing? |
No |
| Uploaded via |
twine/6.2.0 CPython/3.13.5
|














