A library to create interactive maps of geographical datasets.

Project description


EOmaps - Interactive maps in python!
EOmaps is a python package to visualize and analyze geographical datasets.
It is built on top of matplotlib and cartopy and aims to provide an intuitive and easy-to-use interface to speed up and simplify the creation and comparison of maps.
- Visualize small datasets as well as millions of datapoints
- Handle 1D and 2D datasets with the same interface and create plots from NetCDF, GeoTIFF or CSV files
- Take care of re-projecting the data
- Compare, combine or (transparently) overlay multiple plot-layers
- Turn the maps into interactive data-analysis widgets with a few lines of code
- Provide a versatile set of tools to customize the maps (Features, WebMaps, Markers, Annotations etc.)
- Simplify the process of composing multiple maps (and other plots/images) in a single figure
- Export high resolution images (png, jpeg etc.)
🔨 Installation
To install EOmaps (and all its dependencies) via the conda package-manager, simply use:
conda install -c conda-forge eomaps
... to get a huge speedup, use mamba to solve the dependencies!
conda install -c conda-forge mamba
mamba install -c conda-forge eomaps
Need more information?
- Have a look at the 🐛Installation instructions in the docs.
- Checkout the quickstart guide 🚀 From 0 to EOmaps.
📖 Documentation
Make sure to have a look at the 🌳 Documentation 🌳 which provides a lot of 🌐Examples on how to create awesome interactive maps (incl. 🐍 source code)!
✔️ Citation
Did EOmaps help in your research?
Support the development and add a citation to your publication!
🌟 Contribute
Found a bug or got an idea for an interesting feature?
Open an issue or start a discussion, and I'll see what I can do!
Interested in actively contributing to the library? Awesome!
- Any contributions are welcome!
- New features (or ideas for new features)
- Enhancements for existing features
- Bug-fixes, code-style improvements, unittests etc.
- Documentation updates
- Outreach (e.g. blog-posts, tutorials, talks ... )
- Have a look at existing Issues or this 🌟 overview project to see where EOmaps could use your help.
- Get in touch by opening a discussion in the 🐜 Contribution section!

|
|

|

|

|

|
|

|

|
|
🌳 Basic usage
Checkout the 🚀 Basics in the documentation!
from eomaps import Maps
import numpy as np
# --- Create some random data
x, y = np.meshgrid(range(-50, 40, 5), range(-20, 50, 3))
data = np.random.randint(-100, 100, x.shape)
### Initialize Maps object
m = Maps(layer="all", crs=Maps.CRS.Orthographic(), figsize=(12, 8))
m.add_feature.preset.coastline() # Add a map-feature from NaturalEarth
### Plot a dataset
m_data = m.new_layer("data") # create a new layer
m_data.set_data(data=data, x=x, y=y, crs=4326) # assign a dataset
m_data.set_shape.ellipses() # set how to represent the data-points
m_data.set_classify.FisherJenks(k=6) # classify the data
m_data.plot_map(cmap="viridis", vmin=-100, vmax=100, set_extent=False) # plot the data
m_data.add_colorbar(hist_bins="bins", label="What a nice colorbar") # add a colorbar
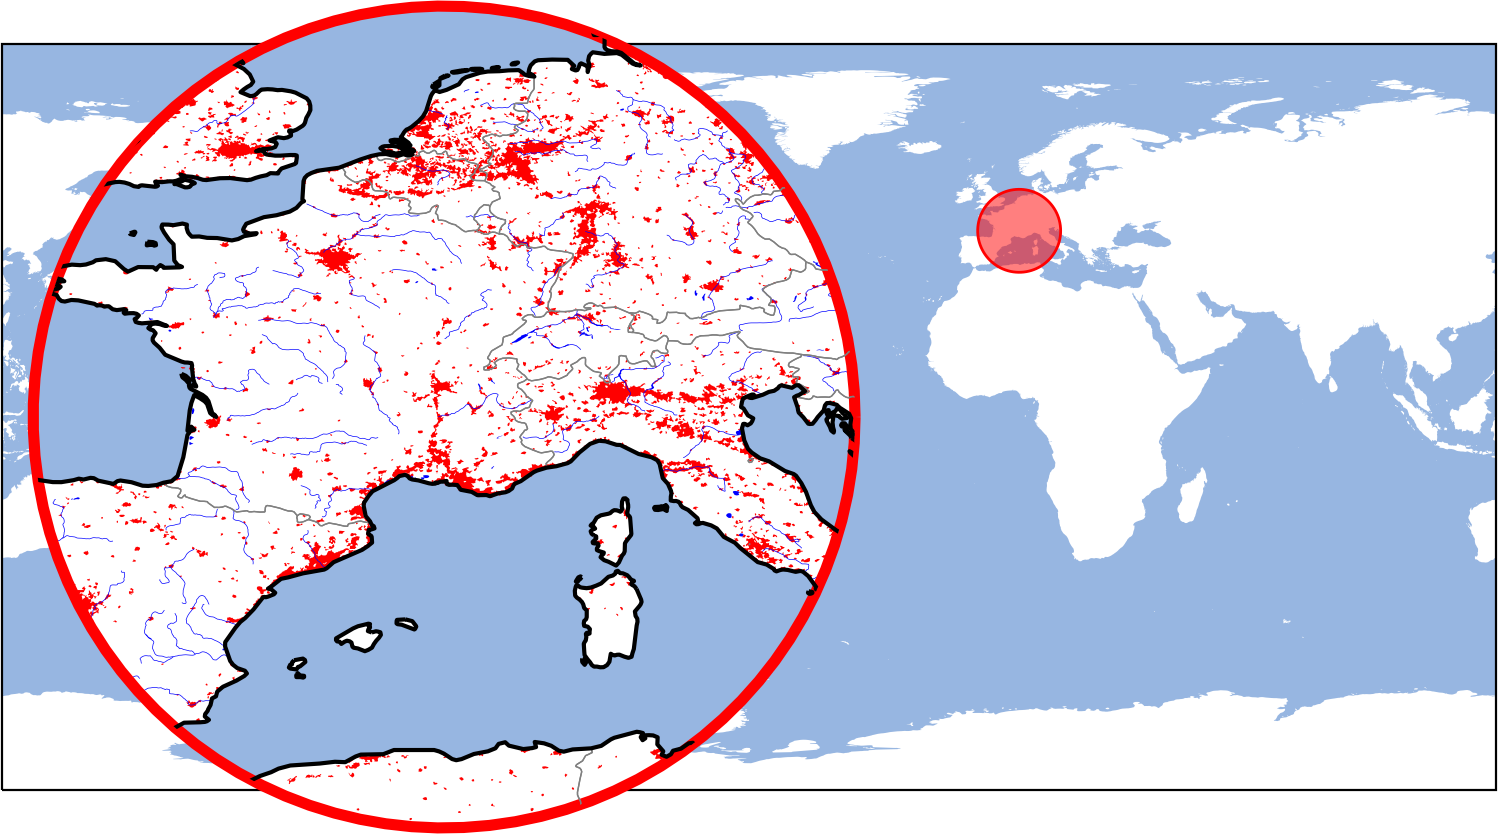
### Add zoomed-in "inset-maps" to highlight a specific area on th map
m_inset = m.new_inset_map((10, 45), radius=10, layer="data", plot_position=(.2, .6))
m_inset.inherit_data(m_data) # inherit the data
m_inset.inherit_classification(m_data) # inherit the classification
m_inset.plot_map(zorder=1) # plot the data on the inset-map as well
m_inset.add_feature.preset.ocean(zorder=2) # overlay some features from NaturalEarth
m_inset.add_feature.preset.coastline(zorder=3)
### Add imagery from open-access WebMap services
m_inset.add_wms.OpenStreetMap.add_layer.stamen_watercolor()
### Add a scalebar
s = m_inset.add_scalebar(lon=15.15, lat=44.45,
autoscale_fraction=.4,
scale_props=dict(n=6),
label_props=dict(scale=3, every=2),
patch_props=dict(lw=0.5, fc="w"))
### Add a compass (or north-arrow)
c = m_inset.add_compass(pos=(12.2, 51.6), pos_transform="lonlat")
### Compare and analyze multiple plot-layers
m2 = m.new_layer(layer="ocean") # create another layer
m2.add_feature.preset.ocean() # populate the layer
# ... or use the (layer argument to directly put a feature on a specific layer)
m.add_feature.cultural.admin_0_countries(
layer="overlay", scale=50, fc="none", ec="g", lw=0.3)
# Get a clickable widget to switch between the available plot-layers
m.util.layer_selector(loc="upper center")
# Transparently overlay the "ocean" layer on top of the "data" layer
m.show_layer("data", ("ocean", 0.8))
# ---- Attach callback functions to interact with the map
# (Note: you can also define custom callbacks!)
### CLICK callbacks are executed if you click anywhere on the map
m.cb.click.attach.peek_layer(layer="overlay", how=0.4)
m.cb.click.attach.mark(shape="geod_circles", radius=5e5, button=3, fc="r")
# Use keypress-modifiers to trigger callbacks only if a button is pressed
m.cb.click.attach.annotate(modifier="a")
### PICK callbacks identify the closest datapoint of a dataset
m_data.cb.pick.attach.annotate(text=lambda val, **kwargs: f"value = {val:.2f}")
m_inset.cb.pick.attach.annotate()
### KEYPRESS callbacks are executed if you press a key on the keyboard
# (using "m.all" ensures that the cb triggers irrespective of the visible layer)
m.all.cb.keypress.attach.switch_layer(layer="data", key="1")
m.all.cb.keypress.attach.switch_layer(layer="data|ocean", key="2")
### Reposition axes based on a pre-defined layout (check m.get_layout())
m.apply_layout(
{'figsize': [12.0, 8.0],
'0_map': [0.44306, 0.25, 0.48889, 0.73333],
'1_cb': [0.115, 0.0, 0.775, 0.23377],
'1_cb_histogram_size': 0.8,
'2_inset_map': [0.03335, 0.35, 0.33329, 0.5]}
)
### Plot data directly from GeoTIFF / NetCDF or CSV files
#m4 = m.new_layer_from_file.GeoTIFF(...)
#m4 = m.new_layer_from_file.NetCDF(...)
#m4 = m.new_layer_from_file.CSV(...)
🌼 Thanks to
- Jakob Quast for designing the nice logo!
Release history Release notifications | RSS feed


Download files
Download the file for your platform. If you're not sure which to choose, learn more about installing packages.
Source Distribution
Built Distribution
Filter files by name, interpreter, ABI, and platform.
If you're not sure about the file name format, learn more about wheel file names.
Copy a direct link to the current filters
File details
Details for the file EOmaps-6.1.2.tar.gz.
File metadata
- Download URL: EOmaps-6.1.2.tar.gz
- Upload date:
- Size: 422.0 kB
- Tags: Source
- Uploaded using Trusted Publishing? No
- Uploaded via: twine/4.0.2 CPython/3.7.15
File hashes
| Algorithm | Hash digest | |
|---|---|---|
| SHA256 |
d5f1fa8e34cbb3c5d088cc90a37947a3204ad70ddf0e39338f166de396714203
|
|
| MD5 |
da4a16965e59563d311a318d40abd99f
|
|
| BLAKE2b-256 |
83b5de4432cae7dca71dbca9a58ad4a979bf8661a5ea8620f7c21fdf7e19f3f2
|
File details
Details for the file EOmaps-6.1.2-py3-none-any.whl.
File metadata
- Download URL: EOmaps-6.1.2-py3-none-any.whl
- Upload date:
- Size: 440.0 kB
- Tags: Python 3
- Uploaded using Trusted Publishing? No
- Uploaded via: twine/4.0.2 CPython/3.7.15
File hashes
| Algorithm | Hash digest | |
|---|---|---|
| SHA256 |
d55a8cddfd4d1f89de08c9f3c1b4eacca4f2959133d0d3567b58bc8f64b1bd7f
|
|
| MD5 |
36b6b626c42157f4ca49a0957697b10b
|
|
| BLAKE2b-256 |
d948264901fd30884353d4ac9429ce1143a3899038c1b38c0587e11dd2a4e521
|


