Faithful Python port of the core Moving Epidemic Method (MEM) from the R 'mem' package

Project description
epimem
A Python port of the core Moving Epidemic Method (MEM) from the R package
lozalojo/mem by José E. Lozano.
MEM learns warning thresholds for a weekly seasonal indicator (for example, influenza incidence rates) from past complete seasons: an epidemic-onset line, plus three intensity lines (medium, high, very high). Each new week is then graded against them. MEM is unit-agnostic: it accepts any weekly indicator (a rate per 100,000, a percent share, a raw count), and the thresholds come out in that same unit. This port also includes the auto-tuner and the surveillance companion functions.
| Function | What it does |
|---|---|
mem_model |
the epidemic-onset and intensity thresholds (the core) |
mem_intensity |
the four cut-points, labelled (Epidemic, Medium (40%), and so on) |
mem_trend |
a rising or falling signal from week-over-week changes |
mem_goodness |
how good a setting is, by leave-one-season-out cross-validation |
roc_analysis |
the auto-tuner: sweep the slope and pick the best value for the seasons |
optimum_by_inspection |
tune the slope against analyst-marked epidemics |
mem_stability |
how much the thresholds move as seasons accumulate |
mem_evolution |
how the thresholds would have looked season by season (real-time, or leave-one-out) |
Each function reproduces R mem on its own flucyl data, the core thresholds to machine precision
(see Fidelity below).
Not affiliated with or endorsed by the original author. This is an independent re-implementation for use where R is not available.
Install
Needs Python 3.11 or later. From a clone of this repo:
pip install -e .            # core: numpy + scipy only
pip install -e ".[plot]"    # adds matplotlib, for the chart
The core depends only on numpy and scipy. Charting (epimem.plot) is an optional extra.
Quickstart
from epimem import mem_model, example_seasons

# Bundled demo data, so this runs as-is: 8 past influenza seasons of weekly ILI rates
# (cases per 100,000), from R mem's flucyl. Any 2-D array works in its place, shaped
# the same way: one column per season, one row per week.
season_matrix = example_seasons()
print(season_matrix.shape)                   # (33, 8): 33 weeks, 8 seasons

model = mem_model(season_matrix)             # build the thresholds
print(model.epidemic_onset)                  # the "season has started" line (~53 cases/100k here)
print(model.medium, model.high, model.very_high)

# Grade a week. Returns one of: 'baseline', 'low (epidemic started)', 'medium',
# 'high', 'very high', 'no data'.
print(model.level_of(300.0))                 # -> 'medium'
roc_analysis can pick the detection slope from the seasons, and mem_trend gives a trend signal:
from epimem import roc_analysis, mem_trend

# Tuning needs 6+ seasons; the demo data has 8.
tuning = roc_analysis(season_matrix)
best_slope = tuning.best("youden")                 # slope that best balances hits vs false alarms
model = mem_model(season_matrix, param=best_slope) # refit with it (the default is 2.8)

# Rising / falling cut-offs from week-to-week changes:
trend = mem_trend(season_matrix)
trend.ascending, trend.descending
Plotting (optional)
With the plot extra installed (pip install -e ".[plot]"), mem_chart draws the standard MEM
chart: past seasons in grey, the current one in bold, with the threshold lines.
from epimem import mem_model
from epimem.plot import mem_chart

model = mem_model(season_matrix)
ax = mem_chart(season_matrix, model, ylabel="weekly influenza rate")
ax.figure.savefig("mem.svg")
matplotlib is imported lazily, so the core package never requires it.
Worked example: the bundled flucyl data
flucyl is R mem's own example dataset: weekly influenza-like-illness rates (cases per 100,000
inhabitants), Castilla y León, 33 weeks by 8 seasons. It ships with this package as
example_seasons(). Learning the thresholds from its eight seasons and drawing them with
mem_chart gives:
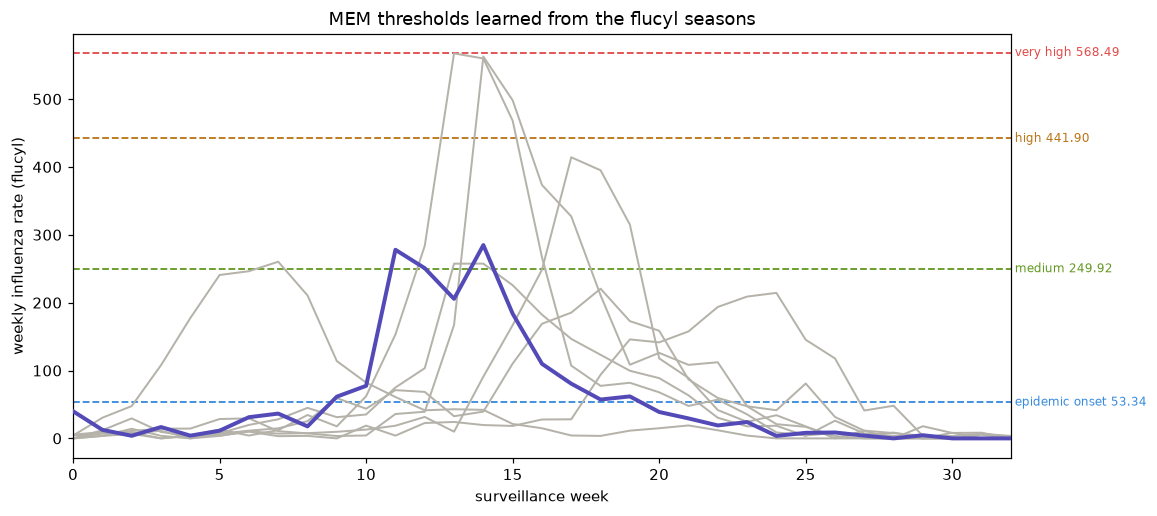
The grey lines are the eight past seasons. The dashed lines are the four thresholds:
| line | rate (per 100,000) | how to read it |
|---|---|---|
| epidemic onset | 53 | above this, the season has started |
| medium | 250 | a typical epidemic week |
| high | 442 | a strong week |
| very high | 569 | as bad as the worst past seasons |
A live season is graded by passing each week's value to model.level_of(value): it returns
baseline until the value crosses 53 (onset), then low (epidemic started), medium, high,
very high as it climbs.
Parameters (same names and defaults as R memmodel)
Python (mem_model) |
R (memmodel) |
Default | Meaning |
|---|---|---|---|
method |
i.method |
2 | optimum method (only 2, the criterion, is ported) |
param |
i.param |
2.8 | how steep the week-over-week rise must be to call onset; higher is stricter (later onset) |
n_values |
i.n.max |
round(30/n_seasons) |
how many top weeks per season feed the threshold pools (~30 in all); rarely changed |
type_threshold |
i.type.threshold |
5 | onset interval: arithmetic prediction |
level_threshold |
i.level.threshold |
0.95 | onset confidence level |
tails_threshold |
i.tails.threshold |
1 | one-sided |
type_intensity |
i.type.intensity |
6 | intensity interval: geometric prediction |
level_intensity |
i.level.intensity |
(0.40, 0.90, 0.975) | medium / high / very-high levels |
tails_intensity |
i.tails.intensity |
1 | one-sided |
use_t |
i.use.t |
False | t vs normal quantiles |
Confidence-interval types match R: 1 = arithmetic mean, 2 = geometric mean, 3 = nonparametric median (two-sided), 5 = arithmetic prediction, 6 = geometric prediction.
Fidelity and limitations
Verified against R. Every function above was run in both the R original and this port on the
package's own flucyl data and the numbers compared: mem_model, mem_goodness, the roc_analysis
and optimum_by_inspection sweeps, mem_intensity, mem_trend, and the mem_stability and
mem_evolution thresholds. The clean thresholds match to machine precision; the gap-filled
thresholds (where R and numpy round the missing-week fill slightly differently) and the
cross-validated scores match to about one part in a million. The checks are in
tests/test_equivalence.py; the R-generated reference numbers are in tests/reference/, each with
the generate_*.R script that produced it.
Ported faithfully: the mean, prediction, and geometric confidence intervals, the MAP curve, the
slope-criterion optimum, per-season timing, cross-season pooling, the leave-one-season-out goodness
metrics, the kernel smoother and its bandwidth selection (sm.regression and h.select's df=6
rule), and the rank-based tuner.
Simpler than R in one place: the median confidence interval (type 3) uses the standard order-statistic (sign-test) interval instead of R's interpolated one. It feeds only the typical duration, start-week, and percent-covered summary, so those numbers do not match R to the last digit; the thresholds themselves do.
Not ported, by choice:
- The R plotting functions (
memsurveillance,full.series.graph,processPlots).epimem.plot.mem_chartdraws the standard chart instead. - The data-reshaping helpers (
transformdata,transformseries). epimem takes a ready numpy matrix. - The
flucylrawraw dataset and the deprecatedepimemandepitimingfunctions. - Confidence-interval type 4 (bootstrap): it cannot be reproduced exactly against R's random-number
stream, and no default uses it (
confidence_intervalraises a clear error if it is requested). Also the one-sided median interval, optimum methods 1, 3, and 4, and the modelled typical curve.
Reference
Vega T, Lozano JE, Meerhoff T, et al. Influenza surveillance in Europe: establishing epidemic thresholds by the moving epidemic method. Influenza Other Respir Viruses. 2013;7(4):546-58. Original R package: https://github.com/lozalojo/mem
Release history Release notifications | RSS feed

Download files
Download the file for your platform. If you're not sure which to choose, learn more about installing packages.
Source Distribution
Built Distribution
Filter files by name, interpreter, ABI, and platform.
If you're not sure about the file name format, learn more about wheel file names.
Copy a direct link to the current filters
File details
Details for the file epimem-0.1.0.tar.gz.
File metadata
- Download URL: epimem-0.1.0.tar.gz
- Upload date:
- Size: 165.1 kB
- Tags: Source
- Uploaded using Trusted Publishing? No
- Uploaded via: uv/0.11.7 {"installer":{"name":"uv","version":"0.11.7","subcommand":["publish"]},"python":null,"implementation":{"name":null,"version":null},"distro":null,"system":{"name":null,"release":null},"cpu":null,"openssl_version":null,"setuptools_version":null,"rustc_version":null,"ci":null}
File hashes
| Algorithm | Hash digest | |
|---|---|---|
| SHA256 |
93547862653fbf56c080d1bc004d63322a8fc073b5f422dbbc1df910754cdfcd
|
|
| MD5 |
84d1847d3fe8eb5d92b0e9871873aa13
|
|
| BLAKE2b-256 |
20ac7a4dabe25aa0577efe6244708c4bcc42bd16e4a70b1130a90b7cec31d063
|
File details
Details for the file epimem-0.1.0-py3-none-any.whl.
File metadata
- Download URL: epimem-0.1.0-py3-none-any.whl
- Upload date:
- Size: 41.7 kB
- Tags: Python 3
- Uploaded using Trusted Publishing? No
- Uploaded via: uv/0.11.7 {"installer":{"name":"uv","version":"0.11.7","subcommand":["publish"]},"python":null,"implementation":{"name":null,"version":null},"distro":null,"system":{"name":null,"release":null},"cpu":null,"openssl_version":null,"setuptools_version":null,"rustc_version":null,"ci":null}
File hashes
| Algorithm | Hash digest | |
|---|---|---|
| SHA256 |
24b5671bc59c3faade557b9025714b938940b31a8b6b641072dbdcfa7b70d886
|
|
| MD5 |
62bbf8d531adc1ef4cfda8b2301b5682
|
|
| BLAKE2b-256 |
ac1a45fdb89e97b23b2512f7808257c94a381e4adb83c789c989f5fd4f46f757
|


