
errorbars
Error bars for LLM evals. Know whether model B is actually better, or you're reading noise.



LLM eval results get reported as bare accuracies — "model B scored 71.2%, up from 69.7%" — with
no error bar, no significance test, and no accounting for the fact that the questions came in
correlated groups. On a 500-question benchmark, a 1.5-point gain is very often noise: at a 50%
baseline you'd need roughly a 9-point gap to reliably detect anything at 80% power, α=0.05
(errorbars power --n 500 --baseline 0.5 → minimum detectable effect ≈ 8.9 points). Evan Miller's
"Adding Error Bars to Evals: A Statistical Approach to Language Model
Evaluations" (arXiv:2411.00640, 2024) lays out the right
practice — CLT and clustered standard errors, variance reduction through pairing, power analysis —
and this package turns it into a one-liner.
Why this exists
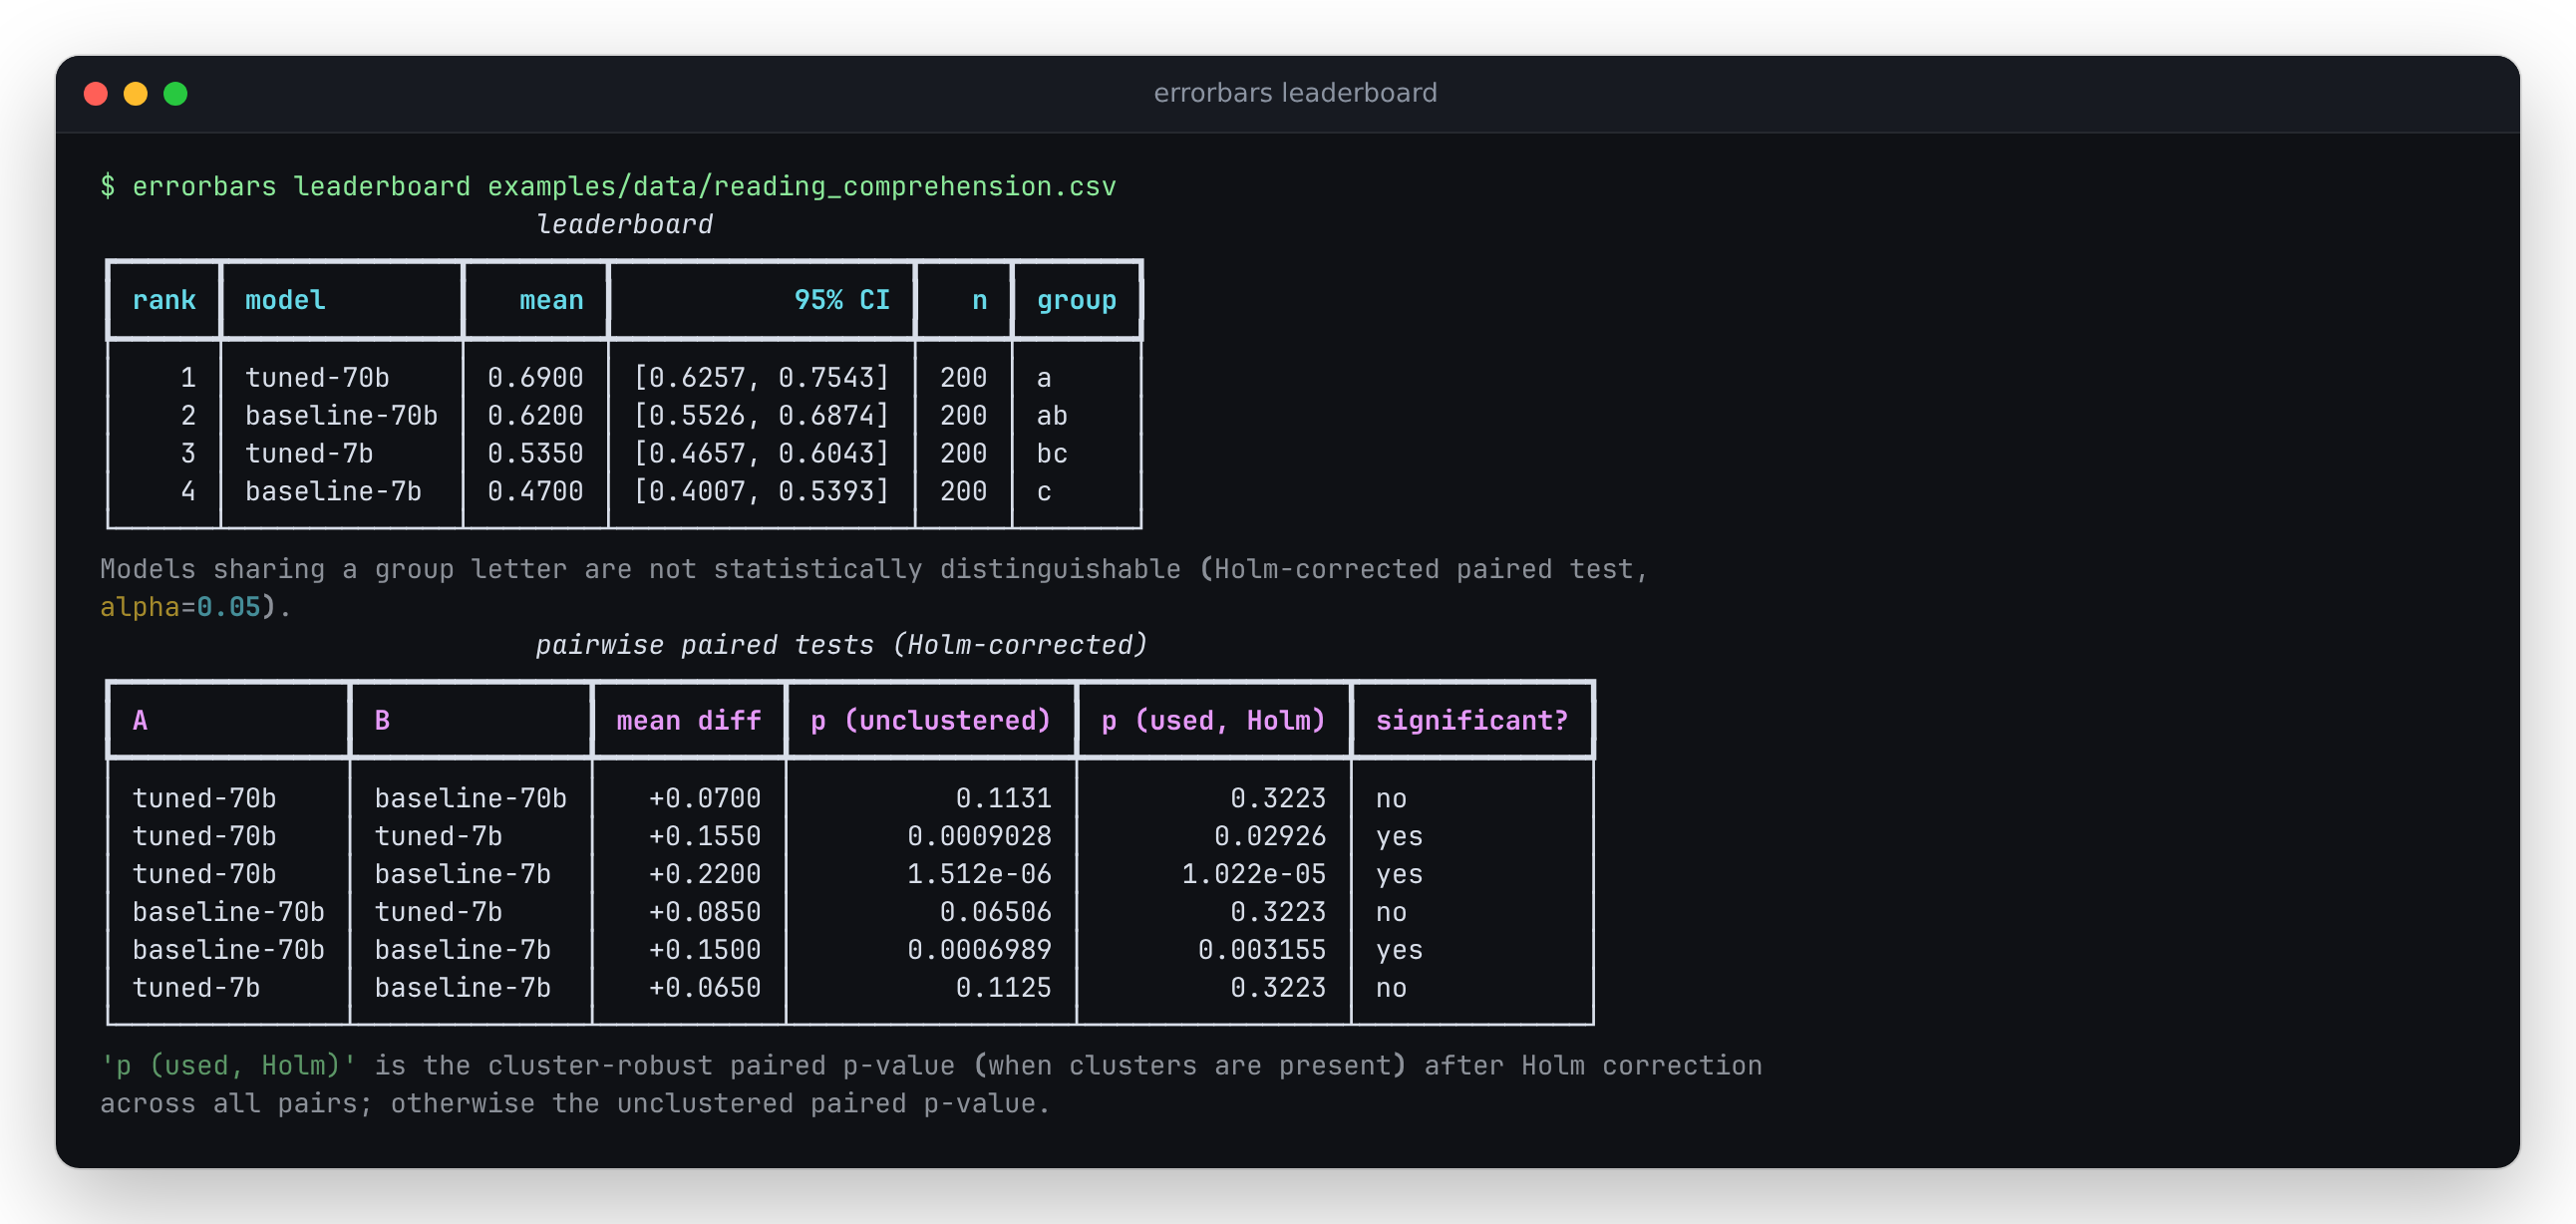
Run errorbars leaderboard on a synthetic benchmark (below) and one apparent 7-point win —
tuned-70b over baseline-70b, 0.690 vs. 0.620 — is not statistically significant once it has a
proper error bar: the paired test already gives p = 0.11. Accounting for the fact that questions
come 5-to-a-passage, and Holm-correcting across all 6 pairwise comparisons on the board, pushes
that to p = 0.32. A naive leaderboard that ranks by bare accuracy would still have shipped the gap
as a win. The full walkthrough, with every number copied from a real command, is in
examples/README.md.
Quickstart
pip install "errorbars[cli]"
errorbars power --delta 0.03 --baseline 0.5
Questions needed: 4361
That's how many questions you'd need to reliably detect a 3-point accuracy gap at a 50% baseline, with the defaults (80% power, α=0.05, no pairing correlation, no clustering). Clone the repo to try it against real per-item scores:
git clone https://github.com/antonsoo/errorbars && cd errorbars
errorbars leaderboard examples/data/reading_comprehension.csv
Features
summarize— mean, SE, and 95% CI (CLT by default, Wilson for small-n binary scores, bootstrap on request); clustered SE with design effect and ICC when acluster_idcolumn is present; within/between-question variance decomposition when asamplecolumn is present.compare— paired mean difference, SE, CI, p-value; the correlation between the two models' per-question scores and how much pairing shrank the SE vs. an unpaired comparison; a cluster-robust paired SE/p-value when clusters are present; exact McNemar test for binary scores.leaderboard— every model with its CI, Holm-corrected pairwise paired tests, and groups of statistically indistinguishable models (maximal cliques of the "not significantly different" graph); a forest plot (SVG, no dependency; matplotlib if installed).power— number of questions needed to detect an effect δ at a given α and power, or the minimum detectable effect for a given n, accounting for pairing correlation, repeated sampling, and cluster design effect.- CLI —
errorbars summarize|compare|leaderboard|power|import,richtables by default,--jsonfor scripting. - Adapters —
errorbars import lm-eval|inspectconverts lm-evaluation-harness--log_samplesoutput or an Inspect AI.evallog into the canonical format (see below). - Web calculator — a static "how many eval questions do I need?" power calculator (live demo), whose TypeScript formulas are checked against the Python ones by the test suite.
- Typed Python ≥3.10,
numpythe only runtime dependency;pandasandmatplotlibare optional extras;scipy/statsmodelsare test-only oracles, never imported at runtime.
Usage
errorbars summarize examples/data/reading_comprehension.csv --model tuned-70b
    summarize: tuned-70b
┏━━━━━━━━┳━━━━━━━━━━━━━━━━━━┓
┃ metric ┃            value ┃
┡━━━━━━━━╇━━━━━━━━━━━━━━━━━━┩
│ n      │              200 │
│ mean   │           0.6900 │
│ SE     │           0.0328 │
│ 95% CI │ [0.6257, 0.7543] │
│ method │              clt │
└────────┴──────────────────┘
       clustering diagnostics
┏━━━━━━━━━━━━━━━┳━━━━━━━━━━━━━━━━━━┓
┃ metric        ┃            value ┃
┡━━━━━━━━━━━━━━━╇━━━━━━━━━━━━━━━━━━┩
│ n clusters    │               40 │
│ ICC           │           0.0710 │
│ design effect │            1.284 │
│ clustered SE  │           0.0372 │
│ clustered CI  │ [0.6148, 0.7652] │
└───────────────┴──────────────────┘
errorbars compare examples/data/reading_comprehension.csv \
  --model-a tuned-70b --model-b baseline-70b
mean diff (A - B)                 0.0700
paired SE                         0.0440
95% CI                  [-0.0167, 0.1567]
p-value                           0.1131
correlation(A, B)                 0.1434
variance reduction from pairing     14.3%
McNemar exact p-value             0.1405
errorbars power --delta 0.05 --baseline 0.65 --rho 0.14 --cluster-deff 1.28
Questions needed: 1573
Every number above is copied verbatim from running these commands against
examples/data/reading_comprehension.csv (synthetic — see below). The full leaderboard output and
the reasoning behind each step are in examples/README.md.
Input format
Long-format CSV or JSONL, one row per observation:
| question_id | cluster_id (optional) | model | score | sample (optional) |
|---|---|---|---|---|
| q1 | passage-003 | tuned-70b | 1 |
Column names are configurable (--question-col, --cluster-col, etc., or ColumnMap in Python).
Scores can be binary (0/1) or continuous. cluster_id groups correlated questions (e.g. several
questions per reading passage); sample marks repeated generations of the same question.
Importing from lm-evaluation-harness or Inspect AI
errorbars import converts either tool's own log format into the canonical CSV above:
# lm-evaluation-harness: lm_eval run --model <...> --tasks <...> --log_samples --output_path <dir>
errorbars import lm-eval runs/<dir>/samples_<task>_<timestamp>.jsonl \
  --model my-model-name -o converted.csv

# Inspect AI: inspect eval <task> --model <...>  (writes a .eval log by default)
errorbars import inspect logs/<run>.eval -o converted.csv
--metric (lm-eval) picks which computed metric to use as the score when a task reports more than
one (e.g. acc vs. acc_norm); it defaults to the first one. --scorer (Inspect) does the same
for tasks with multiple scorers. Inspect epochs (--epochs N, repeated sampling of the same input)
land in the sample column automatically.
Both adapters were built and tested against real, unedited output — not from memory: lm-eval
0.4.13 (lm_eval run --model dummy --tasks copa --limit 20 --log_samples ..., plus a
multi-metric arc_easy run) and inspect-ai 0.3.268 (a 5-sample task through the built-in
mockllm/model provider). The exact log files are committed as test fixtures
(tests/fixtures/samples_*.jsonl, tests/fixtures/inspect_tiny_qa.eval) and re-parsed in
tests/test_adapters.py on every run. The Inspect adapter reads logs with Inspect's own
inspect_ai.log.read_eval_log and inspect_ai.scorer.value_to_float rather than hand-parsing its
binary .eval format, and needs the inspect extra:
pip install "errorbars[inspect]". The lm-eval
adapter has no extra dependency — --log_samples is already plain JSONL.
How it works
Every statistic is implemented from scratch on numpy + the standard library
(statistics.NormalDist for normal quantiles; Student-t tails from a continued-fraction incomplete
beta function) — no scipy or statsmodels at runtime.
Full derivations with references are in docs/formulas.md:
- CLT and Wilson confidence intervals for a mean
- Cluster-robust standard errors (the CR1 sandwich estimator, matching
statsmodels'cov_type="cluster") - Intraclass correlation and Kish's design effect
- Within/between-question variance decomposition for repeated sampling
- Paired comparisons, variance reduction from pairing, and exact McNemar
- Holm-Bonferroni correction and maximal-clique grouping for leaderboards
- Power analysis (sample size and minimum detectable effect) under pairing and clustering
Accuracy and limitations
- Cluster-robust SE matches
statsmodels'OLS(..., cov_type="cluster")to 1e-9 on both balanced and unbalanced cluster sizes; Wilson intervals matchstatsmodels.stats.proportion_confintto 1e-9; the paired t-test matchesscipy.stats.ttest_relto 1e-7 at any n, and McNemar's exact test is cross-checked againststatsmodels. Seetests/test_stats_vs_oracles.pyandtests/test_compare_vs_oracles.py. - Monte Carlo coverage tests (
tests/test_coverage_montecarlo.py) confirm nominal 95% CIs cover the true parameter close to 95% of the time — for CLT, Wilson, bootstrap, and cluster-robust intervals — with a tolerance sized to the trial count so it won't flake. - Paired comparisons use Student's t with n − 1 degrees of freedom, like
scipy.stats.ttest_rel, and clustered SEs use t with G − 1 for G clusters (Cameron & Miller 2015), computed without scipy. With few clusters that interval is honest but wide; the per-modelcltinterval stays normal-based, which is only right once n is in the dozens. - The power formula's samples-per-question adjustment assumes all single-sample variance is
decoding noise (see
docs/formulas.md§11 for why, and the caveat on when this is optimistic). It's a planning tool for before you run the eval; for a post-hoc measurement with the true within/between-question split, usesummarizeon data with asamplecolumn instead. - Leaderboard groups are maximal cliques of the "not significantly different" graph, which is the
statistically direct approach — it can produce a model in more than one group, unlike a
minimal-letters heuristic (e.g. R's
multcompView). - 168 Python tests, 605 TypeScript tests (cross-checking the JS formulas against Python-generated vectors), all passing on this box (14 vCPU WSL2 Linux, 48 GB RAM; Python 3.12.3, Node 26.7.0) as of 2026-10-01.
Web calculator
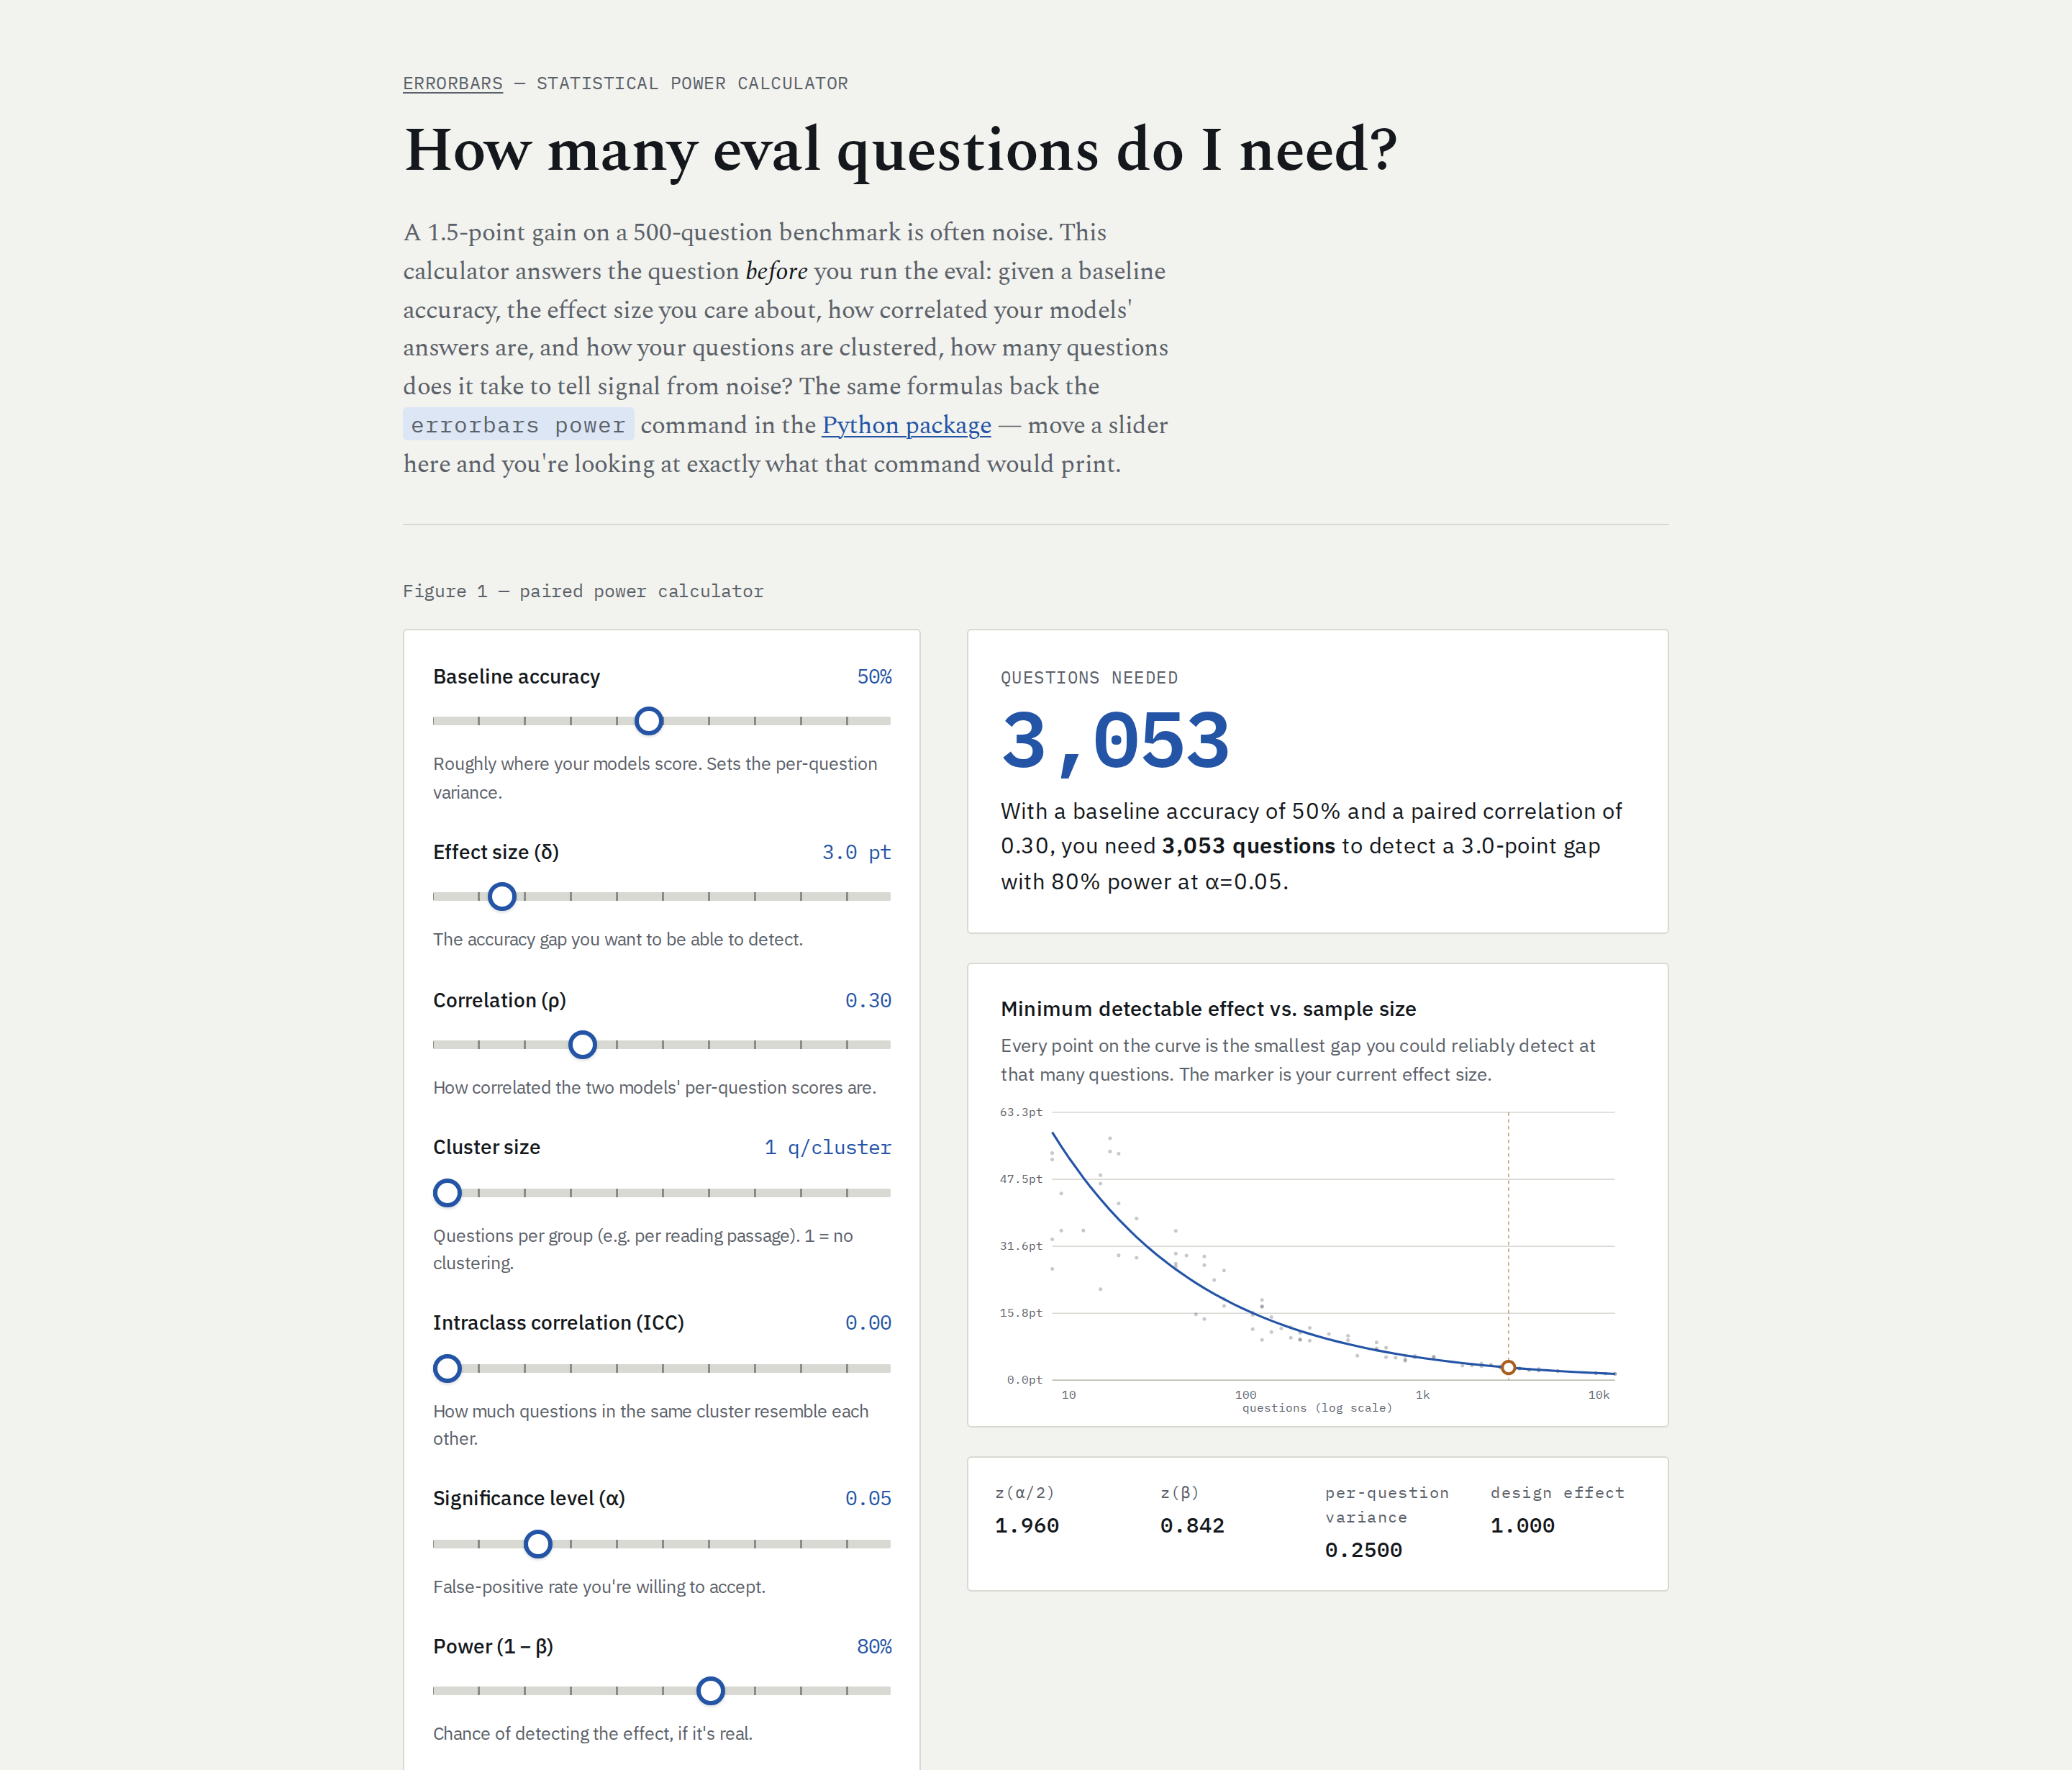
web/ is a static Vite + TypeScript "how many eval questions do I need?" calculator
(live demo). Its power formulas
(web/src/power.ts, web/src/normal.ts) are a direct port of src/errorbars/power.py; Python
generates JSON test vectors (scripts/export_test_vectors.py → web/test-vectors.json) that the
TypeScript test suite checks against, so the two implementations can't silently drift apart.
Development
uv sync --group dev --extra all
uv run pytest
uv run ruff check .
uv run mypy src/errorbars
See CONTRIBUTING.md for the web calculator's dev loop and guidelines.
Contributing
Issues and PRs welcome. Any new statistic needs a test against an independent oracle (reference
library, closed form, or Monte Carlo simulation) — see tests/ for the pattern.
Citations
@misc{miller2024addingerrorbarsevals,
  title  = {Adding Error Bars to Evals: A Statistical Approach to Language Model Evaluations},
  author = {Evan Miller},
  year   = {2024},
  eprint = {2411.00640},
  archivePrefix = {arXiv},
  primaryClass  = {stat.AP},
  url    = {https://arxiv.org/abs/2411.00640}
}
License
MIT © 2026 Anton Soloviev
Part of Officina, a set of small open-source tools by Anton Soloviev.
1 maintainer

Metadata
1 maintainer
Release files for errorbars 0.1.2
For a detailed explanation of source distributions (sdists) and built distributions (wheels), please see the package formats documentation.
Source distribution (sdist)
| File | Size | Uploaded | |
|---|---|---|---|
| errorbars-0.1.2.tar.gz | 38.0 kB | Details |
Built distribution (wheel)
| File | Interpreter | ABI | Platform | Reset |
|---|---|---|---|---|
| errorbars-0.1.2-py3-none-any.whl | Python 3 | none | any | Details |
Total release size: 70.5 kB
Release files / errorbars-0.1.2.tar.gz
| Download URL | errorbars-0.1.2.tar.gz |
|---|---|
| Size | 38.0 kB |
| Tags | Source |
|
SHA-256 checksum How to use checksums |
042115ede79674b5de408d19ef5bd3c71d4a62242f15bebaeca66332c03bce27
|
|
BLAKE2b-256 checksum How to use checksums |
8ca4e3d0392193a3df786f5597da8d48028eed90c56fcf8a52f6efc47a0ff9c3
|
| Upload date | |
|
Uploaded using Trusted Publishing? What is trusted publishing? |
No |
| Uploaded via |
uv/0.12.21 {"installer":{"name":"uv","version":"0.12.21","subcommand":["publish"]},"python":null,"implementation":{"name":null,"version":null},"distro":{"name":"Ubuntu","version":"24.04","id":"noble","libc":null},"system":{"name":null,"release":null},"cpu":null,"openssl_version":null,"setuptools_version":null,"rustc_version":null,"ci":null}
|
Release files / errorbars-0.1.2-py3-none-any.whl
| Download URL | errorbars-0.1.2-py3-none-any.whl |
|---|---|
| Size | 32.5 kB |
| Tags | Python 3 |
|
SHA-256 checksum How to use checksums |
ca9d461b6058e8160a76be9818ca5016df13e93baa7f3a0993cf1548e0af8271
|
|
BLAKE2b-256 checksum How to use checksums |
46a4513c5515fc4bc94b04e9908f8c31a3c22f0298bb1abd2c63b4567f63288e
|
| Upload date | |
|
Uploaded using Trusted Publishing? What is trusted publishing? |
No |
| Uploaded via |
uv/0.12.21 {"installer":{"name":"uv","version":"0.12.21","subcommand":["publish"]},"python":null,"implementation":{"name":null,"version":null},"distro":{"name":"Ubuntu","version":"24.04","id":"noble","libc":null},"system":{"name":null,"release":null},"cpu":null,"openssl_version":null,"setuptools_version":null,"rustc_version":null,"ci":null}
|













