Generates ETW events for tracing Python apps with the Windows Performance Toolkit

Project description
python-etwtrace
Enables ETW tracing events to help with profiling using the Windows Performance Toolkit. It supports Python 3.9 and later on Windows 64-bit and Windows ARM64.
(Note that the WPA integration shown above requires the current preview release.)
Two forms of profiling are supported:
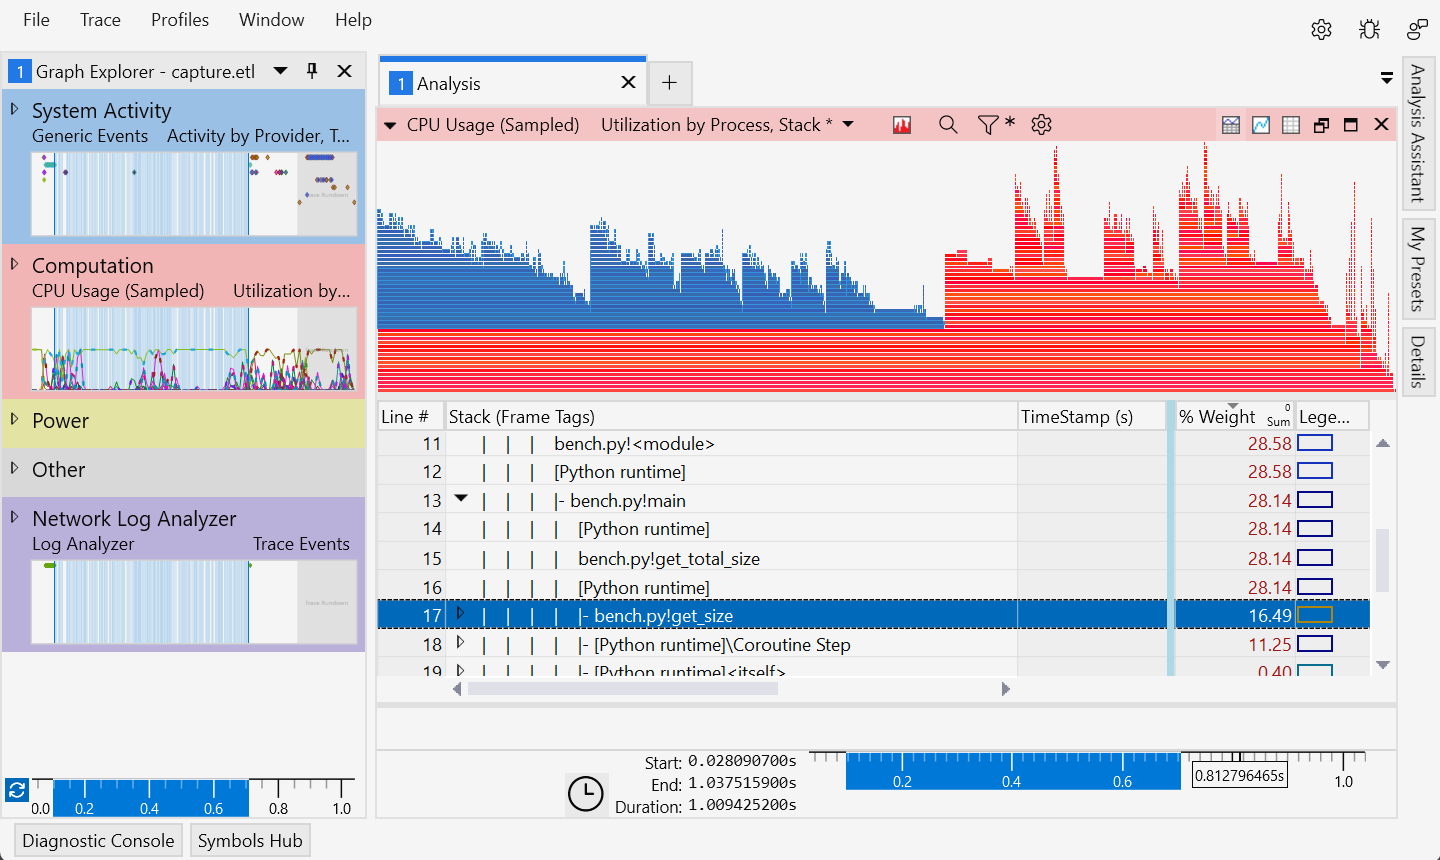
- stack sampling, where regular CPU sampling will include Python calls
- instrumentation, where events are raised on entry/exit of Python functions
If you will inspect results using Windows Performance Analyzer
(WPA), then you will prefer stack sampling (the default).
This method inserts additional native function calls in place of pure-Python calls,
and provides WPA with the metadata necessary to display the function.
Configure the provided stack tags
file (python -m etwtrace --stacktags) in WPA and view the "Stack (Frame Tags)"
column to filter out internal Python calls.
You will need Python symbols for the best results;
these are an optional component in the installer from python.org.
If you are capturing ETW events for some other form of analysis, you may prefer more traditional instrumentation. This method generates ETW events on entry and exit of each function, which can be reconstructed into call stacks at any point. It also provides more accurate call count data than stack sampling.
Capturing events
See Windows Performance Recorder for detailed information on recording events, including installation of the Windows Performance Toolkit. Here we cover only the basics to capture a trace of some Python code.
The wpr tool is used to start and stop recording a trace,
and to export the results to an .etl file.
The trace must be started and stopped as Administrator, however,
the code under test may be run as a regular user.
For basic capture, use the --capture argument to have etwtrace launch and
stop wpr:
> python -m etwtrace --capture output.etl -- .\my-script.py
A recording profile
is used to select the event sources that will be recorded. We include a profile
configured for Python as python.wprp.
We recommend downloading this file from here,
or finding it in the etwtrace package's install directory
by running python -m etwtrace --profile.
To record a Python trace:
# Ensure the output file does not exist, or tracing will fail
> del output.etl

> wpr -start python.wprp!Default

# run your code as shown below ...

> wpr -stop output.etl
You can pass !Minimal instead of !Default to reduce the size of the trace by
omitting some other system providers.
When running on Windows ARM64, use !ARM64 instead of !Default to avoid some
providers that are currently absent.
To collect additional information, we suggest copying the configuration from
python.wprp into your own recording profile.
The WPR docs above provide more information.
Launching with tracing
To enable for a single command, launch with -m etwtrace -- <script> or
-m etwtrace -- -m <module>:
> python -m etwtrace -- .\my-script.py arg1 arg2
Pass --instrumented before the -- to select that mode.
> python -m etwtrace --instrumented -- -m test_module
Pass --capture FILE before the -- to automatically start and stop wpr.
> python -m etwtrace --capture output.etl -- .\my-script.py arg1 arg2
To enable permanently for an environment, run the module with --enable:
> python -m etwtrace --enable
Created etwtrace.pth
Set %ETWTRACE_TYPE% to 'instrumented' to use instrumented events rather than stacks
To enable permanently but only when an environment variable is set, also provide the variable name. A second variable name may be provided to specify the kind of tracing ('instrumented' or 'stack' (default)); if omitted, the variable name will be derived from the first.
> python -m etwtrace --enable PYTHON_ETW_TRACE TRACE_TYPE
Created etwtrace.pth
Set %PYTHON_ETW_TRACE% to activate
Set %TRACE_TYPE% to 'instrumented' to use instrumented events rather than stacks

> $env:PYTHON_ETW_TRACE = "1"
> python .\my-script.py arg1 arg2
To disable, run with --disable or delete the created .pth file.
> python -m etwtrace --disable
Removed etwtrace.pth
Visual Studio integration
This module is also used for Visual Studio profiling of Python code, however, those interfaces are not supported for use outside of Visual Studio, and so are not documented here.
Please see the Visual Studio documentation for information about profiling Python code.
Building from Source
To build the sources:
> python -m pip install pymsbuild

# Builds into the source directory (-g for a debug configuration)
> python -m pymsbuild -g

# Ensure source directory is importable
> $env:PYTHONPATH = ".\src"
> python ...
Events
When enabled, ETW events are raised on thread creation, ending, and when a
function is first executed. Other events may be raised explicitly by Python code
that calls etwtrace.custom_mark, or the internal etwtrace._stack_mark
function.
The PythonFunction event provides the range of memory that will appear in
stack samples when the specified function is called. It can be used to map
sampled frames back to the source file and line number of the function being
executed. The FunctionID argument is a unique value for the lifetime of the
process representing the function.
The PythonThread event typically comes as a range (using start and stop
opcodes) and is intended to highlight a region of interest. Similarly, the
PythonMark event may be a range highlighting a particular region of interest.
The PythonStackSample event is primarily used by tests to force a stack sample
to be collected at a particular point in execution. When used for this, it
should be configured in the collection profile to include the stack, as there is
nothing inherent to the event that causes collection. This event is raised by
the private and undocumented _mark_stack function.
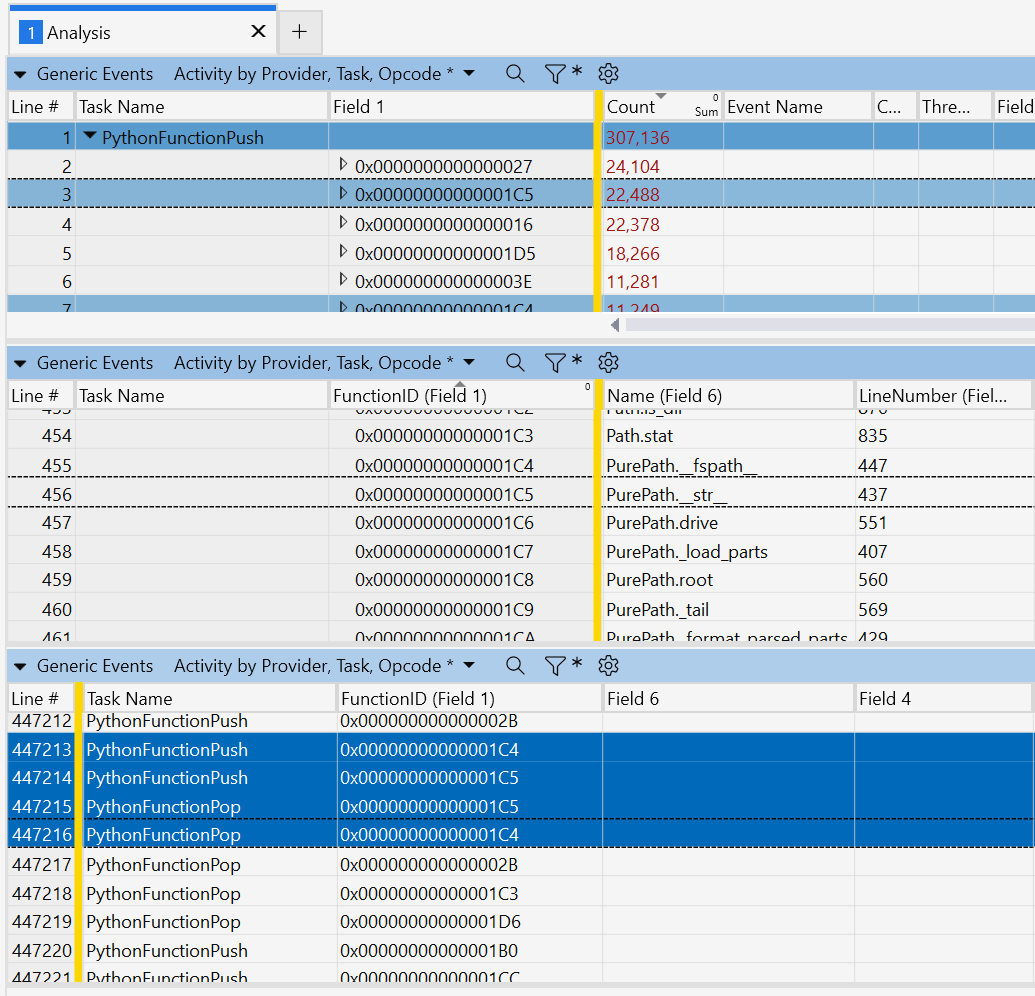
The PythonFunctionPush and PythonFunctionPop events are raised in
instrumentation mode on entry and exit of a function. The FunctionID and
Caller (another function ID) will have previously appeared in PythonFunction
events.
The Python events provider GUID is 99a10640-320d-4b37-9e26-c311d86da7ab.
| Event | Keyword | Args |
|---|---|---|
PythonThread |
0x0100 |
ThreadId |
PythonFunction |
0x0400 |
FunctionID, BeginAddress, EndAddress, LineNumber, SourceFile, Name |
PythonMark |
0x0800 |
Mark |
PythonStackSample |
0x0200 |
Mark |
PythonFunctionPush |
0x1000 |
FunctionID, Caller, CallerLine |
PythonFunctionPop |
0x2000 |
FunctionID |
Contributing
This project welcomes contributions and suggestions. Most contributions require you to agree to a Contributor License Agreement (CLA) declaring that you have the right to, and actually do, grant us the rights to use your contribution. For details, visit https://cla.opensource.microsoft.com.
When you submit a pull request, a CLA bot will automatically determine whether you need to provide a CLA and decorate the PR appropriately (e.g., status check, comment). Simply follow the instructions provided by the bot. You will only need to do this once across all repos using our CLA.
This project has adopted the Microsoft Open Source Code of Conduct. For more information see the Code of Conduct FAQ or contact opencode@microsoft.com with any additional questions or comments.
Trademarks
This project may contain trademarks or logos for projects, products, or services. Authorized use of Microsoft trademarks or logos is subject to and must follow Microsoft's Trademark & Brand Guidelines. Use of Microsoft trademarks or logos in modified versions of this project must not cause confusion or imply Microsoft sponsorship. Any use of third-party trademarks or logos are subject to those third-party's policies.
Release history Release notifications | RSS feed


Download files
Download the file for your platform. If you're not sure which to choose, learn more about installing packages.
Source Distribution
Built Distributions
Filter files by name, interpreter, ABI, and platform.
If you're not sure about the file name format, learn more about wheel file names.
Copy a direct link to the current filters
File details
Details for the file etwtrace-0.1b9.tar.gz.
File metadata
- Download URL: etwtrace-0.1b9.tar.gz
- Upload date:
- Size: 21.1 kB
- Tags: Source
- Uploaded using Trusted Publishing? No
- Uploaded via: RestSharp/106.13.0.0
File hashes
| Algorithm | Hash digest | |
|---|---|---|
| SHA256 |
819a386b7d2bb2d9d0625cba850ab669c1bd3a0b11356ec10e74ebb27e433f79
|
|
| MD5 |
b0e8b3776453b9f697cc86037ba100ed
|
|
| BLAKE2b-256 |
4a8674ad8b477bfb51bba0f2ff2b17fd866ce71314c644b45cdd821b664b12df
|
File details
Details for the file etwtrace-0.1b9-cp314-cp314-win_arm64.whl.
File metadata
- Download URL: etwtrace-0.1b9-cp314-cp314-win_arm64.whl
- Upload date:
- Size: 65.2 kB
- Tags: CPython 3.14, Windows ARM64
- Uploaded using Trusted Publishing? No
- Uploaded via: RestSharp/106.13.0.0
File hashes
| Algorithm | Hash digest | |
|---|---|---|
| SHA256 |
ee6d0378bb75c5434de30b92aa42c95807b9f0d0de9dd3ed1730e362441a336a
|
|
| MD5 |
8a1b5b2732acc8673561e2ba6165eaee
|
|
| BLAKE2b-256 |
bf702695a85d3e326d623449547a34bd044ee4a02632c87c35a08e60a1877475
|
File details
Details for the file etwtrace-0.1b9-cp314-cp314-win_amd64.whl.
File metadata
- Download URL: etwtrace-0.1b9-cp314-cp314-win_amd64.whl
- Upload date:
- Size: 71.2 kB
- Tags: CPython 3.14, Windows x86-64
- Uploaded using Trusted Publishing? No
- Uploaded via: RestSharp/106.13.0.0
File hashes
| Algorithm | Hash digest | |
|---|---|---|
| SHA256 |
7b37e313a9a7d145db1ac29fbf88d8f2a3bb144a2129d46c569252afecfc68aa
|
|
| MD5 |
7af5ce5693e17a1aef7a6a78b3f4359c
|
|
| BLAKE2b-256 |
d4d1f7486d7186b90f1109251ee3d4b1162beaa99b9a5c9037300b63214140f8
|
File details
Details for the file etwtrace-0.1b9-cp313-cp313-win_arm64.whl.
File metadata
- Download URL: etwtrace-0.1b9-cp313-cp313-win_arm64.whl
- Upload date:
- Size: 65.1 kB
- Tags: CPython 3.13, Windows ARM64
- Uploaded using Trusted Publishing? No
- Uploaded via: RestSharp/106.13.0.0
File hashes
| Algorithm | Hash digest | |
|---|---|---|
| SHA256 |
a8ad64e9e3cd542f2f01a1359af33e6c629068b879959e6b38c31a85495eb312
|
|
| MD5 |
c0ce9a43d0dac2da6a71d27394febb94
|
|
| BLAKE2b-256 |
7c4e1f42b790ef7339ece54eb5d8f08899f2c57bbbfb0ad7966315b0e1317ad4
|
File details
Details for the file etwtrace-0.1b9-cp313-cp313-win_amd64.whl.
File metadata
- Download URL: etwtrace-0.1b9-cp313-cp313-win_amd64.whl
- Upload date:
- Size: 71.2 kB
- Tags: CPython 3.13, Windows x86-64
- Uploaded using Trusted Publishing? No
- Uploaded via: RestSharp/106.13.0.0
File hashes
| Algorithm | Hash digest | |
|---|---|---|
| SHA256 |
0c625e6bfa2f1b9202e35c77acd7c8a5986dfc20040c1858a63b26c3340bd462
|
|
| MD5 |
8ca81efdcc7c7ebd3f87dda4ff883047
|
|
| BLAKE2b-256 |
7c1931e68e23bca6454b98cf761dad763b6787ca05b02dcb6633c3a1347d8a98
|
File details
Details for the file etwtrace-0.1b9-cp312-cp312-win_arm64.whl.
File metadata
- Download URL: etwtrace-0.1b9-cp312-cp312-win_arm64.whl
- Upload date:
- Size: 65.2 kB
- Tags: CPython 3.12, Windows ARM64
- Uploaded using Trusted Publishing? No
- Uploaded via: RestSharp/106.13.0.0
File hashes
| Algorithm | Hash digest | |
|---|---|---|
| SHA256 |
43547d3d39f098bbc08dfd1c6cda763ff02e6d28682b44494c15127fa8248e2e
|
|
| MD5 |
54b0ccd5f60b48216ca6c97cdcf24920
|
|
| BLAKE2b-256 |
56ee8b0e5e4b85b8aead8517029f88cae233d0875d0516052ea4329bcddfbd66
|
File details
Details for the file etwtrace-0.1b9-cp312-cp312-win_amd64.whl.
File metadata
- Download URL: etwtrace-0.1b9-cp312-cp312-win_amd64.whl
- Upload date:
- Size: 71.1 kB
- Tags: CPython 3.12, Windows x86-64
- Uploaded using Trusted Publishing? No
- Uploaded via: RestSharp/106.13.0.0
File hashes
| Algorithm | Hash digest | |
|---|---|---|
| SHA256 |
b27d2da4ef4ef776e5badc2f59783a7cdf5c3619a7b8231418595a9738ad3ae0
|
|
| MD5 |
7b46870533332d2aaed4f5ca52c4ad27
|
|
| BLAKE2b-256 |
4d4af7b01e640c29e623388cf945d6771fa744380042ac9d17c98d8333cd2345
|


