
Local-first ML experiment tracker — zero friction, zero cloud
Verified details
These details have been verified by PyPIProject links
GitHub Statistics
Maintainers

Project description
exptrack


A local experiment tracker for ML workflows. Captures parameters, metrics, git state, and code changes from your training scripts and notebooks automatically. Uses only the Python standard library and stores everything in a single SQLite file.
pip install exptrack && cd my_project && exptrack init

# Prefix your training command. Parameters, git state, and artifacts
# are captured without any changes to your script.
exptrack run train.py --lr 0.01 --epochs 20 --data cifar10

exptrack ls        # list experiments
exptrack ui        # open the web dashboard
Dashboard
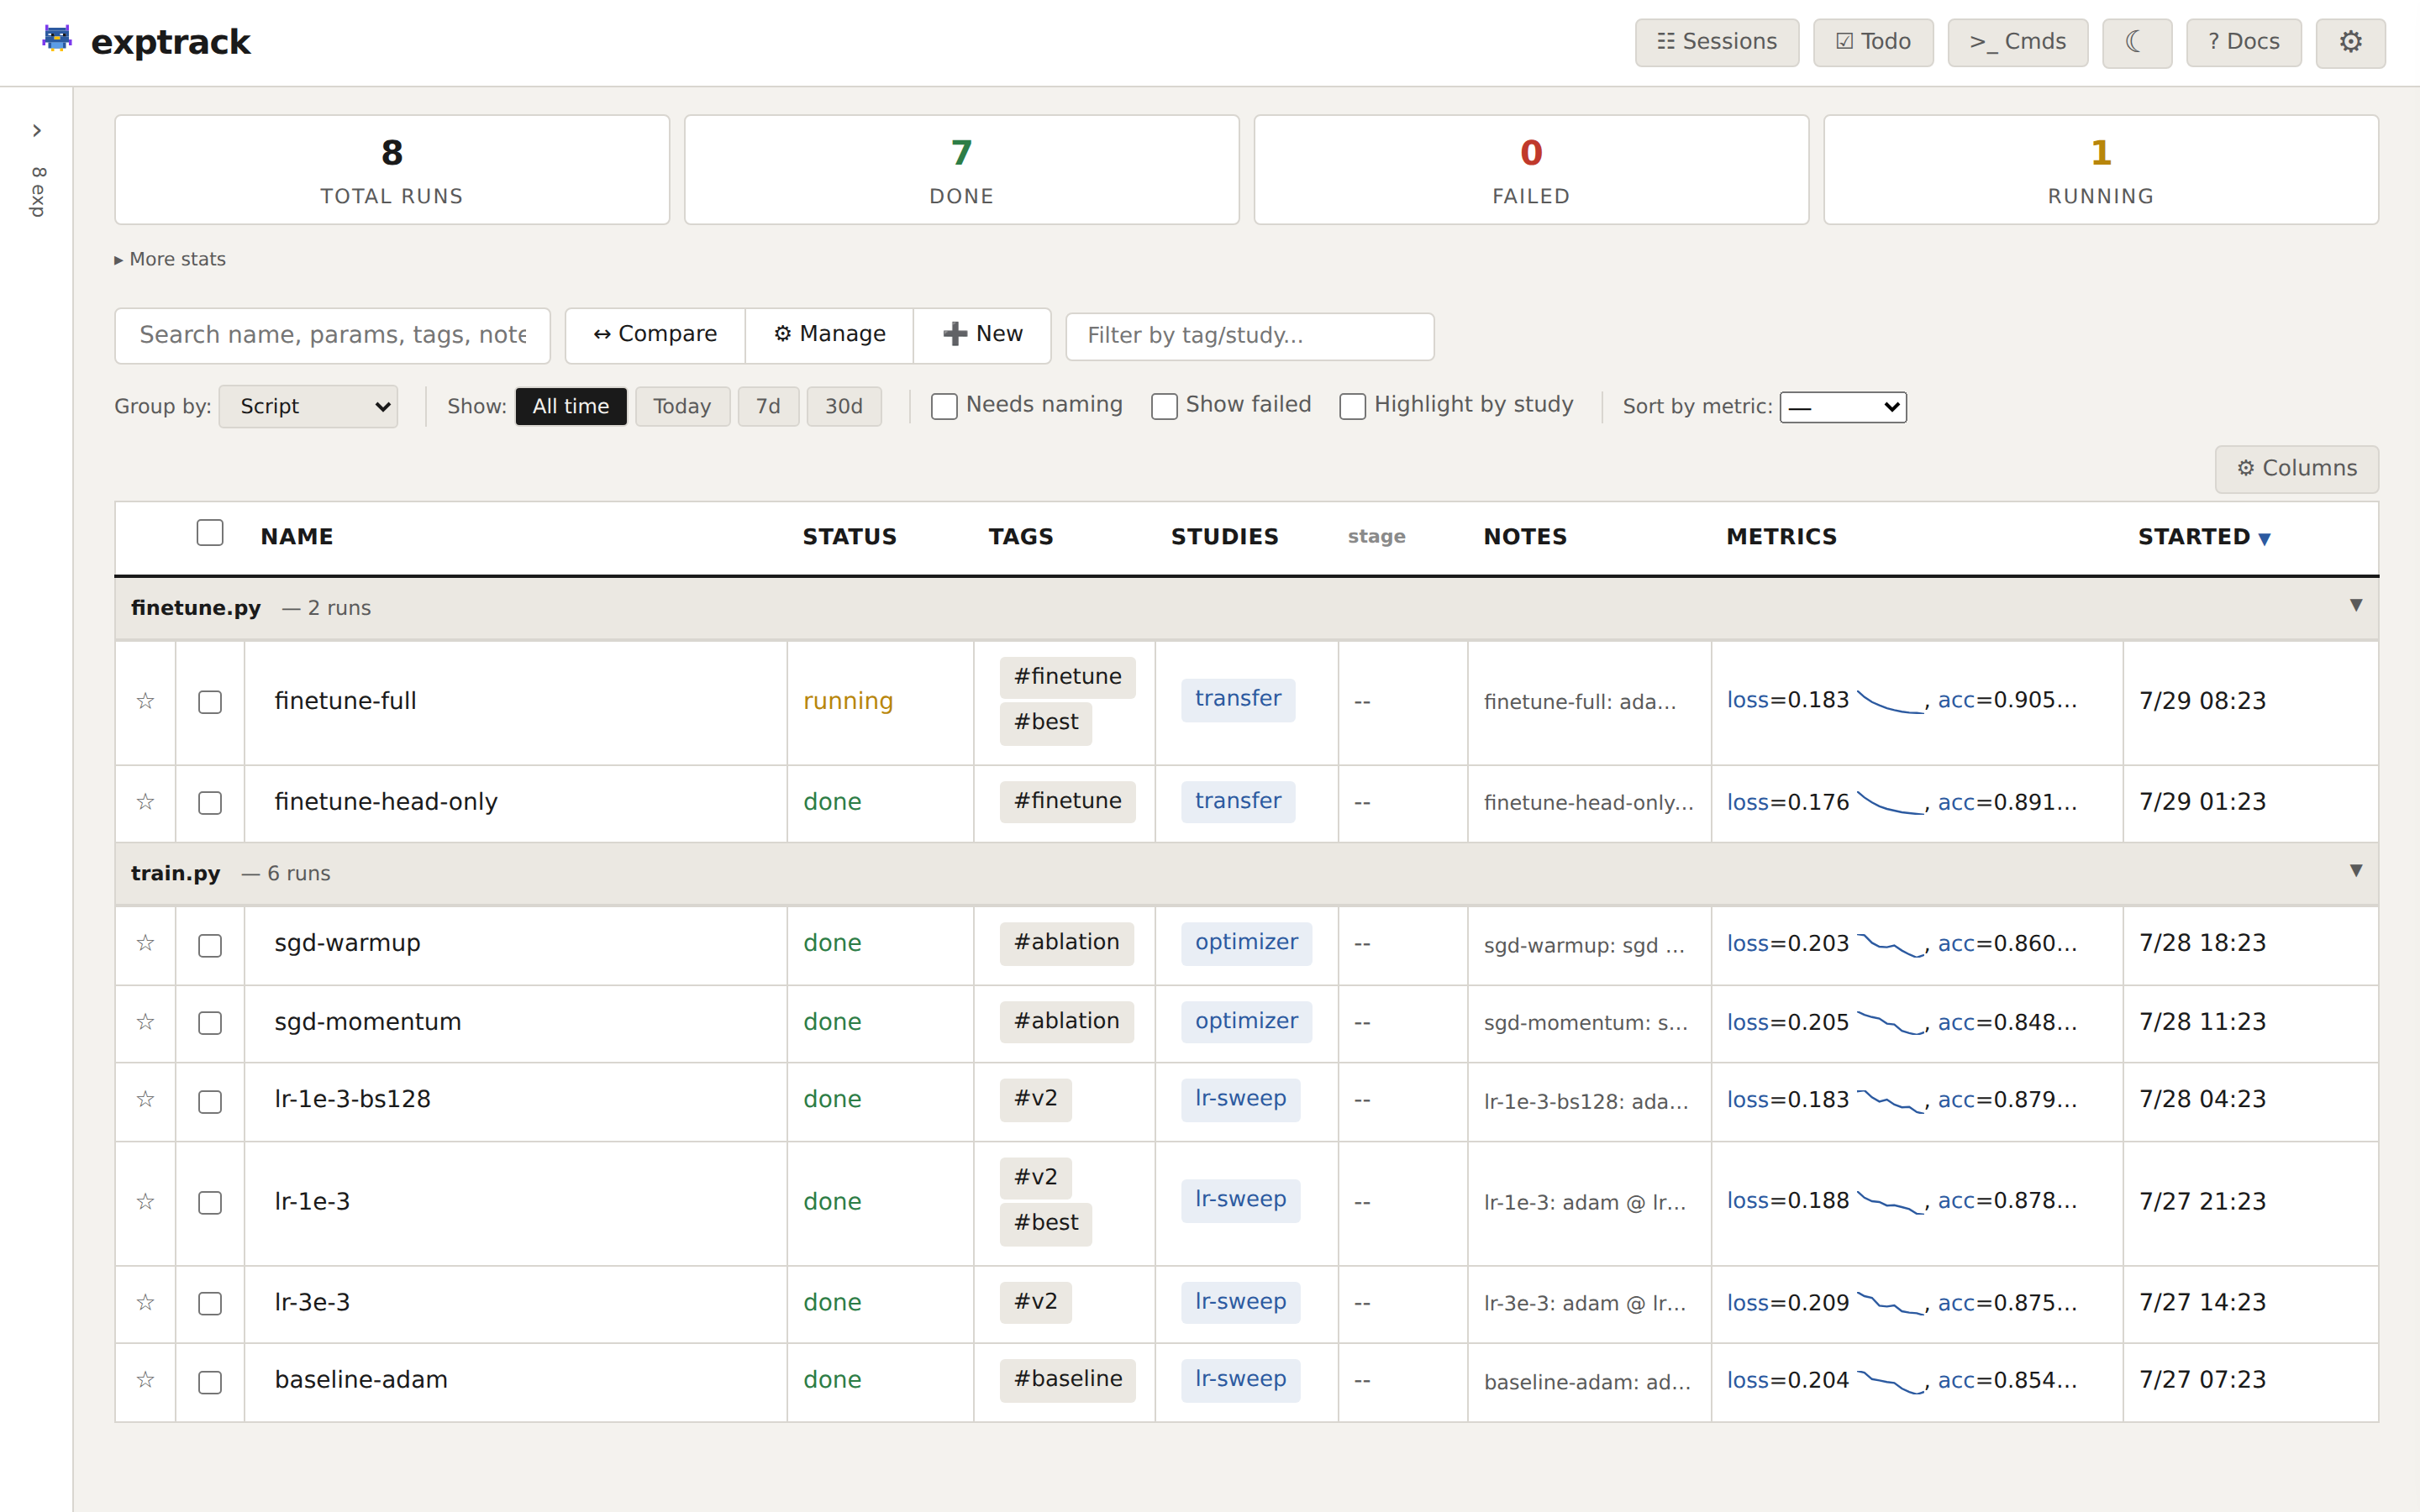
Filter, compare, tag, and explore experiments from a local web UI. Runs on localhost with no accounts or internet needed. Runs group by script by default, so a burst of near-identical attempts reads as one block instead of a flat list.
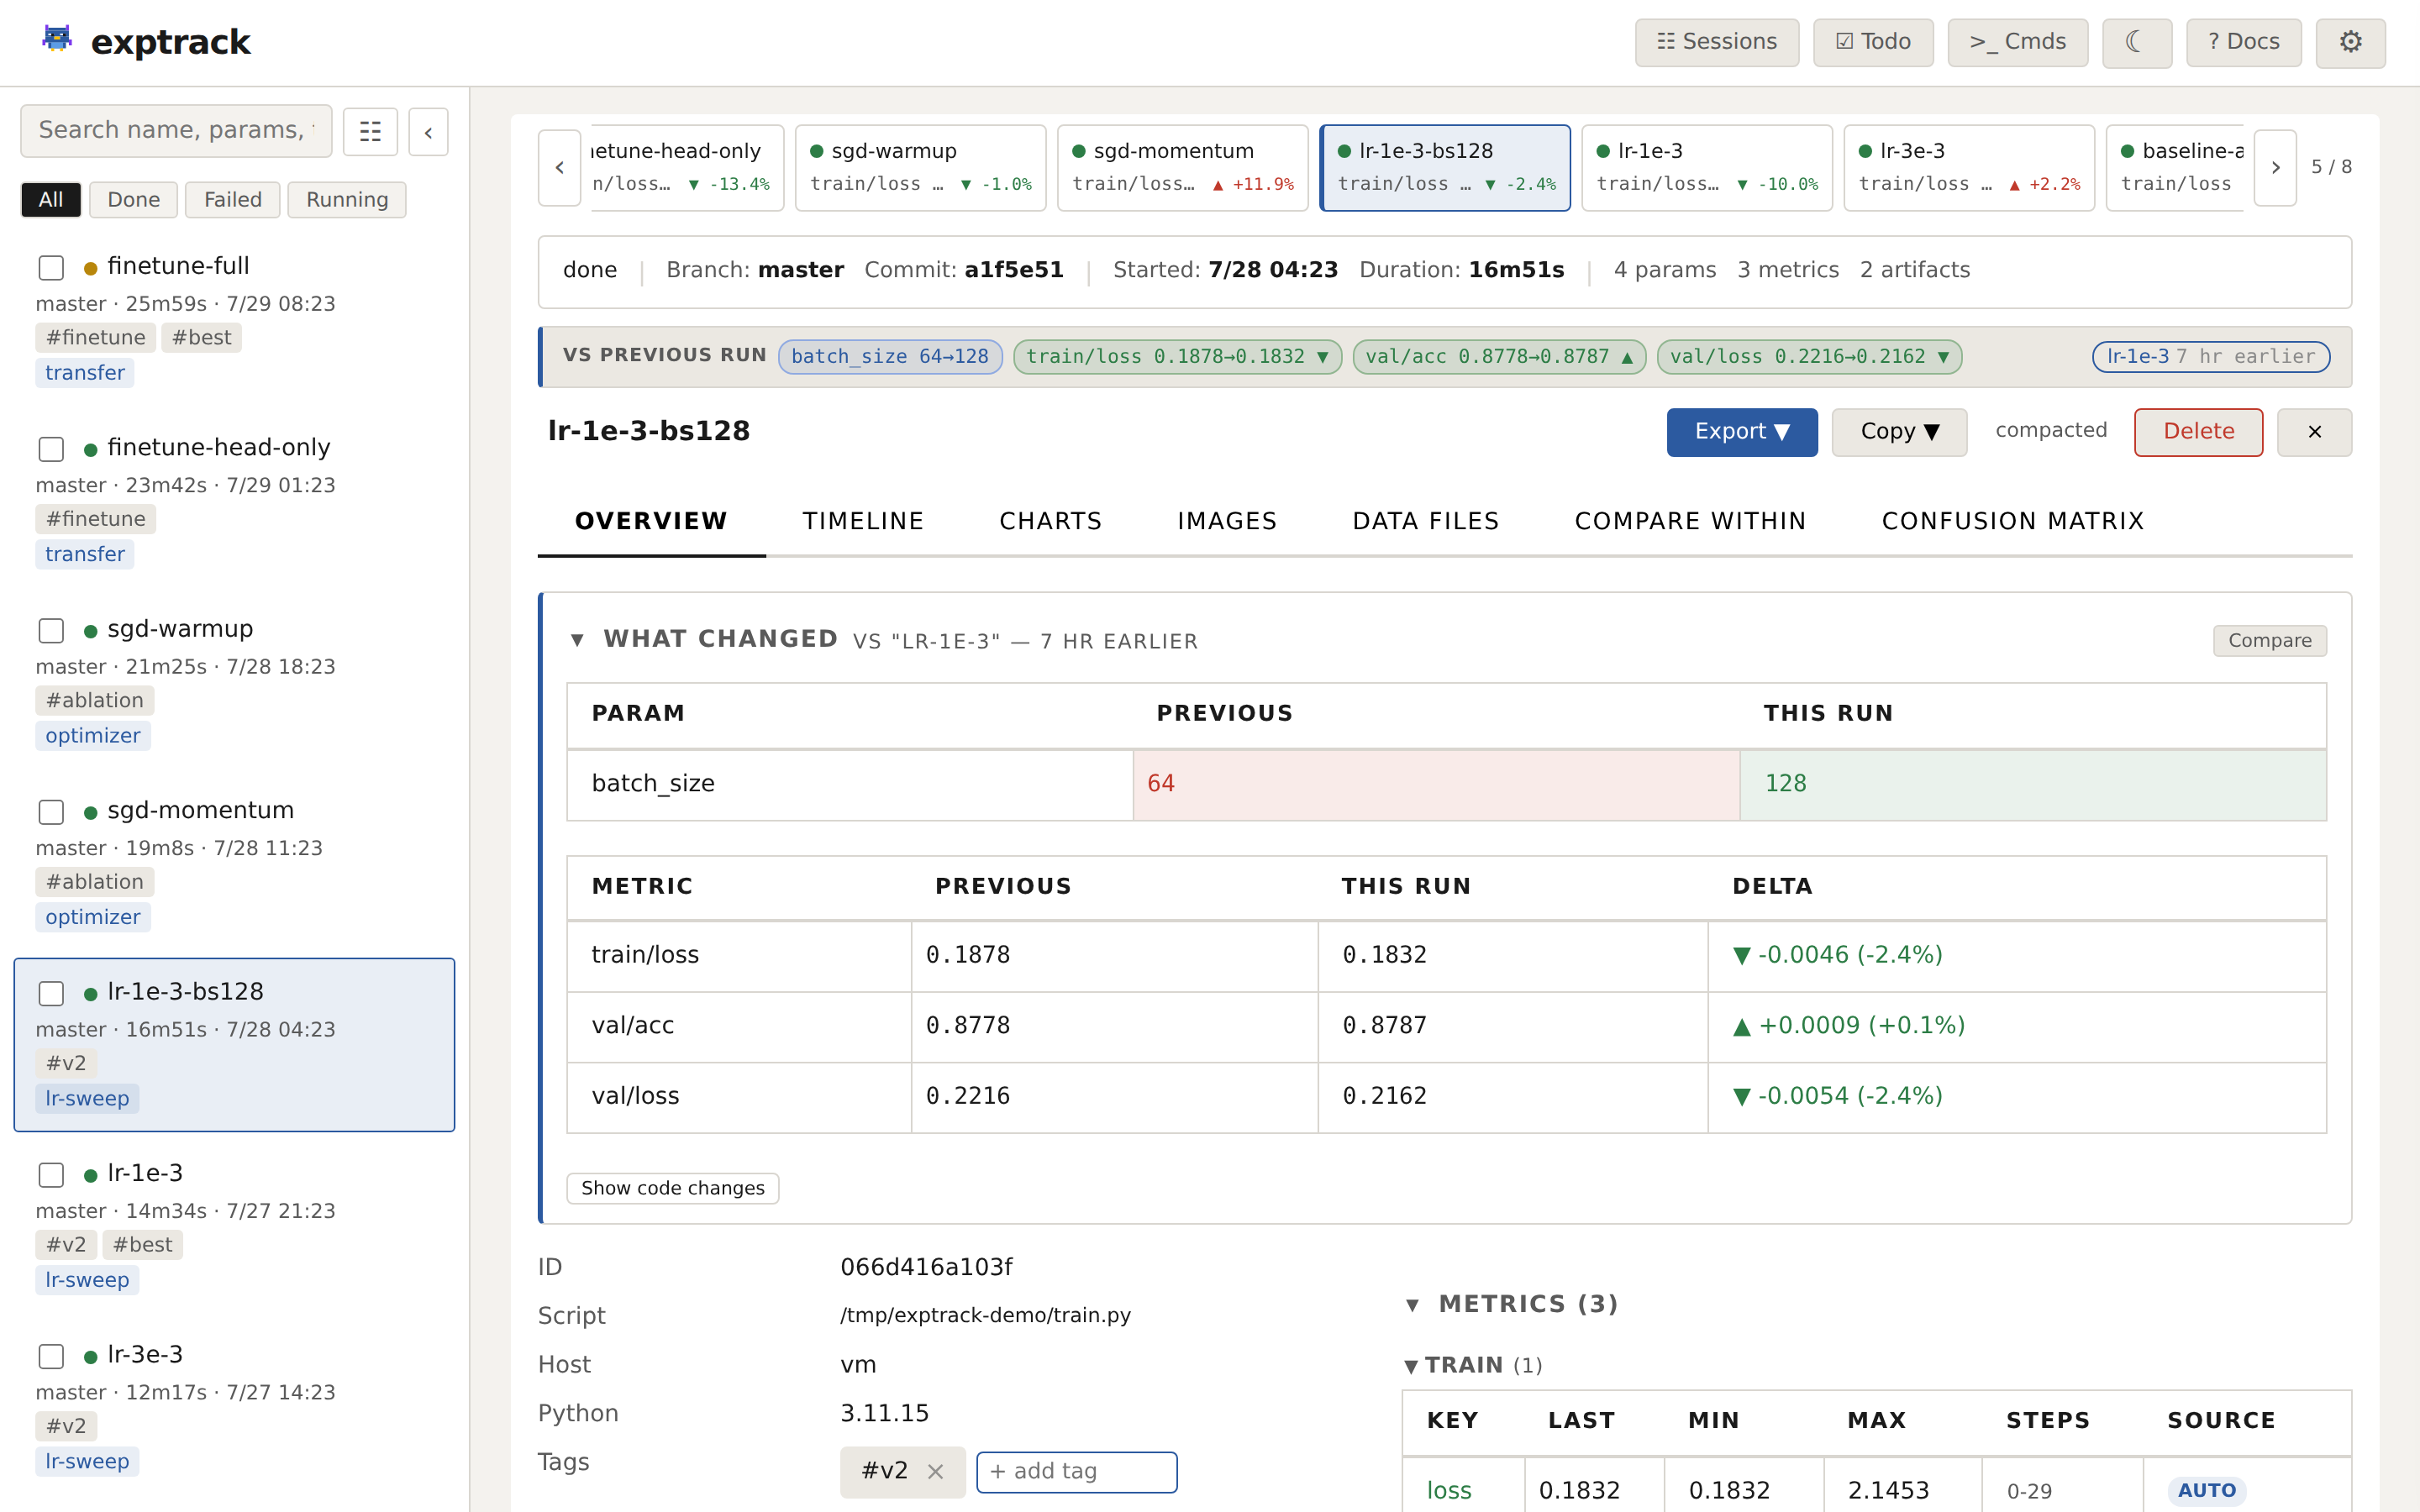
Every run's detail view opens with what changed since the last run of the same script — the params you edited, the metric deltas they produced, and the code diff behind them — plus a filmstrip for stepping between runs without going back to the list.
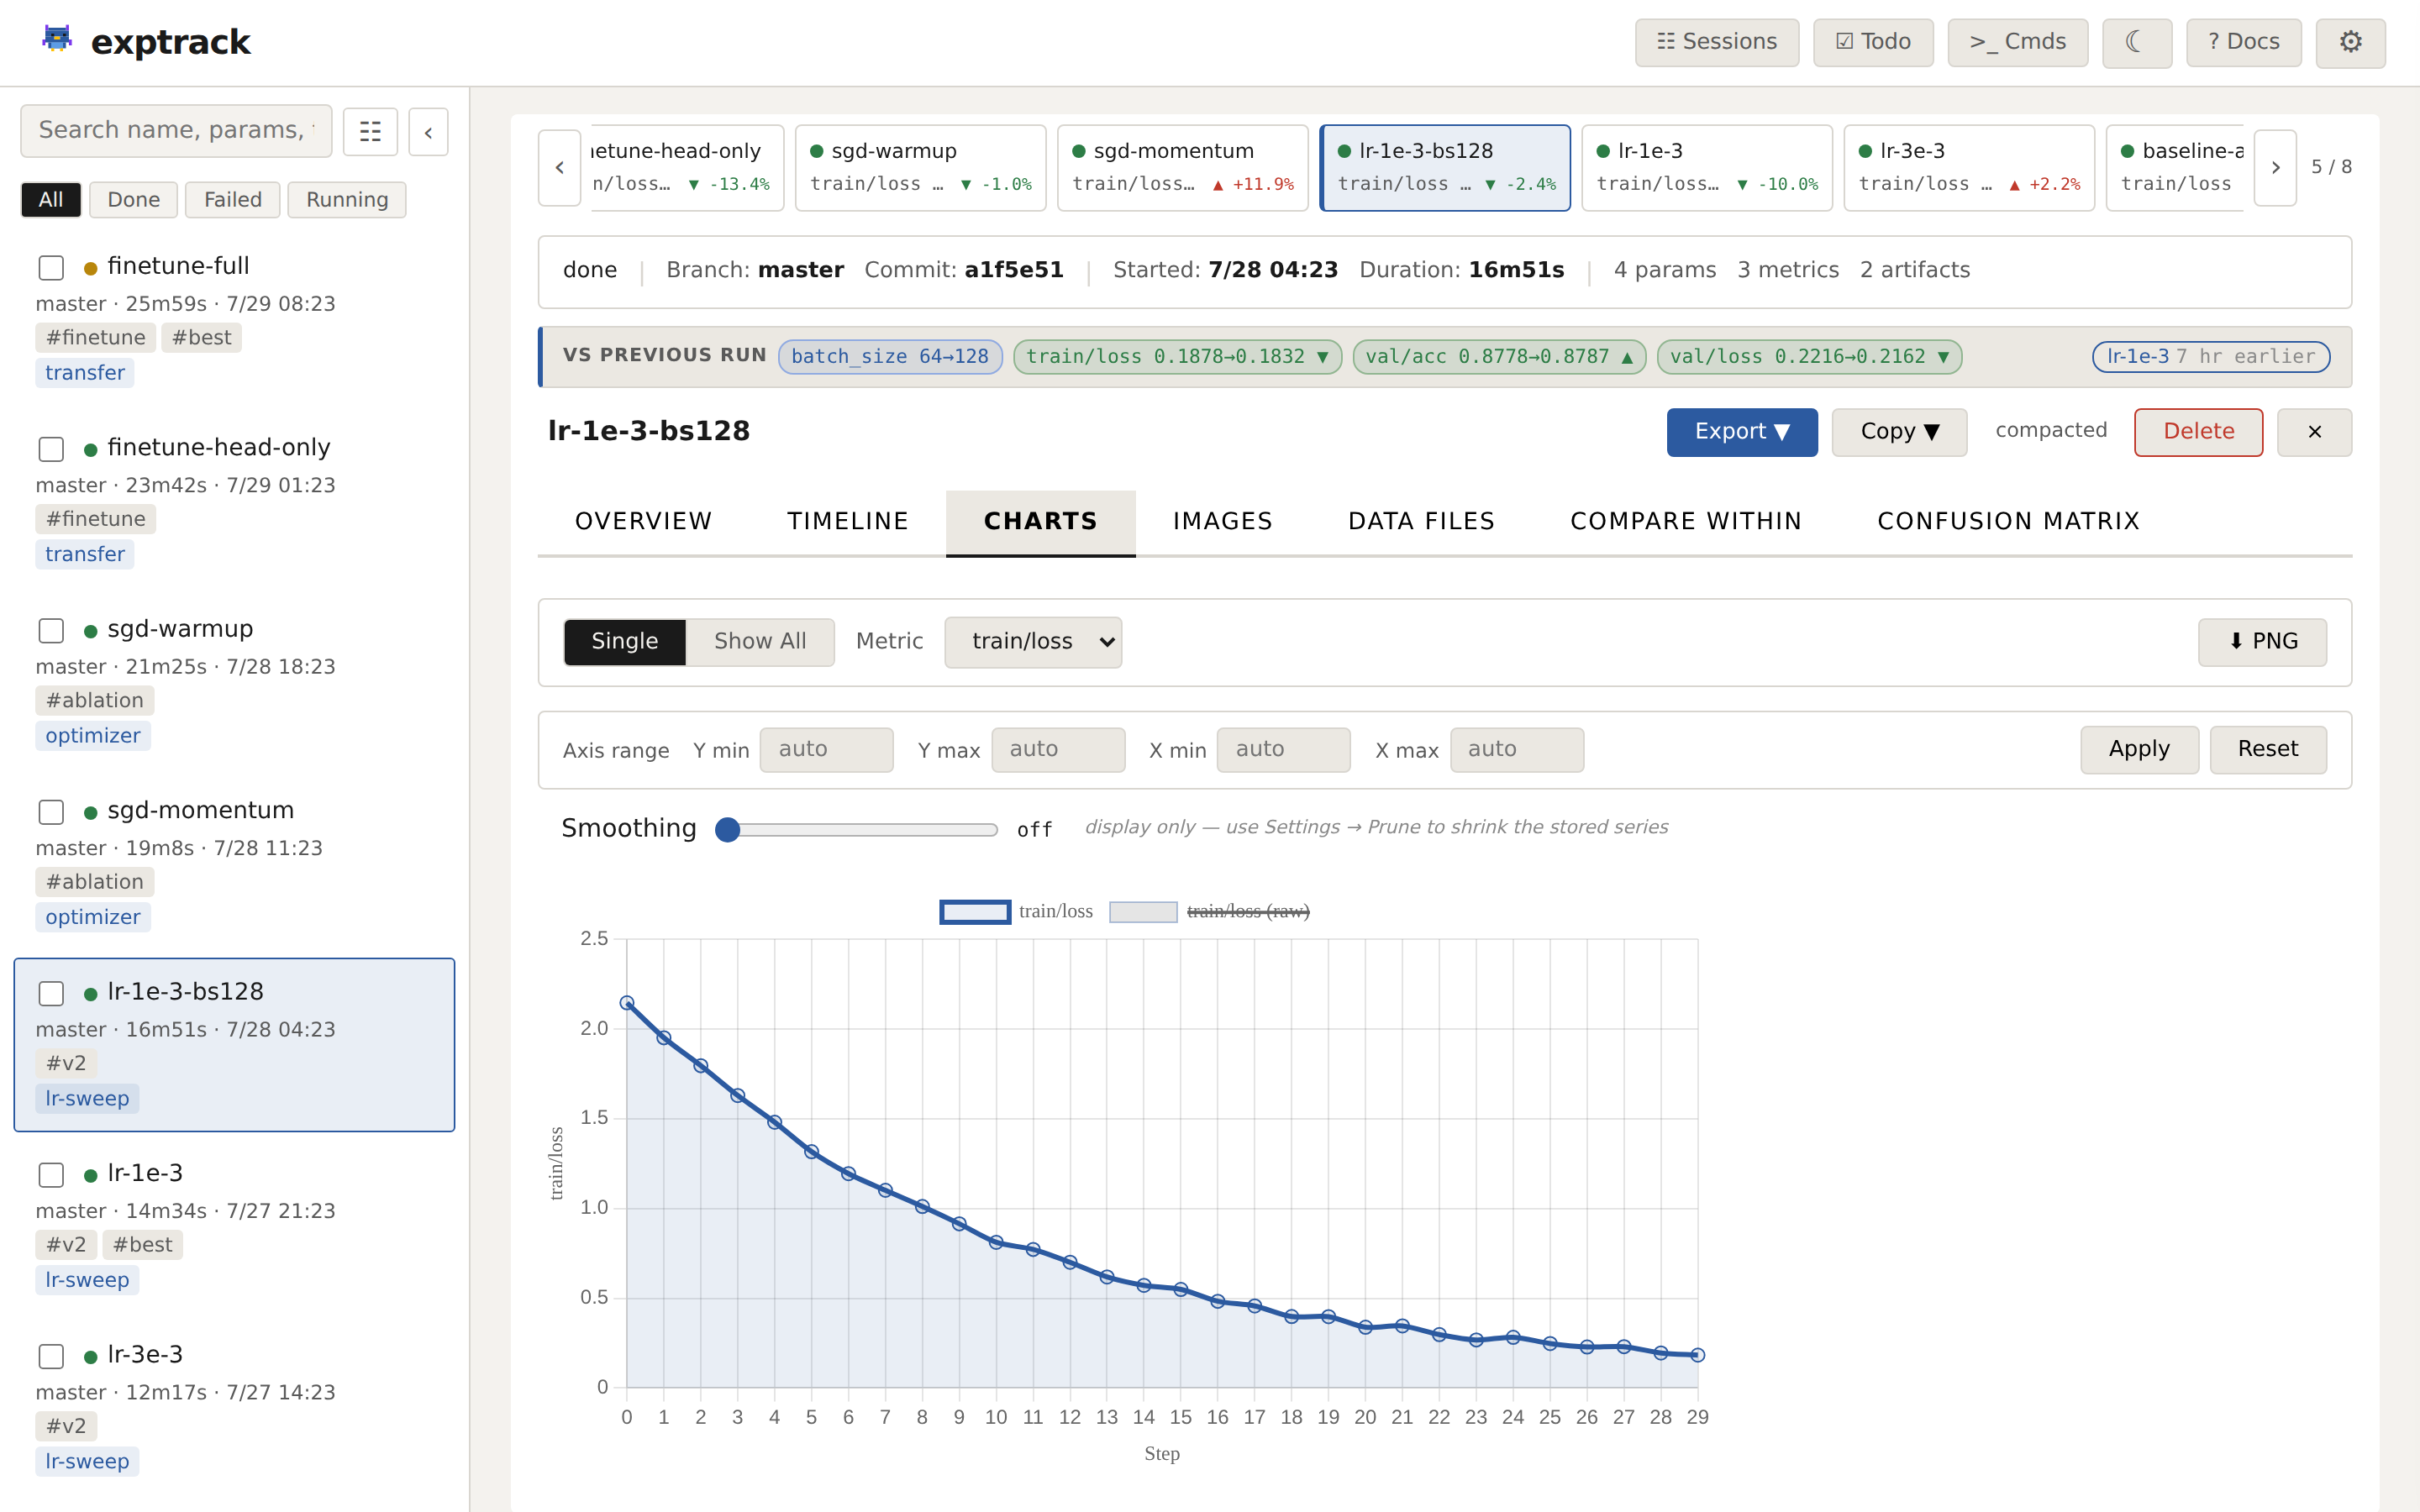
The Charts tab plots every logged metric with linear/log scales, typed axis bounds, and a display-only smoothing slider (the raw series stays visible behind it). Charts on a live run update in place every 5 seconds without resetting your tab, zoom, or metric pick.
What It Does
Organize experiments with studies, tags, and stages. Group related runs into studies (e.g., a train → eval → analyze pipeline), label them with tags (baseline, v2, ablation), and define numbered stages within each study.
Track Jupyter notebooks in detail. Every cell execution is recorded: code diffs between runs, variable changes with fingerprinting, and hyperparameter-like variables (lr, batch_size) are captured as parameters automatically.
Compare experiments visually. Side-by-side parameter diffs with overlay metric charts for pairs. Bar charts across three or more runs. Image artifacts support swipe and overlay comparison.
See what changed between one run and the next. Every run opens with a diff against the previous run of the same script — the params you edited, the metric deltas, and the code behind them. Deltas are polarity-aware: a rising loss is coloured as a regression, not an improvement.
Chart metrics over time. Interactive charts with linear/log scale, typed axis bounds, configurable downsampling, and a display-only smoothing slider. Write-time thinning for long training runs, plus exptrack prune to thin series you already recorded (first, last, min and max always survive). Sparkline previews in the experiment list.
Capture git state automatically. Branch, commit hash, and full diff against HEAD are stored with every run, plus a content-addressed snapshot of the script's own source — so two runs stay diffable against each other after you've edited the file.
Mirror TensorBoard scalars automatically. If your code already calls SummaryWriter.add_scalar / add_scalars / add_histogram, those values land in exptrack's metrics table too. No new dependency, no code change.
Version your inputs. When a run finishes, dataset-shaped parameters (--data_dir, --train, a .csv/.parquet path) are fingerprinted — size and content hash for files, a listing fingerprint for directories — and shown as a Datasets section on the run.
Keep failures useful. A crashed run records the full traceback, not just the message, and the dashboard shows it in a Run failed panel. A failed run stays available as a comparison baseline, because "it broke, I fixed it, what changed?" is the point.
Log and compare image artifacts. plt.savefig() calls are captured automatically. View images in a gallery grid, lightbox, or side-by-side/overlay comparison between experiments.
Delete safely. Deleting a run moves it to a Trash you can restore from; permanent deletion is a separate, explicit step, and files go to the OS Trash rather than being unlinked.
Explore in a notebook without losing the thread. Session Trees record the shape of exploration — checkpoints, branches, scratch and setup cells — as a tree you can compare, promote into experiments, and finalize into a study. See Session Trees.
Run entirely on your machine. One SQLite file, standard library only, no accounts or internet. Data stays local.
Four Ways to Use It
1. Wrap a script (easiest)
exptrack run train.py --lr 0.01 --epochs 20
Your script needs no modifications. exptrack captures argparse parameters, git state, code changes, and plt.savefig() artifacts automatically.
To log metrics, use the injected __exptrack__ global:
# Available only under `exptrack run`, no imports needed
exp = globals().get("__exptrack__")
for epoch in range(epochs):
    loss, acc = train(...)
    if exp:
        exp.log_metrics({"loss": loss, "accuracy": acc}, step=epoch)
The script still works with plain python train.py. The metrics lines are skipped when exp is None.
2. Jupyter notebook
%load_ext exptrack # add this to your first cell
Every cell is tracked: code diffs, variable changes, hyperparameter-like variables (lr, batch_size, etc.) become parameters, and plt.savefig() calls register artifacts.
Or use the explicit API:
import exptrack.notebook as exp

exp.start(lr=0.001, bs=32)
exp.metric("val/loss", 0.23, step=5)
exp.done()
Got the test numbers after the run finished? Attach them without hunting for
the run id — this works after %exp_done, and prints which run it logged onto:
%exp_log test_acc=0.93 train_acc=0.98
Re-ran the same notebook with a different model? Point the new run at the one you actually want to compare against, and the "vs previous" delta and "What changed" card both use it instead of whatever happened to run last:
exptrack variant-of <new_run_id> <original_run_id>
2b. Session Trees (notebook, opt-in)
Standard %load_ext exptrack records what you ran. Session Trees record
how you got there — the shape of your exploration as a tree of checkpoints
and branches you can read back weeks later. Activate explicitly (no session →
all session magics are silent no-ops, normal tracking is unchanged):
%load_ext exptrack
%exptrack session start "exploring threshold sensitivity"

# ...preprocess, run cells normally...

%exptrack checkpoint "after preprocessing clean"   # AFTER a stable change
%exptrack branch "try threshold 0.7 instead of 0.5" # BEFORE diverging

# ...try the new threshold...

%%scratch
# anything in this cell is executed but NEVER logged

%exptrack checkpoint "threshold 0.7 works"          # AFTER it works
%exptrack promote "0.7 outperformed baseline"       # link active exp to node
%exptrack session end
Timing rules of thumb:
| Magic | Run it… | Why |
|---|---|---|
%exptrack session start "..." |
once, before any other session magic | nothing else activates without it |
%exptrack checkpoint "..." |
after a stable change you might want to return to | snapshots a per-checkpoint git diff vs. the previous checkpoint |
%exptrack branch "..." |
before you start diverging | declares intent for the next segment of work; attaches under the most recent checkpoint |
%%scratch |
as the first line of any throwaway cell | the cell runs but the post-cell hook skips all logging |
%exptrack promote "..." |
after a run finishes promisingly | links the active Experiment to the current node so it shows up as → exp <id> in the tree |
%exptrack session end |
when you're done exploring | open branches with no checkpoint flip to abandoned (still visible, dimmed) |
Inspect from the CLI or the dashboard's ☰ Sessions tab:
exptrack sessions                # list sessions
exptrack session show <id>       # ASCII tree
exptrack session note <node> "…" # annotate a node after the fact
Full guide: docs/session-trees.md.
3. Shell / SLURM pipeline
For shell scripts, SLURM jobs, or multi-step workflows.
Your script (run.sh):
#!/bin/bash
LR=$1
EPOCHS=$2

eval $(exptrack run-start --name "$3" --lr $LR --epochs $EPOCHS)

python train.py --lr $LR --epochs $EPOCHS --output "$EXP_OUT"

exptrack run-finish $EXP_ID --metrics "$EXP_OUT/results.json"
In your terminal:
bash run.sh 0.01 50  baseline
bash run.sh 0.1  100 higher-lr

exptrack ls                       # see both runs
eval $(exptrack run-start ...) creates a new experiment and sets three variables inside your script: $EXP_ID (experiment ID), $EXP_NAME (run name), and $EXP_OUT (output directory — files written here are auto-discovered as artifacts). Each run of the script creates a separate experiment. On failure, call exptrack run-fail $EXP_ID "reason".
SLURM — submit with sbatch run.sh. SLURM env vars are captured automatically:
#!/bin/bash
#SBATCH --job-name=train_resnet
#SBATCH --gpus=1

eval $(exptrack run-start --lr 0.001 --batch-size 256)
trap 'exptrack run-fail "$EXP_ID" "Exit code $?"' ERR

python train.py --lr 0.001 --output "$EXP_OUT"
exptrack run-finish "$EXP_ID" --metrics "$EXP_OUT/results.json"
Multi-step — set --study on the first step, subsequent steps inherit it:
#!/bin/bash
eval $(exptrack run-start --study my-ablation --stage 1 --stage-name train --lr 0.01)
python train.py; exptrack run-finish $EXP_ID

# EXP_STUDY inherited, EXP_STAGE auto-increments to 2
eval $(exptrack run-start --stage-name eval)
python eval.py; exptrack run-finish $EXP_ID
Resuming experiments
If your script has a --resume flag, exptrack auto-detects it and continues the same experiment instead of creating a new one. Metrics, artifacts, and params all aggregate into the original run.
# First run
exptrack run train.py --lr 0.01 --epochs 50 --output_dir results/

# Resume from checkpoint — same experiment, metrics continue from where you left off
exptrack run train.py --lr 0.01 --epochs 100 --output_dir results/ --resume --ckpt results/model.pt
No extra flags for exptrack. Your script's --resume does double duty. See Configuration if your script uses a different flag like --continue or --load-checkpoint.
4. Python API (full control)
from exptrack.core import Experiment

with Experiment(params={"lr": 0.01, "optimizer": "adam"}) as exp:
    for epoch in range(100):
        loss, acc = train(...)
        exp.log_metrics({"loss": loss, "accuracy": acc}, step=epoch)
    exp.add_tag("baseline")
What Gets Captured Automatically
| Scripts | Notebooks | Shell/SLURM | Python API | |
|---|---|---|---|---|
| Params | From argparse / sys.argv | From HP-like variables | You pass them | You log them |
| Git state | Yes | Yes | Yes | Yes |
| Code changes | Script diff vs last commit | Cell diffs + variable changes | ||
| Artifacts | plt.savefig + new files |
plt.savefig |
You log them | You log them |
| Status | Automatic (done/failed) | You call done() |
You call run-finish |
Automatic with with |
Metrics always need explicit logging. exptrack captures what you ran and how your code changed, but it can't decide which numbers matter to you.
Managing Experiments
# List and inspect
exptrack ls                        # last 20 experiments
exptrack show <id>                 # full details
exptrack diff <id>                 # colorized git diff
exptrack compare <id1> <id2>       # side-by-side comparison
exptrack history <id>              # param/metric change history
exptrack timeline <id>             # chronological event log

# Tag, annotate, and organize
exptrack tag <id> baseline
exptrack note <id> "tried higher dropout, worse results"
exptrack study <id> ablation-v2    # group into a study
exptrack stage <id> 1 train        # assign a numbered stage

# Export (JSON, Markdown, CSV, TSV)
exptrack export <id>               # JSON summary to stdout
exptrack export <id> --full        # every metric point + every artifact
exptrack export <id> --format csv  # CSV
exptrack export --all --format md  # bulk export

# Clean up and maintenance
exptrack rm <id>                   # delete one run
exptrack clean                     # bulk-delete all failed runs
exptrack compact                   # strip git diffs to save space
exptrack backup                    # backup the database
exptrack restore <path>            # restore from backup
exptrack storage                   # show DB size and stats
Exports are summaries by default. A run that logs every iteration stores tens of thousands of metric points and can register thousands of checkpoints — dumping one JSON object per point and one per file buried the params and the final numbers under the raw data. So every format, JSON included, ships one entry per metric key (count, first, last, min, max, with the step each extreme occurred at) and a capped artifact list alongside an artifacts_summary giving the shape of the rest — counts by type and by containing directory (outputs/ckpts: 3990). Nothing is dropped silently: the summary always states how many were omitted.
Add --full (or ?full=1 on the dashboard's export endpoint, Export → JSON (full) in the UI) for the complete, round-trippable payload: the raw metrics_series and every artifact. --max-artifacts N sets the list cap directly; 0 lists them all.
Dashboard Features
exptrack ui                  # auto-generates a per-session token, prints URL
exptrack ui --token secret   # set a persistent token (saved to .exptrack/dashboard_token)
exptrack ui --no-auth        # disable auth (local-only, trusted environments)
exptrack ui-stop             # kill a stale dashboard still holding port 7331
- Experiment list grouped by script (or study, branch, commit, day), with status filters, search, sparkline charts, and customizable columns — including any captured parameter as a sortable column, one click to add the ones that actually vary between runs
- Detail view with a "what changed vs the previous run" strip, parameters, metrics, interactive charts, code changes, git diff, datasets, a Run failed traceback panel, and a reproducible command with one-click copy
- Filmstrip across the top of the detail view — step between runs with ← / → without going back to the list
- Compare experiments pair-wise (side-by-side with overlay charts, plus a code-diff panel) or across 3+ runs (bar charts)
- Charts tab with single/all views, linear/log scales, typed axis bounds, downsampling, and a smoothing slider; live runs update in place every 5 seconds without resetting your view
- Timeline showing cell executions, variable changes, captured cell output, and artifact creation (notebooks)
- Sessions tab rendering Session Trees as a git-style graph — branch, compare, promote a node into an experiment, or finalize a whole session into a study
- Images displayed in a gallery grid with lightbox and side-by-side/overlay/swipe comparison
- Data files (CSV, JSON, JSONL, TSV) rendered as interactive sortable tables
- Confusion matrix calculator per run — multiple named matrices, side-by-side compare, results saveable as metrics
- Trash with restore, plus an explicit permanent-delete step (files go to the OS Trash)
- Storage panel showing bytes by metric key and the largest runs, with a Prune… action that previews before it deletes
- Toolbox with a commands notepad (templated
{{variables}}, exportable as a runnable.sh) and a todo list with due dates; pinnable as a side panel - Manual experiment creation for logging runs that weren't tracked automatically
- Inline editing for names, tags, notes, studies, and stages (double-click to edit)
- Studies and stages to organize multi-step pipelines, with highlight mode and filtering
- Tag autocomplete, searchable filter dropdowns, "needs naming" filter, timezone selector, dark mode, bulk operations, and export (JSON summary, JSON full, Markdown, CSV, TSV, Text)
Installation
# From GitHub
pip install git+https://github.com/mikylab/exptrack.git

# Local / development
git clone https://github.com/mikylab/exptrack.git
cd exptrack && pip install -e .
Only standard library dependencies. Requires Python 3.9+.
Does it affect other packages? Patches only activate when you explicitly use exptrack run or %load_ext exptrack, and they're removed when the script or session ends.
Examples
The examples/ directory has ready-to-run scripts:
| Example | What it shows |
|---|---|
basic_script.py |
Automatic tracking with exptrack run, no imports needed |
resnet_exptrack_run.py |
Metric logging via the __exptrack__ global |
resnet_python_api.py |
Same training using the explicit Python API |
manual_tracking.py |
Full lifecycle: parameters, metrics, tags, artifacts |
notebook_example.py |
Notebook API as a plain script |
shell_script_example.sh |
Pure shell workflow (no Python in the workload) |
pipeline_example.sh |
Shell/SLURM single-step pipeline |
pipeline_multistep.sh |
Multi-step pipeline: train, test, analyze |
pipeline_wrapper.sh |
Wrapper script with auto-inherited study and stages |
slurm_job.sh |
SLURM sbatch script with error trapping |
resume_training.py |
Resuming a run — metrics aggregate into one experiment |
Further Documentation
| Doc | What's in it |
|---|---|
| CLI Reference | Every subcommand |
| Configuration | Every .exptrack/config.json option |
| Python API | Experiment class properties and methods |
| Plugins | Writing plugins, GitHub Sync |
| How It Works | Capture mechanisms, storage design, schema |
| FAQ | Common questions |
| Troubleshooting | Solutions for common issues |
| Contributing | Development setup, linting, guidelines |
License
MIT. See LICENSE.
Project details
Verified details
These details have been verified by PyPIProject links
GitHub Statistics
Maintainers
Release history Release notifications | RSS feed


Download files
Download the file for your platform. If you're not sure which to choose, learn more about installing packages.
Source Distribution
Built Distribution
Filter files by name, interpreter, ABI, and platform.
If you're not sure about the file name format, learn more about wheel file names.
Copy a direct link to the current filters
File details
Details for the file exptrack-1.0.0.tar.gz.
File metadata
- Download URL: exptrack-1.0.0.tar.gz
- Upload date:
- Size: 1.6 MB
- Tags: Source
- Uploaded using Trusted Publishing? Yes
- Uploaded via: twine/7.0.0 CPython/3.13.14
File hashes
| Algorithm | Hash digest | |
|---|---|---|
| SHA256 |
c4cc1ac637aa83bf3c1ba81cfddd779f77ce59afec98e2354d22c7fca8545778
|
|
| MD5 |
7cd8a54a486bf6701e6ceb36888288ef
|
|
| BLAKE2b-256 |
20622d33e56429a99fc2918f6172930d866eebbfa6ee2f3783aa12b373a64b4c
|
Provenance
The following attestation bundles were made for exptrack-1.0.0.tar.gz:
Publisher:
publish.yml on mikylab/exptrack
-
Statement:
-
Statement type:
https://in-toto.io/Statement/v1 -
Predicate type:
https://docs.pypi.org/attestations/publish/v1 -
Subject name:
exptrack-1.0.0.tar.gz -
Subject digest:
c4cc1ac637aa83bf3c1ba81cfddd779f77ce59afec98e2354d22c7fca8545778 - Sigstore transparency entry: 2314264457
- Sigstore integration time:
-
Permalink:
mikylab/exptrack@3d24989881ad6c42c183cfb76afb002b7e820dbc -
Branch / Tag:
refs/tags/v1.0.0 - Owner: https://github.com/mikylab
-
Access:
public
-
Token Issuer:
https://token.actions.githubusercontent.com -
Runner Environment:
github-hosted -
Publication workflow:
publish.yml@3d24989881ad6c42c183cfb76afb002b7e820dbc -
Trigger Event:
release
-
Statement type:
File details
Details for the file exptrack-1.0.0-py3-none-any.whl.
File metadata
- Download URL: exptrack-1.0.0-py3-none-any.whl
- Upload date:
- Size: 605.7 kB
- Tags: Python 3
- Uploaded using Trusted Publishing? Yes
- Uploaded via: twine/7.0.0 CPython/3.13.14
File hashes
| Algorithm | Hash digest | |
|---|---|---|
| SHA256 |
854e4475fadac4f4b80171aa8767e67e451335319788b9421f46d591c10ade17
|
|
| MD5 |
be6d924a95b1976b06b548ed73794322
|
|
| BLAKE2b-256 |
d8e5f6a280acb4e7bdd3ee2b969ca1202a33653bdeebecf71365b24d999fb97c
|
Provenance
The following attestation bundles were made for exptrack-1.0.0-py3-none-any.whl:
Publisher:
publish.yml on mikylab/exptrack
-
Statement:
-
Statement type:
https://in-toto.io/Statement/v1 -
Predicate type:
https://docs.pypi.org/attestations/publish/v1 -
Subject name:
exptrack-1.0.0-py3-none-any.whl -
Subject digest:
854e4475fadac4f4b80171aa8767e67e451335319788b9421f46d591c10ade17 - Sigstore transparency entry: 2314264497
- Sigstore integration time:
-
Permalink:
mikylab/exptrack@3d24989881ad6c42c183cfb76afb002b7e820dbc -
Branch / Tag:
refs/tags/v1.0.0 - Owner: https://github.com/mikylab
-
Access:
public
-
Token Issuer:
https://token.actions.githubusercontent.com -
Runner Environment:
github-hosted -
Publication workflow:
publish.yml@3d24989881ad6c42c183cfb76afb002b7e820dbc -
Trigger Event:
release
-
Statement type:






