Excel to structured JSON (tables, shapes, charts) for LLM/RAG pipelines

Project description
ExStruct — Excel Structured Extraction Engine

ExStruct reads Excel workbooks and outputs structured data (tables, shapes, charts) as JSON by default, with optional YAML/TOON formats. It targets both COM/Excel environments (rich extraction) and non-COM environments (cells + table candidates), with tunable detection heuristics and multiple output modes to fit LLM/RAG pipelines.
Features
- Excel → Structured JSON: cells, shapes, charts, and table candidates per sheet.
- Output modes:
light(cells + table candidates only),standard(texted shapes + arrows, charts),verbose(all shapes with width/height). - Formats: JSON (compact by default,
--prettyavailable), YAML, TOON (optional dependencies). - Table detection tuning: adjust heuristics at runtime via API.
- CLI rendering (Excel required): optional PDF and per-sheet PNGs.
- Graceful fallback: if Excel COM is unavailable, extraction falls back to cells + table candidates without crashing.
Installation
pip install exstruct
Optional extras:
- YAML:
pip install pyyaml - TOON:
pip install python-toon - Rendering (PDF/PNG): Excel +
pip install pypdfium2
Quick Start (CLI)
exstruct input.xlsx > output.json          # compact JSON to stdout (default)
exstruct input.xlsx -o out.json --pretty   # pretty JSON to a file
exstruct input.xlsx --format yaml          # YAML (needs pyyaml)
exstruct input.xlsx --format toon          # TOON (needs python-toon)
exstruct input.xlsx --sheets-dir sheets/   # split per sheet in chosen format
exstruct input.xlsx --mode light           # cells + table candidates only
exstruct input.xlsx --pdf --image          # PDF and PNGs (Excel required)
Quick Start (Python)
from pathlib import Path
from exstruct import extract, export, set_table_detection_params

# Tune table detection (optional)
set_table_detection_params(table_score_threshold=0.3, density_min=0.04)

# Extract with modes: "light", "standard", "verbose"
wb = extract("input.xlsx", mode="standard")
export(wb, Path("out.json"), pretty=False)  # compact JSON

# Model helpers: iterate, index, and serialize directly from the models
first_sheet = wb["Sheet1"]           # __getitem__ access
for name, sheet in wb:               # __iter__ yields (name, SheetData)
    print(name, len(sheet.rows))
wb.save("out.json", pretty=True)     # WorkbookData → file (by extension)
first_sheet.save("sheet.json")       # SheetData → file (by extension)
print(first_sheet.to_yaml())         # YAML text (requires pyyaml)
Table Detection Tuning
from exstruct import set_table_detection_params

set_table_detection_params(
    table_score_threshold=0.35,  # increase to be stricter
    density_min=0.05,
    coverage_min=0.2,
    min_nonempty_cells=3,
)
Use higher thresholds to reduce false positives; lower them if true tables are missed.
Output Modes
- light: cells + table candidates (no COM needed).
- standard: texted shapes + arrows, charts (COM if available), table candidates.
- verbose: all shapes (with width/height), charts, table candidates.
Error Handling / Fallbacks
- Excel COM unavailable → falls back to cells + table candidates; shapes/charts empty.
- Shape extraction failure → logs warning, still returns cells + table candidates.
- CLI prints errors to stdout/stderr and returns non-zero on failures.
Optional Rendering
Requires Excel and pypdfium2.
exstruct input.xlsx --pdf --image --dpi 144
Creates <output>.pdf and <output>_images/ PNGs per sheet.
Benchmark: Excel Structuring Demo
To show how well exstruct can structure Excel, we parse a workbook that combines three elements on one sheet and share an AI reasoning benchmark that uses the JSON output.
- Table (sales data)
- Line chart
- Flowchart built only with shapes
(Screenshot below is the actual sample Excel sheet)
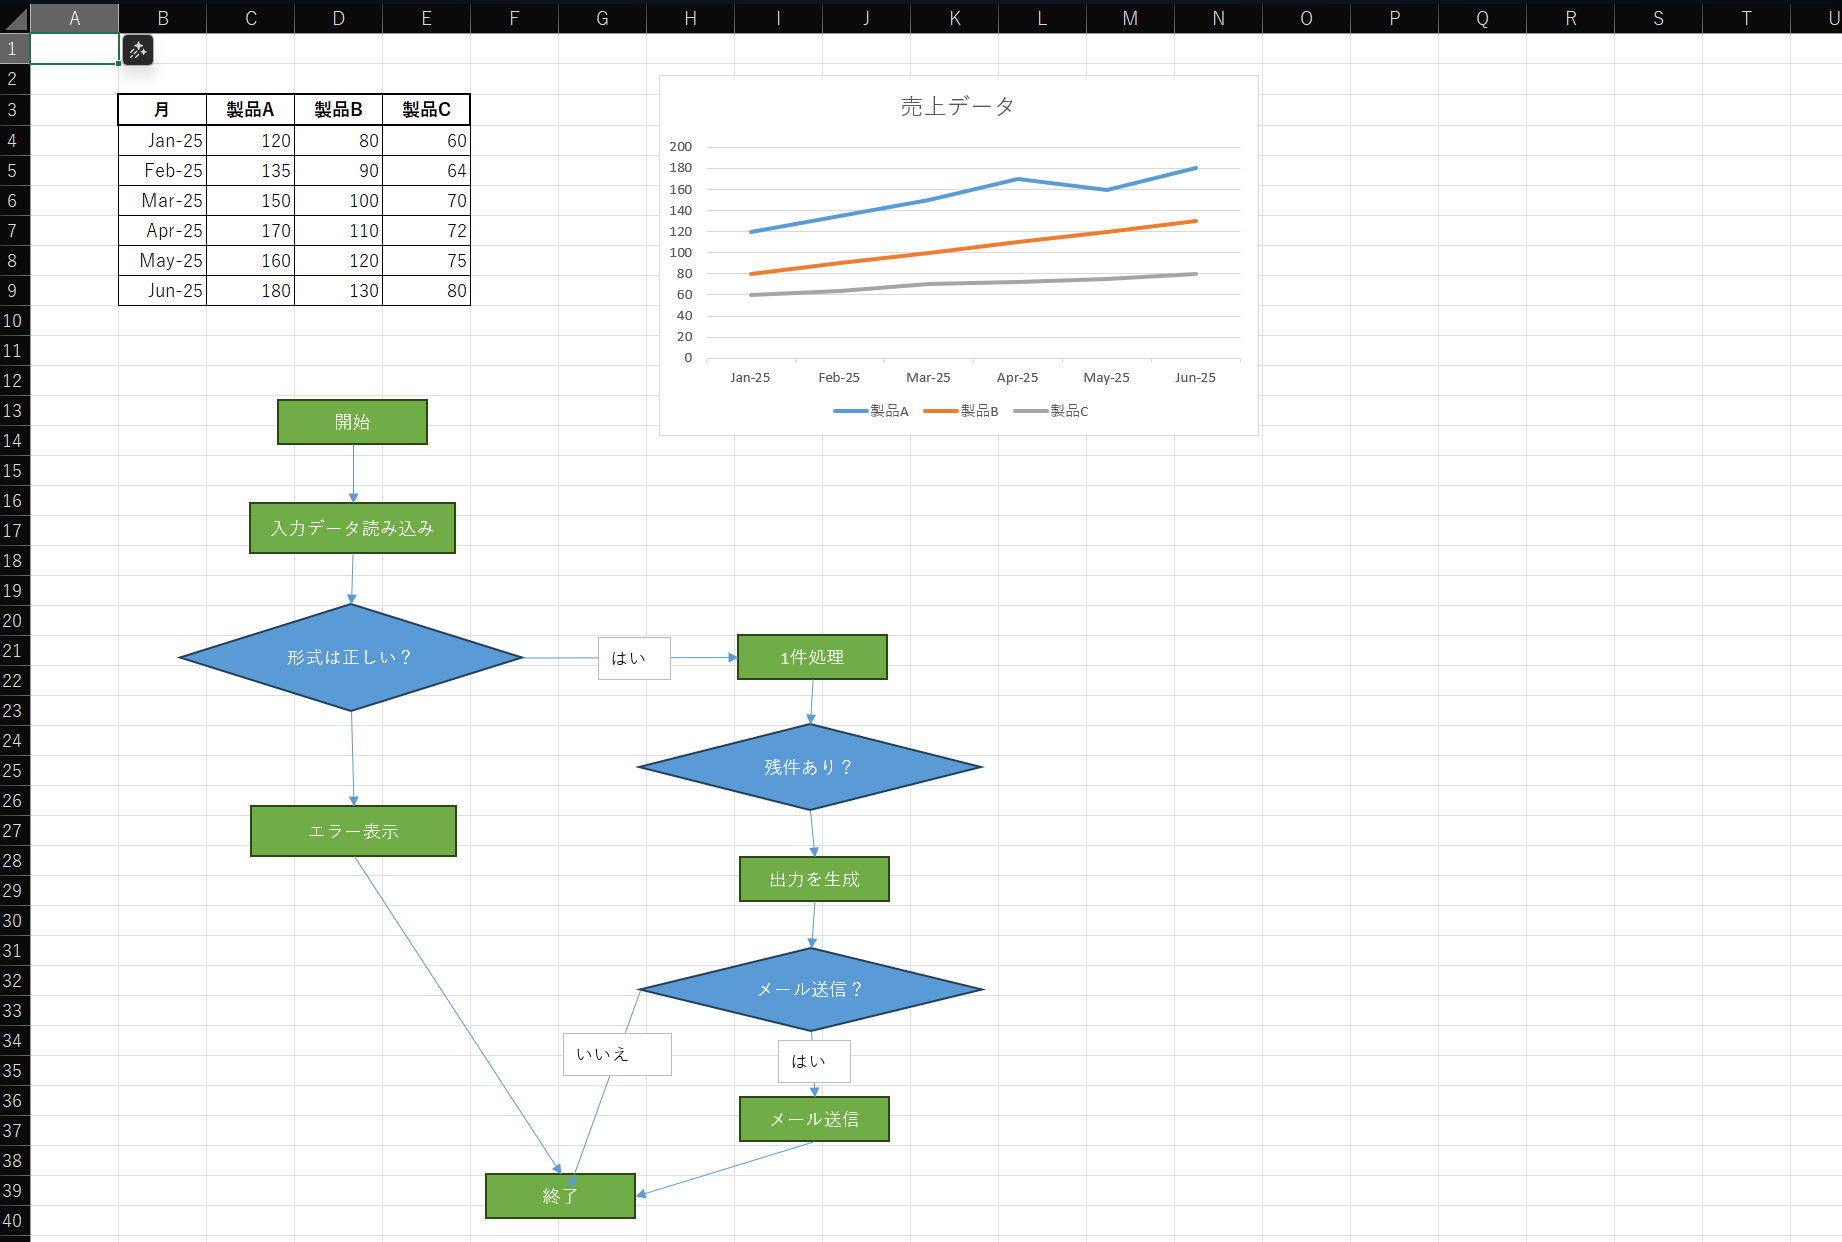
1. Input: Excel Sheet Overview
This sample Excel contains:
① Table (Sales Data)
| Month | Product A | Product B | Product C |
|---|---|---|---|
| Jan-25 | 120 | 80 | 60 |
| Feb-25 | 135 | 90 | 64 |
| Mar-25 | 150 | 100 | 70 |
| Apr-25 | 170 | 110 | 72 |
| May-25 | 160 | 120 | 75 |
| Jun-25 | 180 | 130 | 80 |
② Chart (Line Chart)
- Title: Sales Data
- Series: Product A / Product B / Product C (six months)
- Y axis: 0–200
③ Flowchart built with shapes
The sheet includes this flow:
- Start / End
- Format check
- Loop (items remaining?)
- Error handling
- Yes/No decision for sending email
2. Output: Structured JSON produced by exstruct (excerpt)
Below is a shortened JSON output example from parsing this Excel workbook.
{
  "book_name": "sample.xlsx",
  "sheets": {
    "Sheet1": {
      "rows": [
        {
          "r": 3,
          "c": {
            "1": "月",
            "2": "製品A",
            "3": "製品B",
            "4": "製品C"
          }
        },
        ...
      ],
      "shapes": [
        {
          "text": "開始",
          "l": 148,
          "t": 220,
          "type": "AutoShape-FlowchartProcess"
        },
        {
          "text": "入力データ読み込み",
          "l": 132,
          "t": 282,
          "type": "AutoShape-FlowchartProcess"
        },
        {
          "l": 193,
          "t": 246,
          "type": "AutoShape-Mixed",
          "begin_arrow_style": 1,
          "end_arrow_style": 2,
          "direction": "N"
        },
        ...
      ],
      "charts": [
        {
          "name": "Chart 1",
          "chart_type": "Line",
          "title": "売上データ",
          "y_axis_range": [
            0.0,
            200.0
          ],
          "series": [
            {
              "name": "製品A",
              "name_range": "Sheet1!$C$3",
              "x_range": "Sheet1!$B$4:$B$9",
              "y_range": "Sheet1!$C$4:$C$9"
            },
            ...
          ],
          "l": 377,
          "t": 25
        }
      ],
      "table_candidates": [
        "B3:E9"
      ]
    }
  }
}
3. How AI (Copilot / LLM) interprets the JSON
Below is the Markdown reconstruction of the Excel workbook. The table, chart, and flowchart are all represented.

---

## 📊 Sales Data Table

| Month      | Product A | Product B | Product C |
| ---------- | --------- | --------- | --------- |
| 2025-01-01 | 120       | 80        | 60        |
| 2025-02-01 | 135       | 90        | 64        |
| 2025-03-01 | 150       | 100       | 70        |
| 2025-04-01 | 170       | 110       | 72        |
| 2025-05-01 | 160       | 120       | 75        |
| 2025-06-01 | 180       | 130       | 80        |

---

## 📈 Sales Data (Line Chart)

- Chart title: **売上データ (Sales Data)**
- Chart type: Line
- Y-axis range: 0 to 200
- Data series:
  - Product A: 120 → 135 → 150 → 170 → 160 → 180
  - Product B: 80 → 90 → 100 → 110 → 120 → 130
  - Product C: 60 → 64 → 70 → 72 → 75 → 80

---

## 🔄 Process Flow (Mermaid Flowchart)

```mermaid
flowchart TD
    A[Start]
    B[Load input data]
    C{Is format valid?}
    D[Show error]
    E[Process one item]
    F{Items remaining?}
    G[Generate output]
    H{Send email?}
    I[Send email]
    J[Finish]

    A --> B
    B --> C
    C -- no --> D
    C -- yes --> E
    E --> F
    F -- yes --> E
    F -- no --> G
    G --> H
    H -- yes --> I
    H -- no --> J
    I --> J
```
From this we can see:
exstruct's JSON is already in a format that AI can read and reason over directly.
4. Summary
This benchmark confirms exstruct can:
- Parse tables, charts, and shapes (flowcharts) simultaneously
- Convert the semantic structure of Excel into JSON
- Let AI/LLMs read that JSON directly and reconstruct the workbook contents
In short, exstruct = “an engine that converts Excel into a format AI can understand.”
Notes
- Default JSON is compact to reduce tokens; use
--prettyorpretty=Truewhen readability matters. - Field
table_candidatesreplacestables; adjust downstream consumers accordingly.
License
BSD-3-Clause. See LICENSE for details.
Documentation
- API Reference (GitHub Pages): https://harumiweb.github.io/exstruct/
Release history Release notifications | RSS feed


Download files
Download the file for your platform. If you're not sure which to choose, learn more about installing packages.
Source Distribution
Built Distribution
Filter files by name, interpreter, ABI, and platform.
If you're not sure about the file name format, learn more about wheel file names.
Copy a direct link to the current filters
File details
Details for the file exstruct-0.2.0.tar.gz.
File metadata
- Download URL: exstruct-0.2.0.tar.gz
- Upload date:
- Size: 26.6 kB
- Tags: Source
- Uploaded using Trusted Publishing? No
- Uploaded via: uv/0.8.4
File hashes
| Algorithm | Hash digest | |
|---|---|---|
| SHA256 |
9859eaa1320e2ae5c8a6bbca07953aeacad9d335b7249ad4ef96805e55512ccd
|
|
| MD5 |
121ef8f1a9d9390b2bdf6a8758532fe6
|
|
| BLAKE2b-256 |
7c80d21d90d2925da25edbeb4538f843338b58702061e49e420ec053c81df62c
|
File details
Details for the file exstruct-0.2.0-py3-none-any.whl.
File metadata
- Download URL: exstruct-0.2.0-py3-none-any.whl
- Upload date:
- Size: 31.1 kB
- Tags: Python 3
- Uploaded using Trusted Publishing? No
- Uploaded via: uv/0.8.4
File hashes
| Algorithm | Hash digest | |
|---|---|---|
| SHA256 |
5e8cd2cb637aa604c09fb9b6889b42913bf7cc7b43c41932c70b76ea680c72a1
|
|
| MD5 |
df6eb608a9dcd45091480947b0a92123
|
|
| BLAKE2b-256 |
ba3e3d4ea0be050fd605139ed11cca3742d5439ac2a3f1ad6cf4baf3305bc13e
|


