
FactSet Report Analyzer
A Python package for extracting quarterly EPS (Earnings Per Share) estimates from FactSet financial reports using OCR and image processing techniques.
⚠️ Disclaimer: This package is for educational and research purposes only. For production use, please use FactSet's official API. This package processes publicly available PDF reports and is not affiliated with or endorsed by FactSet.
Overview
This project processes chart images containing S&P 500 quarterly EPS data and extracts quarter labels (e.g., Q1'14, Q2'15) and corresponding EPS values. The extracted data is saved in CSV format for further analysis.
Motivation
Financial data providers (FactSet, Bloomberg, Investing.com, etc.) typically offer historical EPS data as actual values—once a quarter's earnings are reported, the estimate is overwritten with the actual figure. This creates a challenge for backtesting predictive models: using historical data means testing against information that was already reflected in stock prices at the time, making it difficult to evaluate the true predictive power of EPS estimates.
To address this, this project extracts point-in-time EPS estimates from historical earnings insight reports. By preserving the estimates as they appeared at each report date (before actual earnings were announced), a dataset can be built that accurately reflects what was known and expected at each point in time, enabling more meaningful backtesting and predictive analysis.
Current P/E Ratio Analysis (🔄 Auto-updated every Monday)
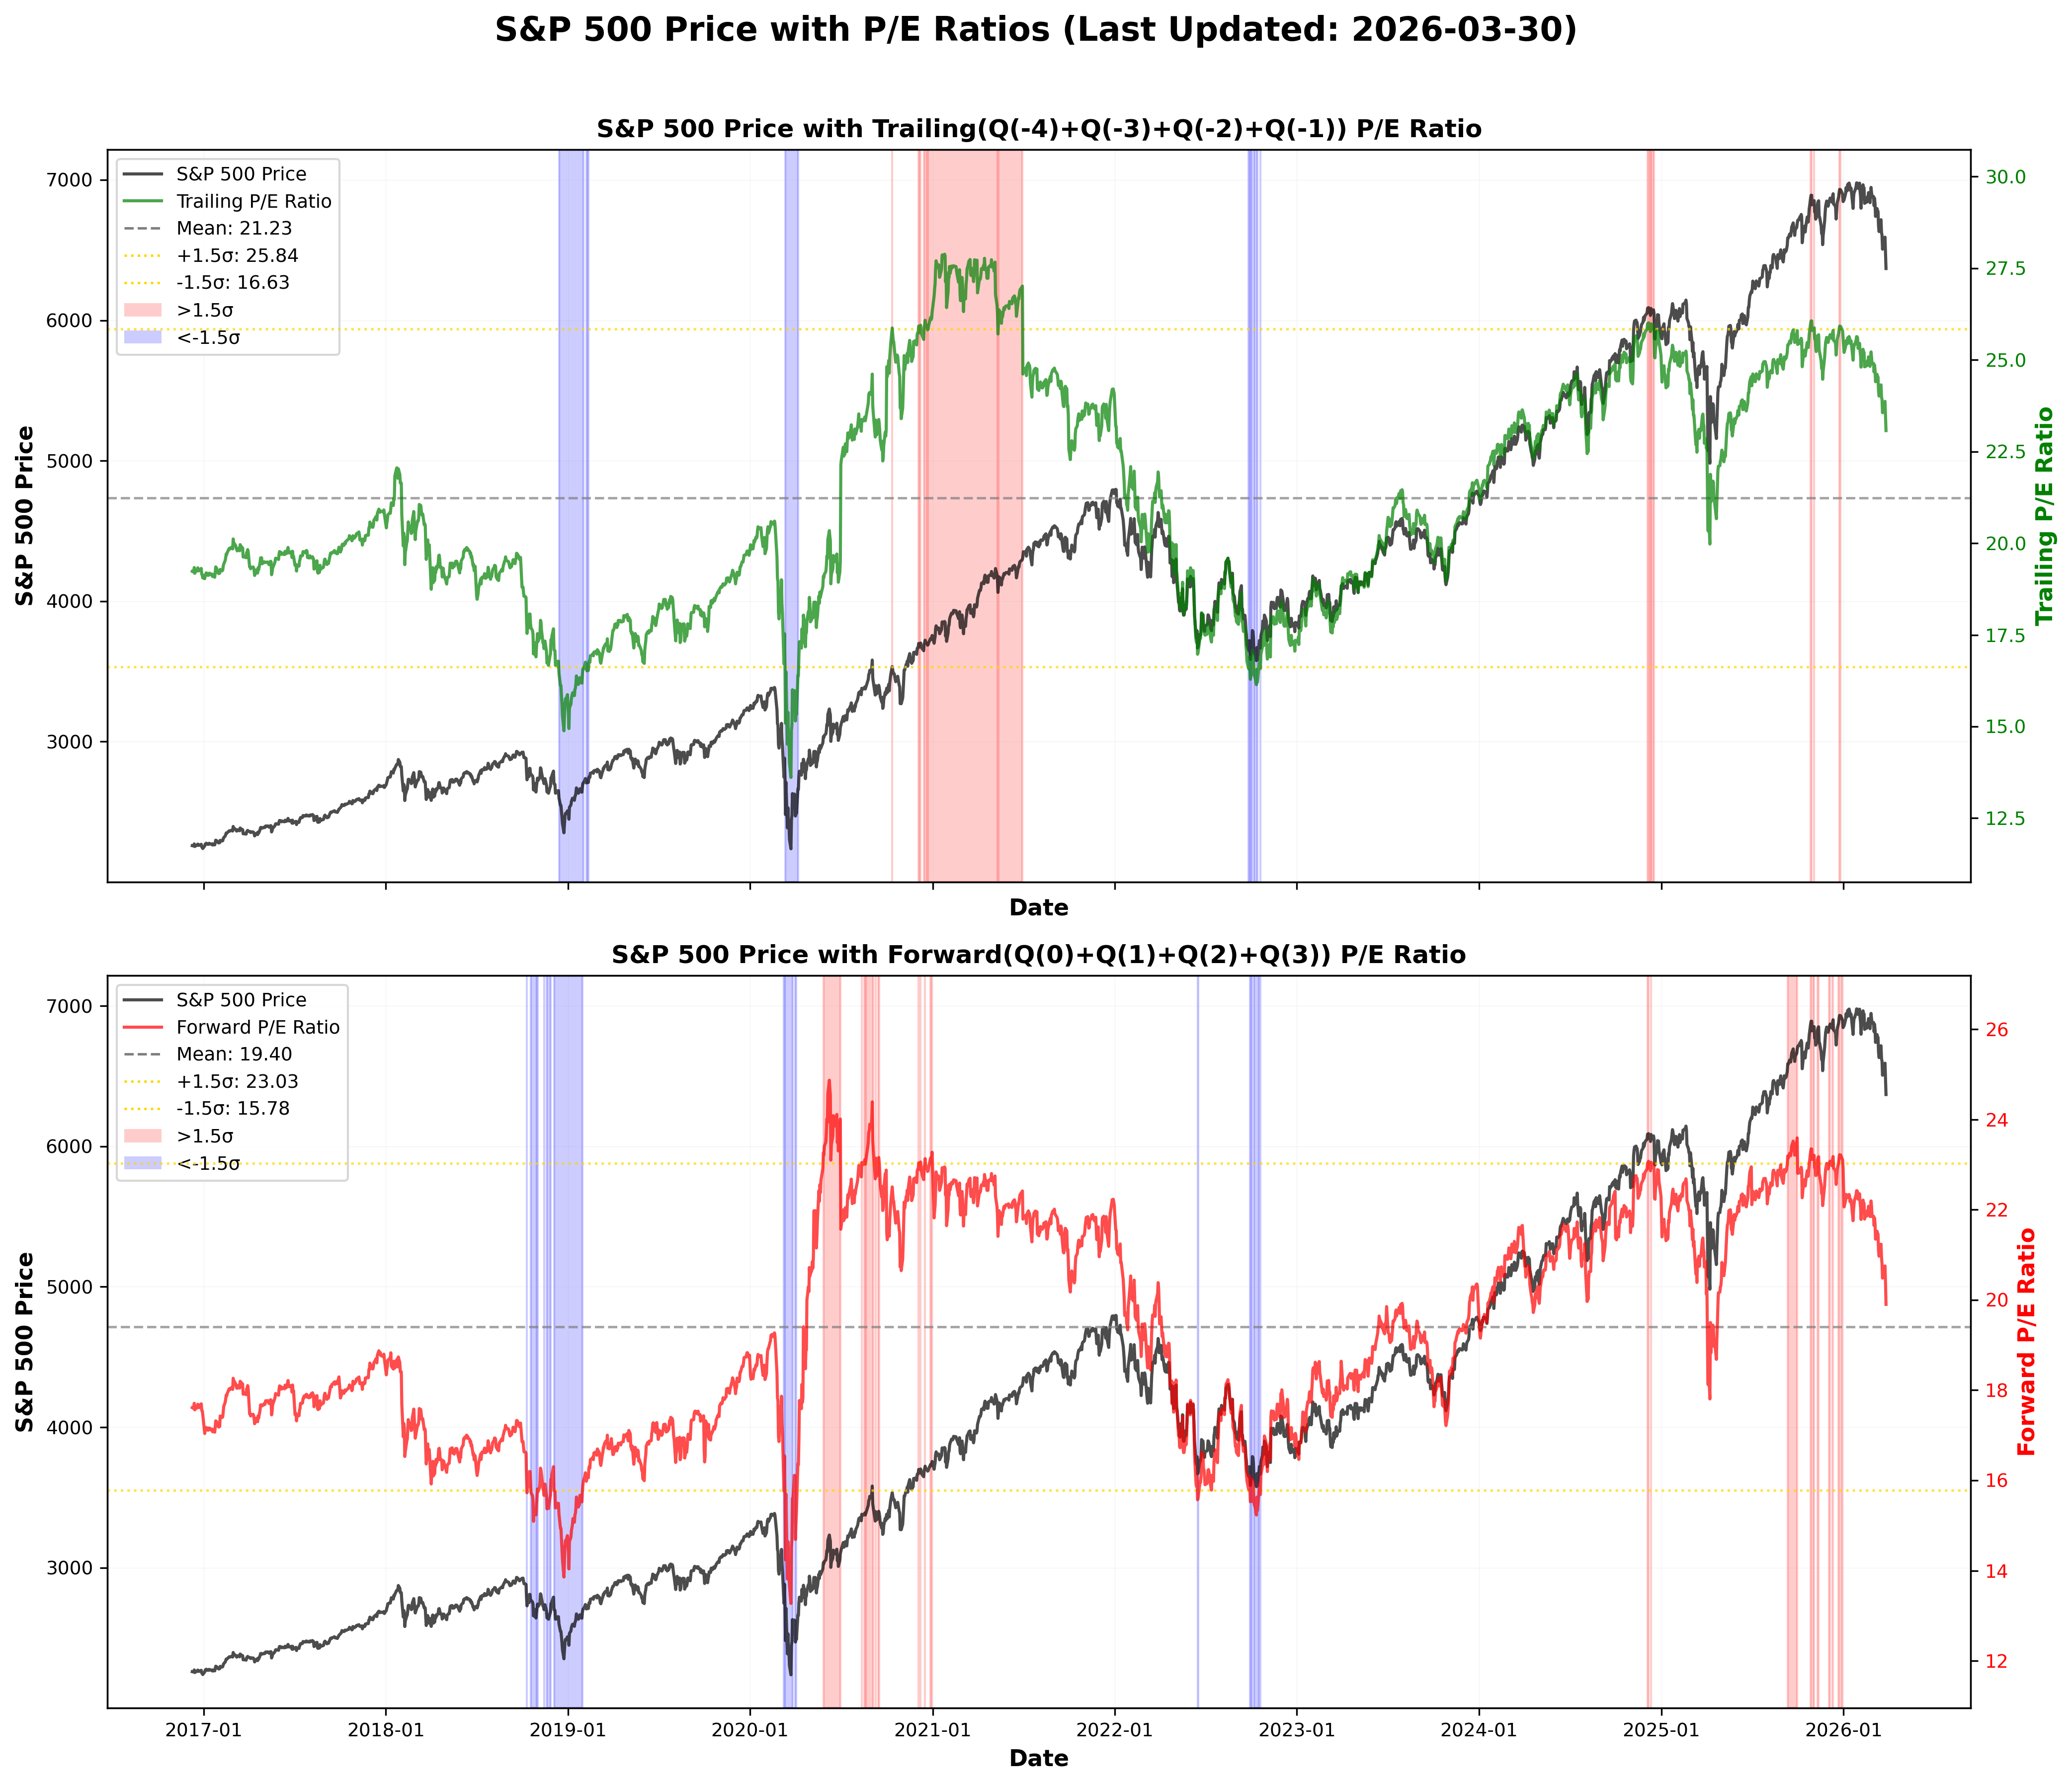
The following graph shows the current S&P 500 Price with Trailing and Forward P/E Ratios, highlighting periods outside ±1.5σ range.
Installation
Install from PyPI:
pip install factset-report-analyzer
Or with uv:
uv pip install factset-report-analyzer
Workflow Overview
The complete workflow from PDF documents to final P/E ratio calculation:
┌─────────────────────────────────────────────────────────────────────┐
│                    📄 Step 1: PDF Download                          │
│                                                                     │
│  FactSet Earnings Insight Reports                                   │
│  └─> Download PDFs from FactSet website                             │
│      (e.g., EarningsInsight_20251114_111425.pdf)                    │
└─────────────────────────────────────────────────────────────────────┘
                            │
                            ▼
┌─────────────────────────────────────────────────────────────────────┐
│              🖼️  Step 2: EPS Chart Page Extraction                  │
│                                                                     │
│  PDF Document                                                       │
│  └─> Extract EPS chart page (Page 21)                               │
│      └─> Convert to PNG image                                       │
│          (e.g., 20161209.png)                                       │
└─────────────────────────────────────────────────────────────────────┘
                            │
                            ▼
┌─────────────────────────────────────────────────────────────────────┐
│              🔍 Step 3: OCR Processing & Data Extraction            │
│                                                                     │
│  Chart Image                                                        │
│  ├─> Google Cloud Vision API (149 text regions detected)            │
│  ├─> Coordinate-based matching (Q1'14 ↔ 27.85)                      │
│  ├─> Bar classification (dark = actual, light = estimate)           │
│  └─> Extract quarter labels and EPS values                          │
│                                                                     │
│  Output: CSV with quarterly EPS estimates                           │
│  └─> extracted_estimates.csv                                        │
└─────────────────────────────────────────────────────────────────────┘
                            │
                            ▼
┌─────────────────────────────────────────────────────────────────────┐
│              📊 Step 4: P/E Ratio Calculation                       │
│                                                                     │
│  EPS Estimates + S&P 500 Prices                                     │
│  ├─> Load EPS data from public URL                                  │
│  ├─> Load S&P 500 prices from yfinance (2016-12-09 to today)        │
│  ├─> Calculate 4-quarter EPS sum (e.g. forward: Q(0)+Q(1)+Q(2)+Q(3))│
│  └─> Calculate P/E Ratio = Price / EPS_4Q_Sum                       │
│                                                                     │
│  Output: DataFrame with P/E ratios                                  │
└─────────────────────────────────────────────────────────────────────┘
Visual Workflow
Step 1: PDF Document → Downloads FactSet Earnings Insight PDF reports
Step 2: EPS Chart Page Extraction → Extracts chart page from PDF and converts to PNG image
Step 3: OCR Processing & Bar Classification → Extracts quarter labels and EPS values, classifies bars (dark = actual, light = estimate)
Step 4: P/E Ratio Calculation → See example output below
Usage
Python API
from factset_report_analyzer import SP500

# Initialize SP500 class (auto-loads CSV and S&P 500 prices)
sp500 = SP500()

# Get P/E ratio DataFrame (default: forward type)
pe_df = sp500.pe_ratio
print(pe_df)

# Switch to trailing type
sp500.set_type('trailing')
pe_trailing = sp500.pe_ratio
print(pe_trailing)

# Get current P/E ratio
current = sp500.current_pe
print(f"Current P/E: {current['pe_ratio']:.2f} on {current['date']}")
P/E Types:
forward: Q(0) + Q(1) + Q(2) + Q(3) - Report date quarter and next 3 quarterstrailing: Q(-4) + Q(-3) + Q(-2) + Q(-1) - Last 4 quarters before report date
Plotting Time Series
Generic time series plotting with optional sigma threshold highlighting:
from factset_report_analyzer import SP500
from factset_report_analyzer.utils.plot import plot_time_series
from pathlib import Path

# Get SP500 data
sp500 = SP500()
sp500.set_type('trailing')
pe_df = sp500.pe_ratio.sort_values('Date')

# Plot single series with sigma highlighting
plot_time_series(
    dates=pe_df['Date'],
    values=pe_df['PE_Ratio'],
    sigma=1.5,  # Highlight periods outside ±1.5σ
    labels=['Trailing P/E Ratio'],
    colors=['green'],
    output_path=Path("output/pe_ratio_plot.png")
)

# Plot dual axis (price and P/E ratio)
plot_time_series(
    dates=pe_df['Date'],
    values=[pe_df['Price'], pe_df['PE_Ratio']],
    sigma=1.5,
    sigma_index=1,  # Apply sigma to P/E ratio (second series)
    labels=['S&P 500 Price', 'Trailing P/E Ratio'],
    colors=['black', 'green'],
    output_path=Path("output/price_pe_plot.png")
)
Features:
- Single or dual-axis plotting (up to 2 series)
- Optional sigma threshold highlighting for outlier detection
- Automatic legend with mean and ±σ lines
- Customizable colors and labels
Plotting P/E Ratios
from factset_report_analyzer.utils.plot import plot_pe_ratio_with_price
from pathlib import Path

# Generate and save P/E ratio plot
plot_pe_ratio_with_price(
    output_path=Path("output/pe_ratio_plot.png"),
    std_threshold=1.5,  # Highlight periods outside ±1.5σ
    figsize=(14, 12)
)
The plot shows:
- Top panel: S&P 500 Price with Trailing P/E Ratio (Q(-4)+Q(-3)+Q(-2)+Q(-1))
- Bottom panel: S&P 500 Price with Forward P/E Ratio (Q(0)+Q(1)+Q(2)+Q(3))
- Highlighting: Periods where P/E ratios are outside ±1.5σ range
Example: P/E Ratio Calculation Result
from factset_report_analyzer import SP500

# Initialize and get trailing P/E ratios
sp500 = SP500()
sp500.set_type('trailing')
pe_df = sp500.pe_ratio
print(pe_df)
Output:
📊 Loading S&P 500 data...
  ✅ EPS data: 381 reports
  ✅ Price data: 2251 trading days
        Date        Price  EPS_4Q_Sum   PE_Ratio      Type
0 2016-12-09  2259.530029      117.49  19.231680  trailing
1 2016-12-12  2256.959961      117.49  19.209805  trailing
2 2016-12-13  2271.719971      117.49  19.335433  trailing
3 2016-12-14  2253.280029      117.49  19.178484  trailing
4 2016-12-15  2262.030029      117.49  19.252958  trailing
...          ...          ...         ...        ...       ...
2246  2025-11-17  6672.410156      267.21  24.970660  trailing
2247  2025-11-18  6617.319824      267.21  24.764492  trailing
2248  2025-11-19  6642.160156      267.21  24.857454  trailing
2249  2025-11-20  6650.740234      267.21  24.900000  trailing
2250  2025-11-21  6660.000000      267.21  24.950000  trailing

[2251 rows x 5 columns]
API Reference
SP500 Class
S&P 500 Market Data with EPS and P/E ratio calculations.
Initialization:
from factset_report_analyzer import SP500
sp500 = SP500()
Properties:
sp500.price: DataFrame with S&P 500 price data (Date, Price)sp500.eps: DataFrame with EPS data (Date, EPS) - depends on current typesp500.pe_ratio: DataFrame with P/E ratio data (Date, Price, EPS, PE_Ratio) - depends on current typesp500.current_pe: Dictionary with latest P/E ratio info ({'date': ..., 'pe_ratio': ...})
Methods:
sp500.set_type(type): Set P/E type to'forward'or'trailing'
P/E Types:
'forward': Q(0) + Q(1) + Q(2) + Q(3) - Report date quarter and next 3 quarters'trailing': Q(-4) + Q(-3) + Q(-2) + Q(-1) - Last 4 quarters before report date
Features:
- ✅ No API keys required
- ✅ Always loads latest data from public URL
- ✅ No local files needed
- ✅ Auto-loads S&P 500 prices from yfinance
- ✅ Caches data for efficient repeated access
Plotting Functions
For detailed API documentation, see function docstrings:
plot_time_series()- Generic time series plotting with sigma highlightingplot_pe_ratio_with_price()- S&P 500 P/E ratio visualization
# View help
from factset_report_analyzer.utils.plot import plot_time_series, plot_pe_ratio_with_price
help(plot_time_series)
help(plot_pe_ratio_with_price)
Legal Disclaimer
This package is provided for educational and research purposes only.
- This package processes publicly available PDF reports from FactSet's website
- The data extraction and processing methods are implemented for academic research
- This package is NOT affiliated with, endorsed by, or sponsored by FactSet
- For production use, please use FactSet's official API
No Warranty: This software is provided "as is" without warranty of any kind, express or implied, including but not limited to the warranties of merchantability, fitness for a particular purpose, and noninfringement.
Limitation of Liability: In no event shall the authors or copyright holders be liable for any claim, damages, or other liability arising from the use of this software.
Data Usage: Users are responsible for ensuring compliance with FactSet's terms of service and any applicable data usage agreements when using this package.
License
MIT License
Links
- GitHub: seung-gu/factset-report-analyzer
- PyPI: factset-report-analyzer
1 maintainer

Metadata
1 maintainer
Release files for factset-report-analyzer 0.4.3
For a detailed explanation of source distributions (sdists) and built distributions (wheels), please see the package formats documentation.
Source distribution (sdist)
| File | Size | Uploaded | |
|---|---|---|---|
| factset_report_analyzer-0.4.3.tar.gz | 7.5 MB | Details |
Built distribution (wheel)
| File | Interpreter | ABI | Platform | Reset |
|---|---|---|---|---|
| factset_report_analyzer-0.4.3-py3-none-any.whl | Python 3 | none | any | Details |
Total release size: 7.5 MB
Release files / factset_report_analyzer-0.4.3.tar.gz
| Download URL | factset_report_analyzer-0.4.3.tar.gz |
|---|---|
| Size | 7.5 MB |
| Tags | Source |
|
SHA-256 checksum How to use checksums |
8fd58de83549a77e200876961c1c0005bac2b1f0ee7278f23605f0b69e040ce2
|
|
BLAKE2b-256 checksum How to use checksums |
15f2245c464a9b86b82608de8866012fee37ee13b2d02ac8ccd380fe35f63096
|
| Upload date | |
|
Uploaded using Trusted Publishing? What is trusted publishing? |
No |
| Uploaded via |
twine/6.2.0 CPython/3.13.7
|
Release files / factset_report_analyzer-0.4.3-py3-none-any.whl
| Download URL | factset_report_analyzer-0.4.3-py3-none-any.whl |
|---|---|
| Size | 36.3 kB |
| Tags | Python 3 |
|
SHA-256 checksum How to use checksums |
d1c9195c655a725f324a41142040d32729f8a6222955f4736124c462921d72a5
|
|
BLAKE2b-256 checksum How to use checksums |
73e9f8eff0e5c4f7fb0d58513c7f5f26d2c8497a8cc3f84b32ff35536fd81570
|
| Upload date | |
|
Uploaded using Trusted Publishing? What is trusted publishing? |
No |
| Uploaded via |
twine/6.2.0 CPython/3.13.7
|














