Python toolkit for AB/ABC experiment analytics, duration planning, reporting and exports

Project description
fast_exp_analytics
Fast experiment analytics toolkit for A/B and A/B/C tests, MDE estimation, experiment duration planning, reporting, and chat-ready summaries
fast_exp_analytics is a Python library for analysts and product teams who need to quickly analyze online experiments, calculate experiment metrics, prepare readable summaries, export results to Excel, and estimate the required duration of future tests
The library is designed for practical analytics workflows in Jupyter Notebook: prepare data, describe metrics in a simple config, run A/B or A/B/C analysis, generate a styled table, export the result, and prepare a short message for stakeholders
Examples
Chat-ready experiment summaries
A/B test summary |
A/B/C test summary |
Included example notebook and reports
The repository contains a full example notebook and several generated report examples:
| File | Description |
|---|---|
examples/fast_exp_analytics_example.ipynb |
Full notebook with the main workflow: A/B analysis, A/B/C analysis, chat messages, Excel export, MDE and duration planning |
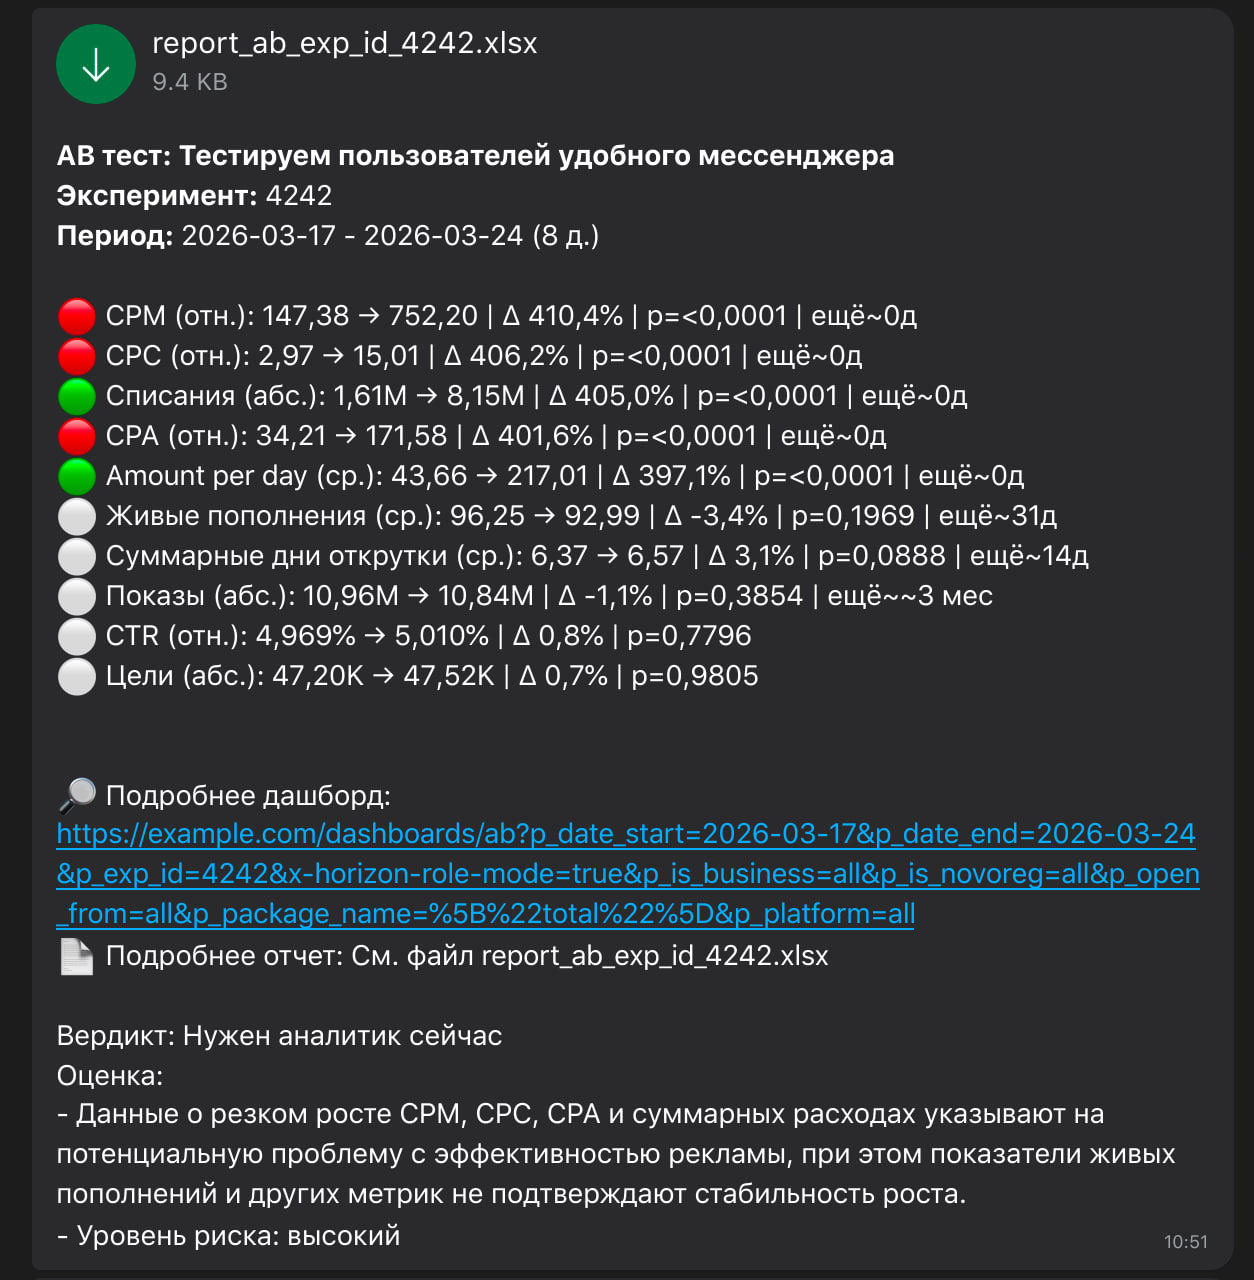
examples/report_ab_exp_id_4242.xlsx |
Example Excel report for an A/B test |
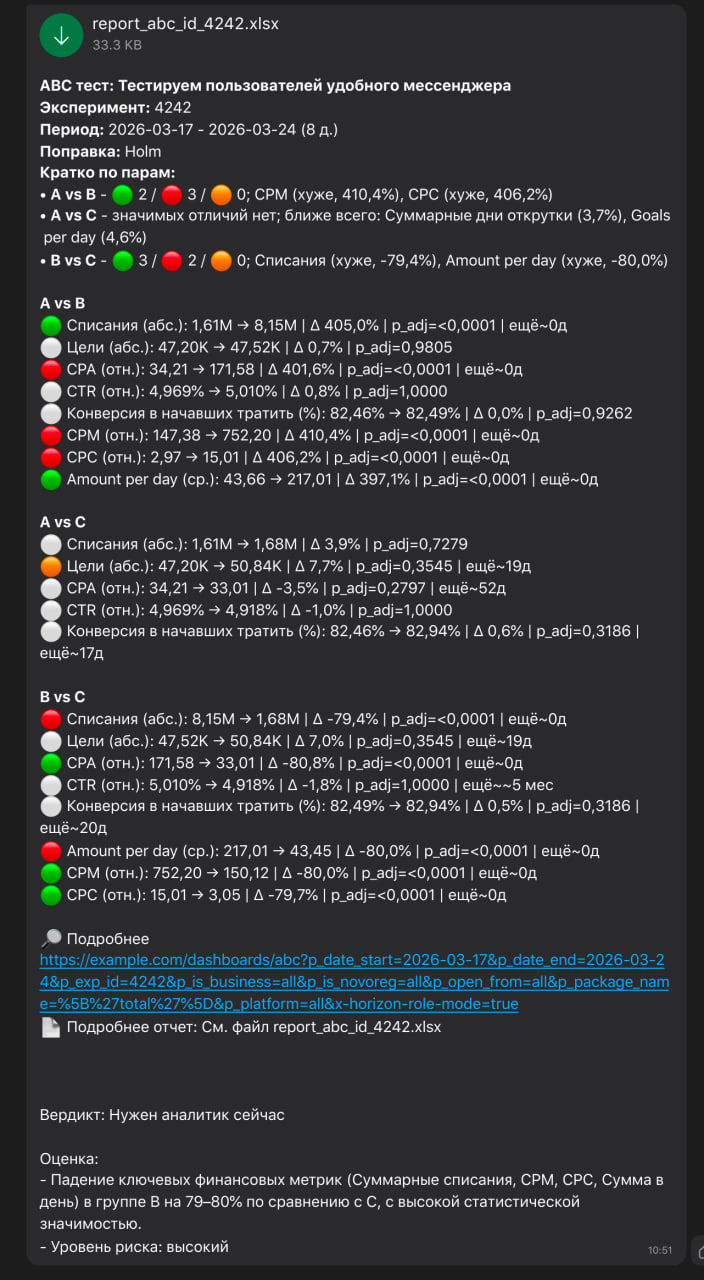
examples/report_abc_id_4242.xlsx |
Example Excel report for an A/B/C test |
examples/duration_plan_ab.xlsx |
Example duration planning report |
examples/duration_plan_ab_custom.xlsx |
Example custom duration planning report |
What the library does
fast_exp_analytics helps with three main tasks:
1. Experiment result analysis
- A/B test analysis
- A/B/C test analysis
- Comparison of control and test groups
- Calculation of absolute and relative metric changes
- Statistical significance checks
- Multiple-comparison correction for A/B/C tests
2. Experiment reporting
- Styled result tables for notebooks
- Short summaries for chats and task comments
- Excel export with experiment results
- Optional LLM-based review of experiment results
- Optional message sending with an attached report
3. Experiment planning
- MDE estimation for different experiment durations
- Required number of days for target MDE
- Planning for A/B and A/B/C experiments
- Support for different rollout shares
- Aggregation of historical data to experiment-unit level
Main use cases
Use fast_exp_analytics when you need to:
- quickly calculate A/B test results
- compare several experiment groups in an A/B/C test
- prepare a short experiment summary for a manager, product owner, or team chat
- export experiment results to Excel
- estimate whether the experiment has enough sensitivity
- calculate MDE for 7, 14, 21, 28 or more days
- estimate how many days are needed to detect a target effect
- reuse the same experiment analysis logic across notebooks and projects
Installation
From PyPI
pip install fast-exp-analytics
From GitHub
pip install git+https://github.com/your-username/fast_exp_analytics.git
For local development
git clone https://github.com/your-username/fast_exp_analytics.git
cd fast_exp_analytics

python -m venv venv
source venv/bin/activate

pip install -e ".[dev]"
Quick start
A full usage example is available in the notebook:
examples/fast_exp_analytics_example.ipynb
The notebook shows the main workflow:
- loading or generating experiment data
- configuring metrics
- running A/B analysis
- running A/B/C analysis
- styling result tables
- building dashboard URLs
- generating chat messages
- adding optional LLM review
- exporting reports to Excel
- planning experiment duration and MDE
Basic workflow
import pandas as pd

from fast_exp_analytics import (
    run_ab_test,
    style_table_ab,
    build_ab_chat_message,
    export_ab_results_to_excel,
)
1. Prepare experiment data
The input data should usually be aggregated at the experiment unit level
Example:
| user_id | exp_group | shows | clicks | amount | goals | is_create_ad |
|---|---|---|---|---|---|---|
| 1001 | A | 1200 | 54 | 320.5 | 7 | 1 |
| 1002 | B | 980 | 41 | 210.0 | 3 | 0 |
| 1003 | A | 1500 | 73 | 460.7 | 9 | 1 |
The library does not force a specific data source. Data can come from SQL, YQL, ClickHouse, CSV, Excel, pandas transformations, or any other pipeline
2. Describe metrics
Metrics are configured with a simple pandas.DataFrame
metrics_df = pd.DataFrame.from_dict(
    {
        "shows": ["Shows", "additive", "shows", "shows", "positive"],
        "clicks": ["Clicks", "additive", "clicks", "clicks", "positive"],
        "amount": ["Amount", "additive", "amount", "amount", "positive"],
        "ctr": ["CTR", "ratio", "clicks", "shows", "positive"],
        "cpc": ["CPC", "ratio", "amount", "clicks", "negative"],
        "cpa": ["CPA", "ratio", "amount", "goals", "negative"],
        "cr_created": [
            "Created campaign conversion",
            "share",
            "is_create_ad",
            "is_in_exp",
            "positive",
        ],
    },
    orient="index",
    columns=["desc", "type", "num", "den", "direction"],
)
Metric config columns:
| Column | Meaning |
|---|---|
desc |
Human-readable metric name |
type |
Metric type: additive, average, ratio, share |
num |
Numerator or value column |
den |
Denominator column |
direction |
Direction of improvement: positive or negative |
3. Run A/B test
df_result_ab = run_ab_test(
    df=df,
    metrics_df=metrics_df,
    exp_start_date="2026-03-17",
    exp_end_date="2026-03-24",
    group_base="A",
    group_exp="B",
    alpha=0.05,
    power=0.80,
)
4. Display result table
style_table_ab(
    df_result_ab,
    comment="Experiment description",
    exp_start_date="2026-03-17",
    exp_end_date="2026-03-24",
    experiment_id=4242,
)
5. Export result to Excel
excel_path = export_ab_results_to_excel(
    df_result_ab=df_result_ab,
    output_path="report_ab_exp_id_4242.xlsx",
    experiment_desc="Experiment description",
    exp_id=4242,
    date_from="2026-03-17",
    date_to="2026-03-24",
)
6. Build short message
msg = build_ab_chat_message(
    df_result=df_result_ab,
    experiment_desc="Experiment description",
    exp_id=4242,
    date_from="2026-03-17",
    date_to="2026-03-24",
    dashboard_url="https://example.com/dashboard",
    max_metrics=10,
    show_days_more=True,
)

print(msg)
Example output:
AB test: Experiment description
Experiment: 4242
Period: 2026-03-17 - 2026-03-24

🟢 Amount: 1.61M → 8.15M | Δ 405.0% | p=<0.0001
🔴 CPA: 34.21 → 171.58 | Δ 401.6% | p=<0.0001
⚪ CTR: 4.969% → 5.010% | Δ 0.8% | p=0.7796

Dashboard:
https://example.com/dashboard
A/B/C analysis
For A/B/C experiments, use run_abc_test.
from fast_exp_analytics import (
    run_abc_test,
    style_table_abc,
    build_abc_chat_message,
    export_abc_results_to_excel,
)

df_result_abc = run_abc_test(
    df=df,
    metrics_df=metrics_df,
    exp_start_date="2026-03-17",
    exp_end_date="2026-03-24",
    include_bc=True,
    alpha=0.05,
    power=0.80,
    pvalue_adjust_method="holm",
)
Prepare a styled table:
style_table_abc(
    df_result_abc,
    caption="Experiment description: 2026-03-17 — 2026-03-24",
)
Generate a short summary:
msg = build_abc_chat_message(
    df_result=df_result_abc,
    experiment_desc="Experiment description",
    exp_id=4242,
    date_from="2026-03-17",
    date_to="2026-03-24",
    dashboard_url="https://example.com/dashboard",
    alpha=0.05,
    p_adjust_method="Holm",
    use_adjusted=True,
)

print(msg)
Export the report:
excel_path = export_abc_results_to_excel(
    df_result_abc=df_result_abc,
    output_path="report_abc_id_4242.xlsx",
    experiment_desc="Experiment description",
    exp_id=4242,
    date_from="2026-03-17",
    date_to="2026-03-24",
)
Experiment duration planning
The library can also help estimate experiment duration and MDE using historical data.
from fast_exp_analytics import (
    build_experiment_level,
    default_duration_metrics_config,
    mde_table_for_experiment_duration,
    required_days_for_target_mde_table,
    export_duration_results_to_excel,
)
Aggregate historical data to experiment-unit level
agg_df = build_experiment_level(
    df_raw,
    unit_id_col="user_id",
    date_col="date",
    amount_col="amount",
    shows_col="shows",
    clicks_col="clicks",
    goals_col="main_goals",
    entity_id_col="campaign_id",
)
Calculate MDE for different durations
metrics_duration_df = default_duration_metrics_config()

mde_by_days = mde_table_for_experiment_duration(
    df_raw=df_raw,
    unit_id_col="user_id",
    rollout_pct=0.5,
    exp_days=[7, 14, 21, 28, 35],
    experiment_type="ab",
    metrics_config=metrics_duration_df,
    alpha=0.05,
    power=0.80,
    date_col="date",
    amount_col="amount",
    shows_col="shows",
    clicks_col="clicks",
    goals_col="main_goals",
    entity_id_col="campaign_id",
)
Estimate required days for target MDE
days_for_target_mde = required_days_for_target_mde_table(
    df_raw=df_raw,
    unit_id_col="user_id",
    rollout_pct=0.5,
    target_mde_pct=[5, 7, 10],
    experiment_type="ab",
    metrics_config=metrics_duration_df,
    alpha=0.05,
    power=0.80,
    date_col="date",
    amount_col="amount",
    shows_col="shows",
    clicks_col="clicks",
    goals_col="main_goals",
    entity_id_col="campaign_id",
)
Export planning result
excel_path = export_duration_results_to_excel(
    output_path="duration_plan_ab.xlsx",
    mde_by_days_df=mde_by_days,
    days_for_target_mde_df=days_for_target_mde,
    experiment_name="Experiment name",
    experiment_type="ab",
    rollout_pct=50,
    recommended_days=21,
    comment="The estimate is based on historical data at user_id level.",
)
Core functions
The main public functions are grouped by workflow
A/B tests
| Function | Purpose |
|---|---|
run_ab_test |
Runs A/B test analysis |
style_table_ab |
Builds a styled result table for notebooks |
build_ab_chat_message |
Generates a short text summary |
build_dashboard_url_ab |
Builds a dashboard URL with parameters |
export_ab_results_to_excel |
Exports A/B results to Excel |
A/B/C tests
| Function | Purpose |
|---|---|
run_abc_test |
Runs A/B/C or multi-group analysis |
style_table_abc |
Builds a styled result table for notebooks |
build_abc_chat_message |
Generates a short text summary |
build_dashboard_url_abc |
Builds a dashboard URL with parameters |
export_abc_results_to_excel |
Exports A/B/C results to Excel |
Duration planning
| Function | Purpose |
|---|---|
build_experiment_level |
Aggregates raw historical data to experiment-unit level |
units_per_day_from_raw |
Estimates available units per day from raw data |
default_duration_metrics_config |
Returns default metrics for duration planning |
mde_table_for_experiment_duration |
Calculates MDE for different experiment durations |
required_days_for_target_mde_table |
Estimates required days for target MDE |
duration_plan_summary |
Builds a full duration planning summary |
export_duration_results_to_excel |
Exports duration planning results to Excel |
Optional integrations
| Function / Config | Purpose |
|---|---|
OpenAICompatConfig |
Config for OpenAI-compatible LLM API |
build_llm_review |
Generates optional LLM review of experiment results |
ChatSendConfig |
Config for chat/message API |
send_chat_message |
Sends message and optional file to chat |
Supported metric types
| Type | Description | Examples |
|---|---|---|
additive |
Sum-based metrics. | revenue, amount, clicks, shows, goals |
average |
Average value per unit. | average amount per user, campaign days |
ratio |
Numerator divided by denominator. | CTR, CPC, CPA, CPM |
share |
Share/conversion metrics. | conversion to action, payer share |
Project structure
fast_exp_analytics/
├── fast_exp_analytics/
├── examples/
├── tests/
├── README.md
├── CHANGELOG.md
├── pyproject.toml
├── MANIFEST.in
└── Makefile
License
MIT © 2026 Alexey Voronko
Release history Release notifications | RSS feed


Download files
Download the file for your platform. If you're not sure which to choose, learn more about installing packages.
Source Distribution
File details
Details for the file fast_exp_analytics-0.1.4.tar.gz.
File metadata
- Download URL: fast_exp_analytics-0.1.4.tar.gz
- Upload date:
- Size: 76.4 kB
- Tags: Source
- Uploaded using Trusted Publishing? No
- Uploaded via: twine/6.2.0 CPython/3.11.0
File hashes
| Algorithm | Hash digest | |
|---|---|---|
| SHA256 |
3a6ba73bebd9c99d5cf2aa6d6fe26f5fac5ba398331e7c7182bc52db41d15956
|
|
| MD5 |
f6369c5a494f4c51fc8ad64a94a6f362
|
|
| BLAKE2b-256 |
7282db0680f96a4926830b49262f9ba7c7067125d4029e28fed9d3c942474a5c
|


