
fastapi-observer




One-call observability for FastAPI. JSON logs with request IDs, Prometheus metrics and OpenTelemetry traces, with sensitive data redacted by default. No vendor backend: send it to whatever you already run.
from fastapi import FastAPI
from fastapiobserver import install_observability

app = FastAPI()
install_observability(app)
Every request now writes one JSON line, with the same trace_id as its trace when tracing is on:
{
  "timestamp": "2026-10-31T09:10:20.345831+00:00",
  "level": "INFO",
  "logger": "fastapiobserver.middleware",
  "message": "request.completed",
  "app_name": "orders-api",
  "service": "orders",
  "environment": "production",
  "version": "2.3.1",
  "request_id": "d496f541-5e5e-4f14-9174-e9bd697faa62",
  "trace_id": "11d5b6f088bfdba501927e55463be4cd",
  "span_id": "50a12c2d9937eacb",
  "event": {
    "method": "GET",
    "path": "/orders/42",
    "status_code": 200,
    "duration_ms": 1.314,
    "client_ip": "203.0.113.7",
    "error_type": "ok"
  }
}
Documentation: vitaee.github.io/FastapiObserver
Install
pip install fastapi-observer                 # JSON logs, request IDs, redaction
pip install "fastapi-observer[prometheus]"   # + Prometheus /metrics
pip install "fastapi-observer[otel]"         # + OpenTelemetry traces and OTLP logs
pip install "fastapi-observer[all]"          # everything
Requires Python 3.11 or newer.
Configure with environment variables
install_observability(app) reads its settings from the environment. These are the ones most apps set:
| Variable | Example | What it does |
|---|---|---|
APP_NAME, SERVICE_NAME, ENVIRONMENT, APP_VERSION |
orders-api, orders, production, 2.3.1 |
Added to every log line |
METRICS_ENABLED |
true |
Serves Prometheus metrics at /metrics (needs [prometheus]) |
OTEL_ENABLED, OTEL_EXPORTER_OTLP_ENDPOINT |
true, http://collector:4317 |
Sends traces over OTLP and adds trace_id to logs (needs [otel]) |
OBS_REDACTION_PRESET |
strict, pci, gdpr |
Chooses which fields and headers are masked |
OBS_PROFILE |
development, production |
Sensible defaults: production sets INFO logs, a larger log queue and the strict preset |
Explicit variables and Python arguments always win over profile defaults. Every setting is listed in the configuration guide.
What you get
- One JSON line per request with method, path, status, duration and client IP, and your service's name, environment and version on every line, including your own
loggingcalls. - Request IDs taken from
X-Request-IDwhen the caller is a trusted proxy, generated otherwise, returned in the response and passed on to the services you call, so one ID finds a request's logs in every service. - Redaction on by default. Passwords, tokens, API keys,
Authorizationand cookies are masked before anything is written. Presets cover stricter needs (strict,pci,gdpr). - Prometheus metrics labelled by route template (
/orders/{order_id}), and 404s for paths no route matches share one<unmatched>label, so neither IDs nor scanners explode cardinality. - OpenTelemetry traces, from FastAPI's own support on 0.142 and later, with
trace_idandspan_idin every log line, and optional log export over OTLP, redacted like everything else. - Non-blocking log writes. Lines are written from a background thread, so a slow stdout never stalls the event loop.
- Help finding what slows a request down. Opt-in: a warning with the stack of any sync call that blocks the event loop, and
DEBUGlines written only for requests that fail. Always on: a warning when the thread pool or a database connection pool is full, the usual cause when latency climbs while CPU stays low. With tracing on, each request line counts its queries and outbound HTTP calls, and a query run once per item (N+1) gets a warning. With metrics on,/metricsshows how many bytes of logs each route writes, andLOG_SAMPLE_RATEkeeps a share of successful requests, chosen by trace ID, while failed and slow requests are always written in full.
Optional extras: runtime log-level control, a tamper-evident audit log, SQLAlchemy, httpx and requests tracing, Strawberry GraphQL and a Loguru bridge. See the documentation.
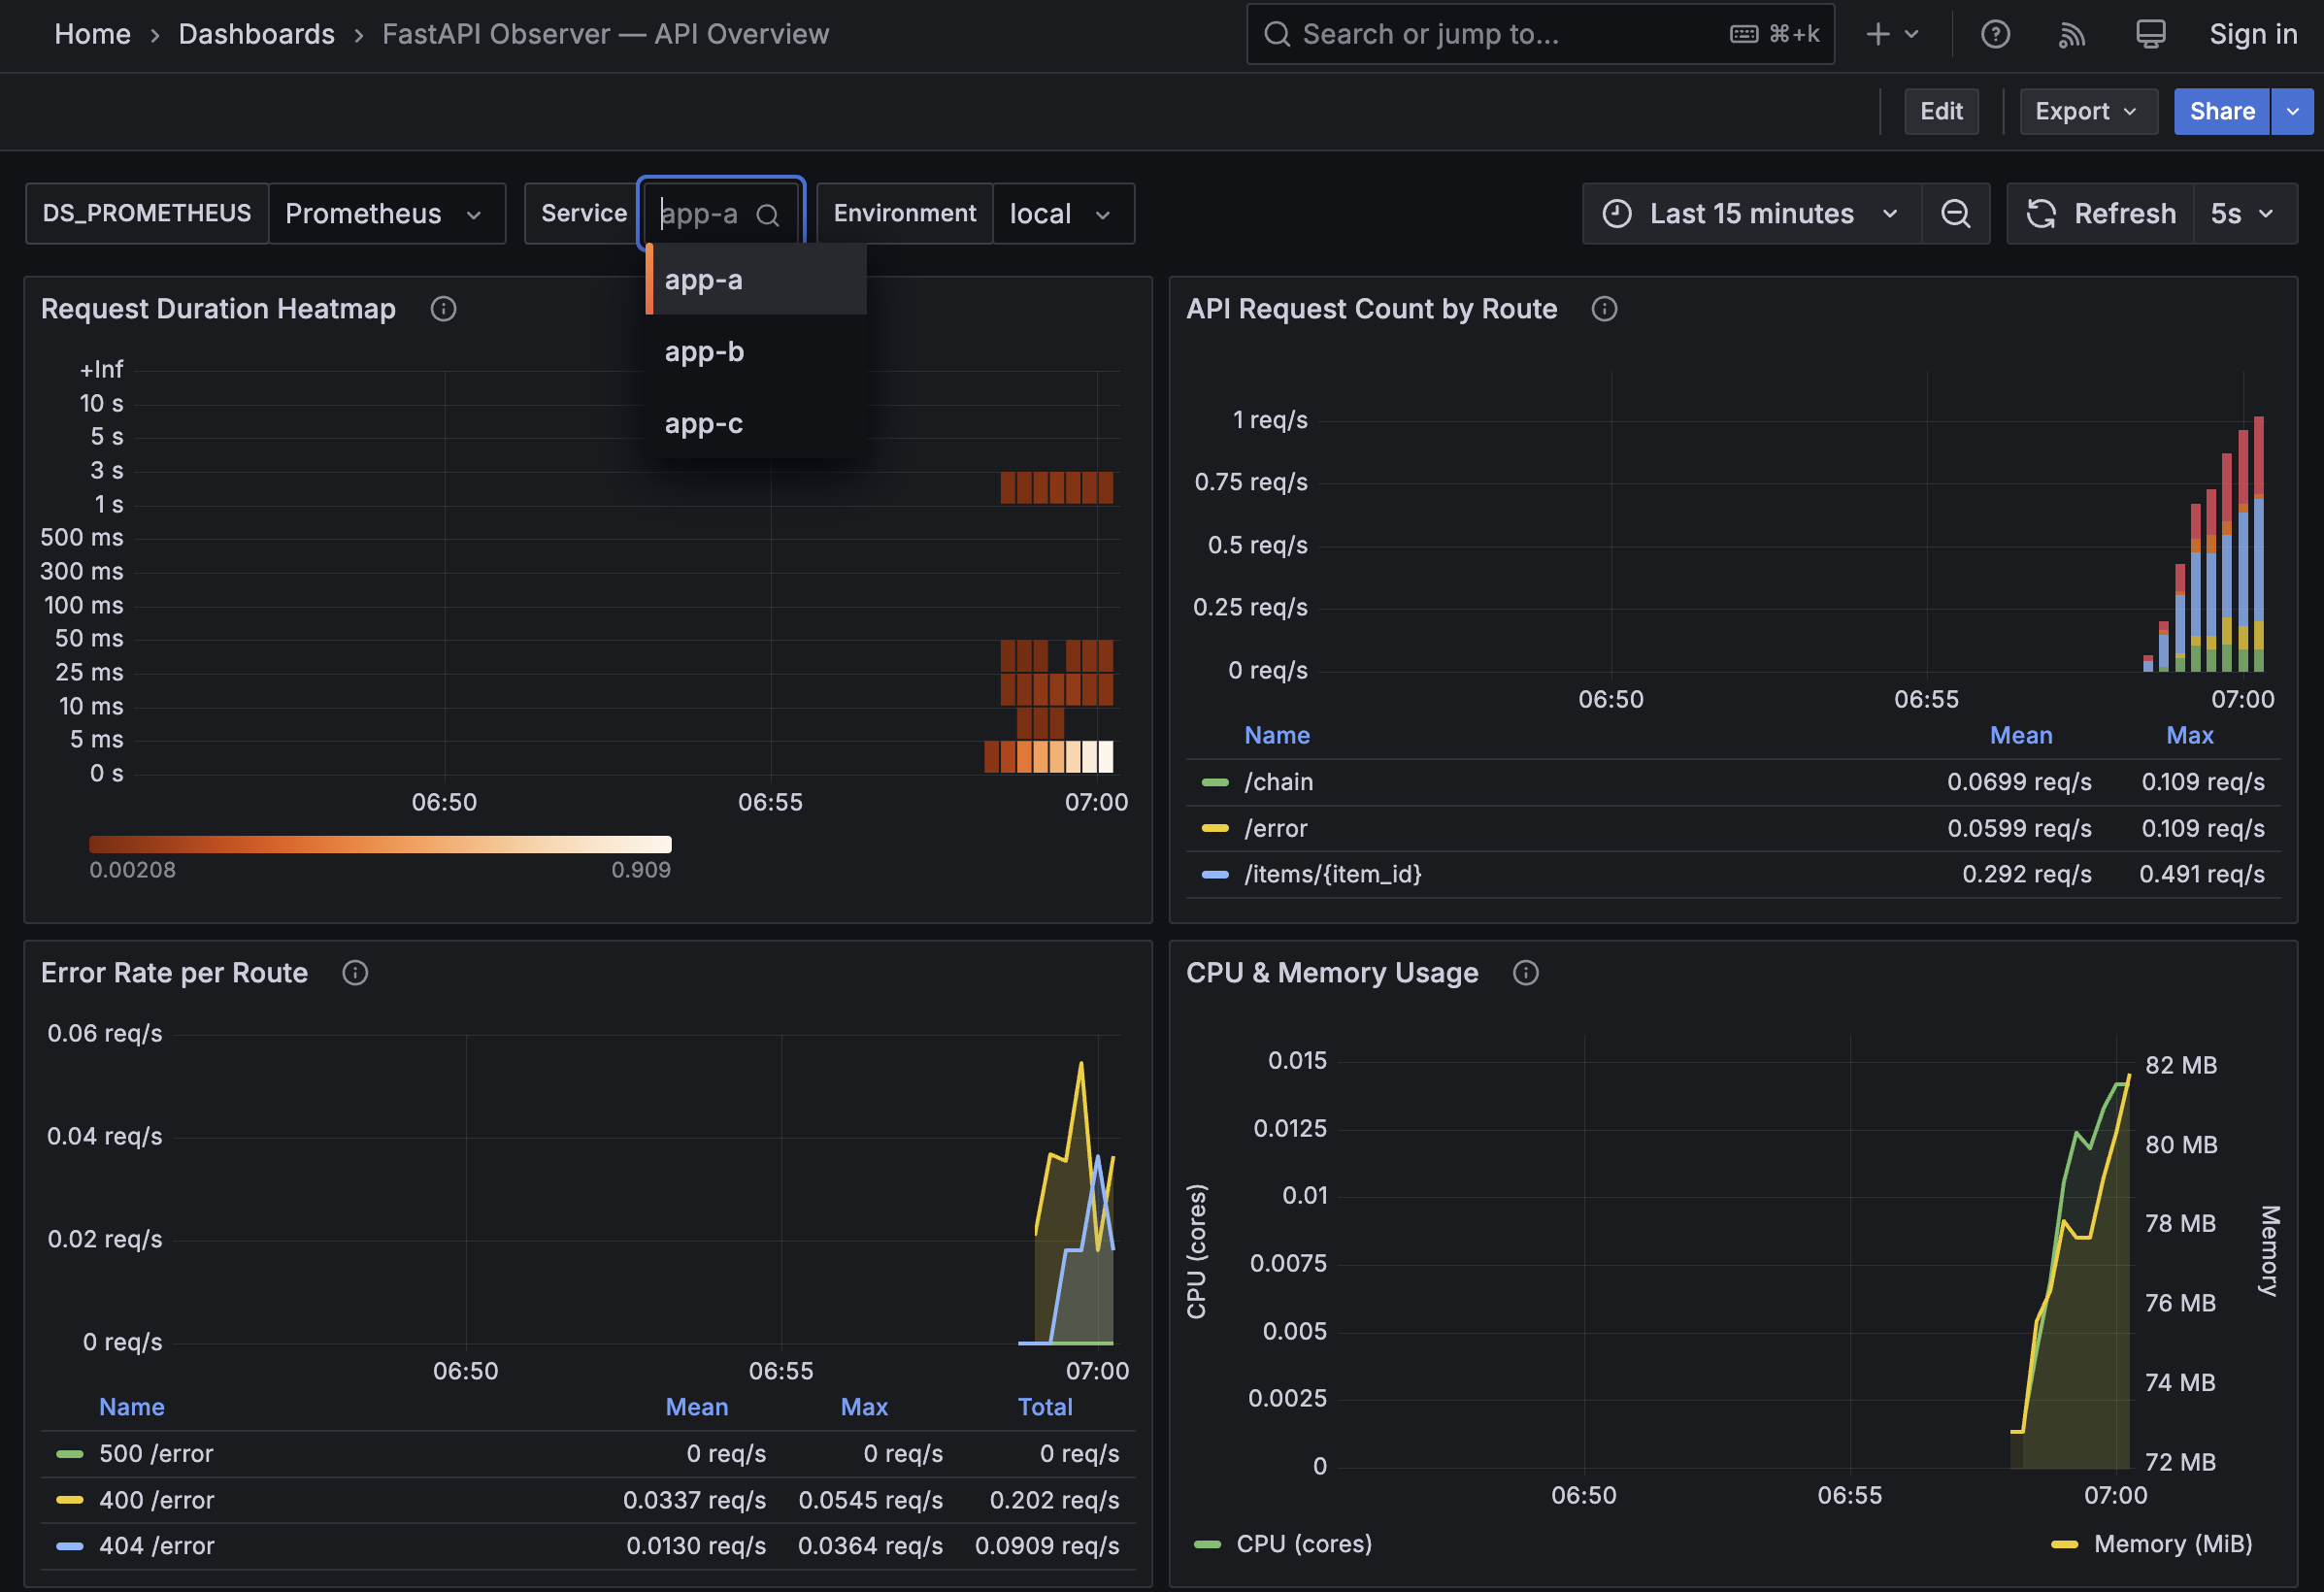
The Grafana dashboard from examples/full_stack, a Docker Compose stack you can run locally.
How it compares
| fastapi-observer | FastAPI 0.142+ built in | structlog or loguru | OpenTelemetry auto-instrumentation | Logfire | |
|---|---|---|---|---|---|
| JSON log line per request | Built in | No, only errors as OTLP log records | You write the middleware | No | A span per request |
| Request ID on every log line | Built in | No | You wire it up | No | Trace IDs |
| Redaction by default | Yes, with presets | Signed-URL query parameters only | You write a processor | No | Yes |
Prometheus /metrics |
Built in | Through an exporter | No | Through an exporter | No |
| Traces | FastAPI's own on 0.142+, OpenTelemetry's instrumentation before | Yes, with spans for dependencies, the endpoint and serialization | No | Yes | Yes |
| Where data goes | stdout, Prometheus and any OTLP backend | Any OTLP backend | stdout or files | Any OTLP backend | Logfire's platform |
Since 0.142, FastAPI traces requests on its own once an OpenTelemetry provider is set up. fastapi-observer uses that for traces and adds the rest of the first column.
When not to use it:
- You only want logs and need the lowest possible overhead: structlog alone does less work per line.
- You already send everything to Logfire, Datadog or Sentry: their own FastAPI integrations fit better.
- Your app isn't built on FastAPI or Starlette.
What it costs: with default settings, about 43 µs of CPU per request on an Apple M1. See the benchmarks, including a comparison with wiring the same stack by hand.
Works with
- Servers: uvicorn, gunicorn with
UvicornWorker, and Granian. Uvicorn's duplicate access line is dropped automatically. To get the servers' own startup lines as JSON too, see running with gunicorn and Granian. - Backends: Prometheus, Grafana (Loki, Tempo), Jaeger and anything that accepts OTLP. See backends.
- Error tracking: runs alongside Sentry. See the Sentry notes.
Why you can trust it
- Tested in CI on Python 3.11 to 3.15, type-checked with
mypy --strict, tested nightly against the newest OpenTelemetry releases, and used in production by its maintainer. - Releases are published with PyPI Trusted Publishing and signed attestations. CI runs
pip-auditand generates an SBOM. - Security fixes are called out in the changelog. To report a vulnerability, see SECURITY.md.
- Benchmarks are reproducible from
examples/benchmarks.
Compatibility
| Component | Supported |
|---|---|
| Python | >=3.11 (CI: 3.11 to 3.15) |
| FastAPI | >=0.133.0 |
| Starlette | >=1.3.1 |
| Prometheus extra | prometheus-client>=0.24.1 |
| OpenTelemetry extra | opentelemetry-api/sdk/exporter>=1.45.1 |
Documentation
- Configuration and structured logging
- Security and redaction presets
- OpenTelemetry
- Production deployment and Kubernetes
- Benchmarks and performance tuning
- Contributing
Support the project
If this library saves you time, you can buy me a coffee.
1 maintainer

Metadata
1 maintainer
Release files for fastapi-observer 1.14.0
For a detailed explanation of source distributions (sdists) and built distributions (wheels), please see the package formats documentation.
Source distribution (sdist)
| File | Size | Uploaded | Provenance | Actions |
|---|---|---|---|---|
| fastapi_observer-1.14.0.tar.gz | 115.6 kB | With provenance | Details for fastapi_observer-1.14.0.tar.gz |
Built distribution (wheel)
| File | Interpreter | ABI | Platform | Actions Reset |
|---|---|---|---|---|
| fastapi_observer-1.14.0-py3-none-any.whl | Python 3 | none | any | Details for fastapi_observer-1.14.0-py3-none-any.whl |
Total release size: 212.2 kB
Release files / fastapi_observer-1.14.0.tar.gz
| Download URL | fastapi_observer-1.14.0.tar.gz |
|---|---|
| Size | 115.6 kB |
| Tags | Source |
|
SHA-256 checksum How to use checksums |
eee7fc8beb741b98069d64d872bc605c48f27abc99e90a509f8ddcc2466215e4
|
|
BLAKE2b-256 checksum How to use checksums |
bf4e4345c39f3040681b7b1123723d8af592b260bfba1c89948254eb05248bef
|
| Upload date | |
|
Uploaded using Trusted Publishing? What is trusted publishing? |
Yes |
| Uploaded via |
twine/7.0.0 CPython/3.13.16
|
Provenance
Provenance describes where a file came from. On PyPI, provenance is shared via attestations, which provide a verifiable record of the build or publishing details. View details, limitations and caveats.


PyPI Publish Attestation
PyPI verified that this artifact, at this checksum, originated from the publisher listed below.
Signed by GitHub Actions, verified by PyPI on Oct 31, 2026.
Transparency logRelease files / fastapi_observer-1.14.0-py3-none-any.whl
| Download URL | fastapi_observer-1.14.0-py3-none-any.whl |
|---|---|
| Size | 96.5 kB |
| Tags | Python 3 |
|
SHA-256 checksum How to use checksums |
752a9af6671e54d55f58d1bbad7cc3e2fa953fe4ded2b5ac2a82f51d70f2d8e8
|
|
BLAKE2b-256 checksum How to use checksums |
15b389c0656acd88afe2b240717c9c089b76101c9f848a5d4c1b0742b86dbf69
|
| Upload date | |
|
Uploaded using Trusted Publishing? What is trusted publishing? |
Yes |
| Uploaded via |
twine/7.0.0 CPython/3.13.16
|
Provenance
Provenance describes where a file came from. On PyPI, provenance is shared via attestations, which provide a verifiable record of the build or publishing details. View details, limitations and caveats.
PyPI Publish Attestation
PyPI verified that this artifact, at this checksum, originated from the publisher listed below.
Signed by GitHub Actions, verified by PyPI on Oct 31, 2026.
Transparency logSecurity for fastapi-observer 1.14.0
Provenance
Provenance describes where a file came from. On PyPI, provenance is shared via attestations, which provide a verifiable record of the build or publishing details. View details, limitations and caveats.
Full provenance
Both files in this release have been uploaded with provenance metadata.
Attestation for fastapi_observer-1.14.0.tar.gz
PyPI Publish Attestation
PyPI verified that this artifact, at this checksum, originated from the publisher listed below.
Signed by GitHub Actions, verified by PyPI on Oct 31, 2026.
Transparency logA note on package security
PyPI is a repository for distributing packages, not a service for auditing them. While third-party security researchers and our staff do their best to detect and remove malicious packages, PyPI cannot guarantee the quality, security or suitability of any given package.
To learn more about protecting yourself from malicious actors, visit our package security documentation.














