
figkit




Design figures with Python code. Boxes, arrows, LaTeX, images and data — laid out precisely, styled by a cascading theme, exported to SVG, PNG, PDF or HTML.
figkit is for the kind of figure you'd otherwise assemble by hand in Figma or
draw.io: ML paper pipelines, architecture diagrams, research blog explainers.
Except it's code, so it's diffable, reproducible, parameterisable — and an LLM
can write it for you (see AI_MANUAL.md).
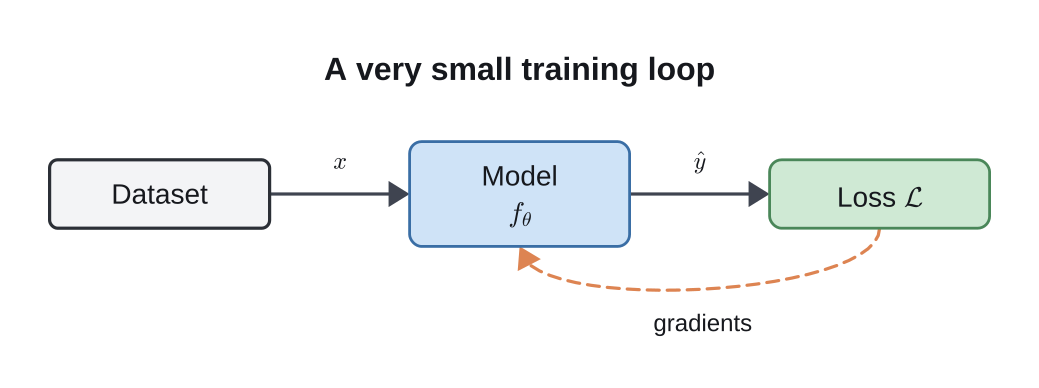
from figkit import *

with Figure(pad=24) as fig:
    a = Box("Encoder", style="block", w=120)
    b = Box("Decoder", style="blue").right_of(a, gap=60)
    arrow(a.e, b.w, label="$z$")

fig.save("figure.svg")
fig.save("figure.png", scale=2)
Check your work without looking at it. fig.audit() reports the mistakes
that are obvious in a picture and invisible in the code — and stays quiet about
deliberate overlap, so a clean report means something:
>>> print(fig.audit())
figkit audit: 2 issues (1 overlap, 1 contrast) in 34 elements
  overlap    Box('Decoder') covers Text('$z$') (240px², 61% of it)  at (196, 41)
  contrast   Box('Encoder'): text #dbeafe on #f3f4f6 has contrast 1.1:1 (want 3.0:1)  at (60, 17)
Install
pip install figkit              # core: layout, shapes, arrows, SVG/HTML export
pip install "figkit[latex]"     # + inline $math$ (matplotlib)
pip install "figkit[export]"    # + PNG/PDF export (cairosvg)
pip install "figkit[all]"       # everything
Only fonttools is required — it's what makes text measurement (and therefore
layout) accurate. The extras degrade rather than break: without matplotlib
an inline $formula$ is set as plain text with a warning, and without a
rasteriser save("f.png") raises while SVG and HTML keep working. PNG/PDF
export also accepts rsvg-convert, resvg, inkscape or headless Chromium
if you'd rather not install cairo.
What it does
Accurate measurement. figkit reads the actual font file and measures glyph
advances, so Box("Feature Extractor") is exactly as wide as its text plus its
padding — and everything you place relative to it lands where you expect.
Live anchors. box.e is a reference, not a coordinate. Move the box and
every arrow attached to it follows.
b = Box("model").right_of(a, gap=40)
link = arrow(a.e, b.w)
b.move(0, 120)          # the arrow follows
Explicit placement, not auto-layout. You say where things go; figkit does the arithmetic.
fm = Box("$F_M$").right_of(extractor, gap=24, align="top")
fn = Box("$F_N$").right_of(extractor, gap=24, align="bottom")
solver = Box("FMap Solver", style="blue").right_of(fm, gap=40)

elbow(fm.e, solver.w, stub=12)              # -| routing
mid = between(fm, fn)                        # vertically between two boxes
frame = fit(solver, cmn, pad=20, label="Fused operation", dash=True)
Cascading themes. Base tokens, per-role overrides, CSS-style classes and a colour palette — set once, applied everywhere.
T = PAPER.derive(
    font_size=13, radius=4,
    palette={"brand": "#3B6EA5"},
    box=Style(fill="#ffffff", stroke="#222222", padding=(9, 13)),
    styles={"solver": Style(fill="@brand", stroke="#1b1b1b")},
)
with Figure(theme=T) as fig:
    Box("FMap Solver", classes="solver")     # or style="solver block"
Classes resolve lazily against whichever theme is in scope, so the same class can mean different things inside a differently themed group.
LaTeX anywhere. Any $...$ span in any string is typeset and emitted as
vector outlines, so exported files don't depend on installed fonts.
Box("$C_{\\mathcal{MN}} = \\phi^{\\dagger}_{\\mathcal{N}}\\Pi_{\\mathcal{NM}}\\phi_{\\mathcal{M}}$")
Data is just Python. A Frame maps data coordinates to figure
coordinates; every mark it draws is an ordinary element you can anchor to.
fr = Frame(w=430, h=240, xlim=(0, 50), ylim=(0.35, 1.0))
fr.axes(xlabel="epoch", ylabel="accuracy", grid=True)
fr.line(xs, ys, stroke="@primary", lw=2)
arrow(note.se, fr.pt(50, 0.94))       # point at a data coordinate
Gallery
Each figure below is produced by the script of the same name in
examples/. The
first two are figkit reproductions of published figures, linked as reference —
they are not affiliated with or endorsed by their authors.
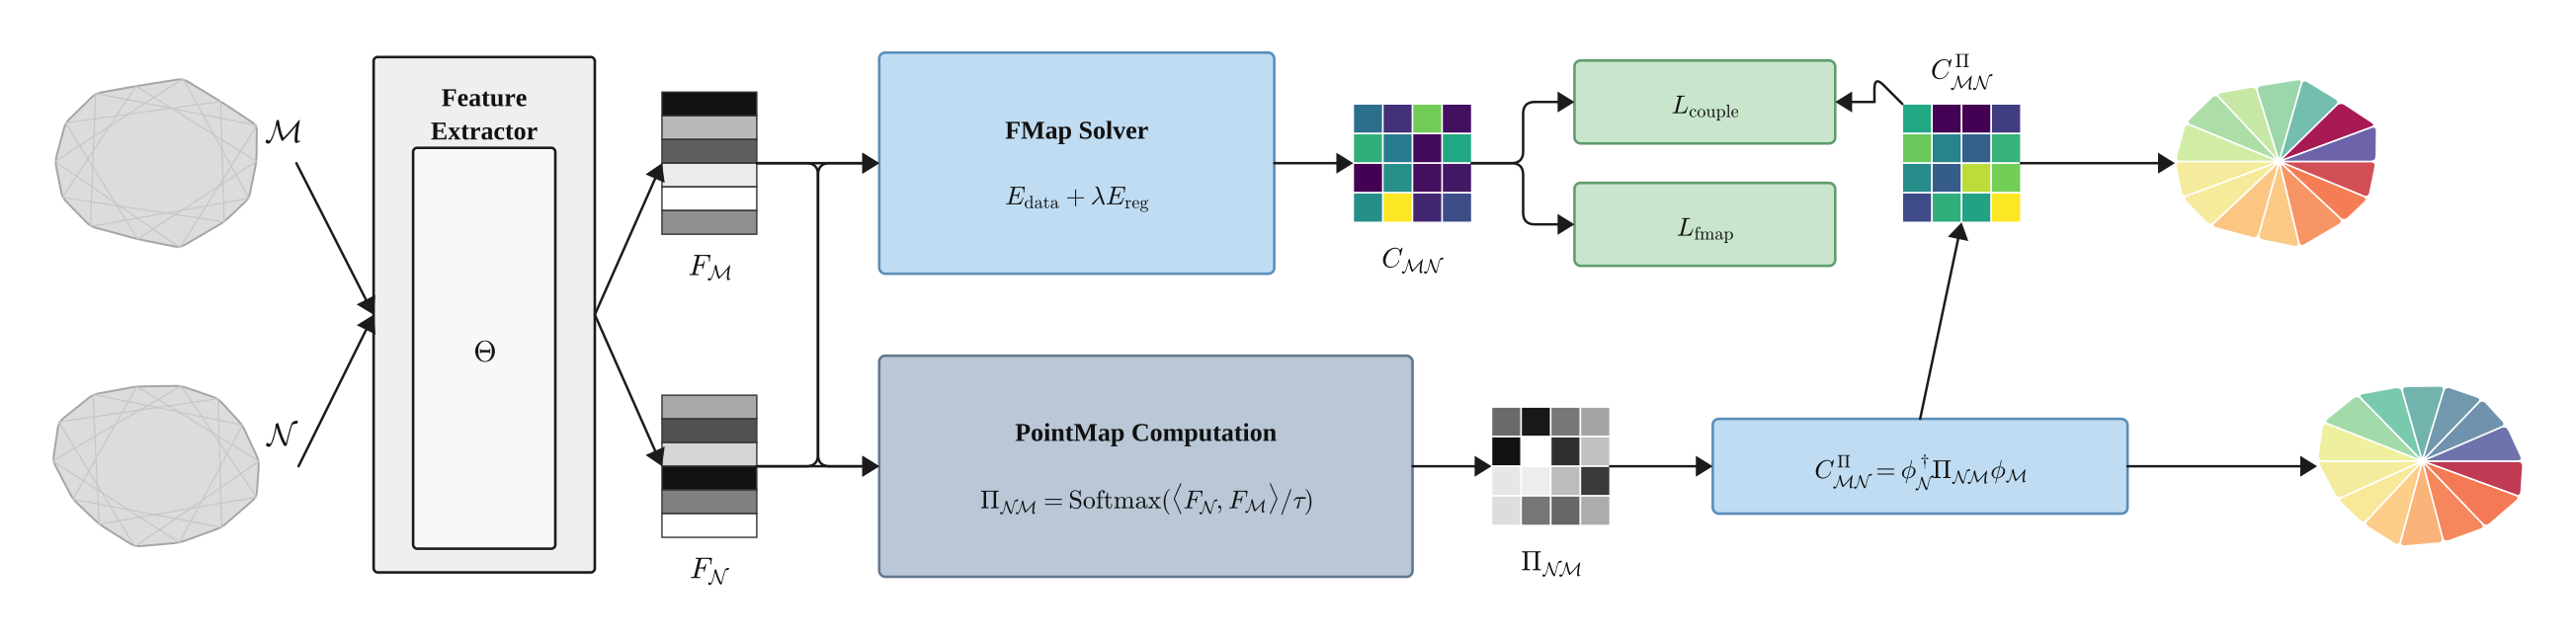
01_pipeline.py — an ML paper pipeline
Themes, relative placement, live anchors, inline LaTeX, colour matrices, elbow routing and hand-built vector graphics. After the pipeline figure in URSSM.
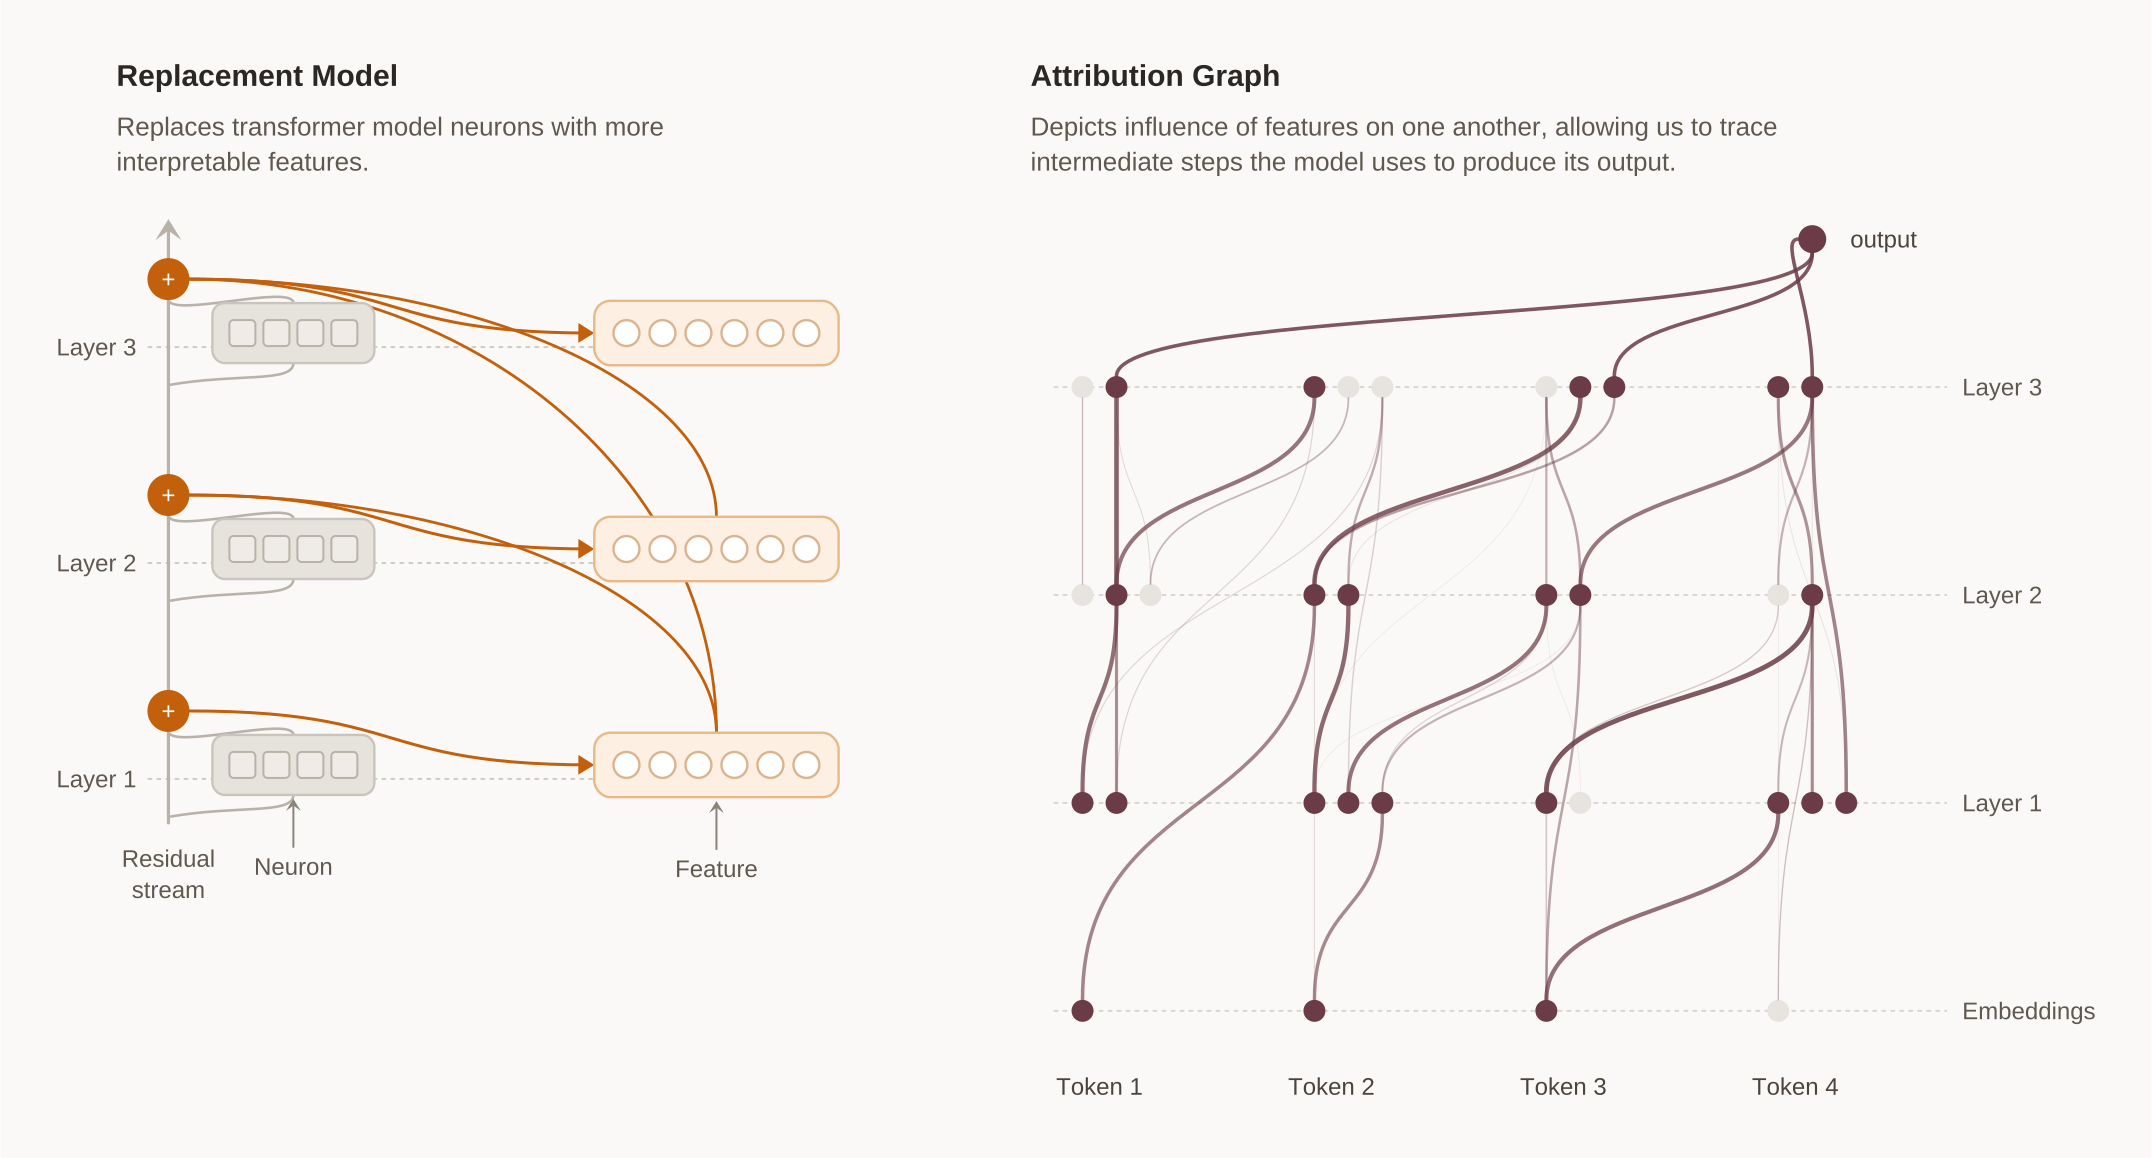
02_attribution.py — a two-panel blog explainer
Programmatic node grids and hundreds of curved edges whose width and opacity come straight from the data. After the replacement-model and attribution-graph diagram in Anthropic's Circuit Tracing.
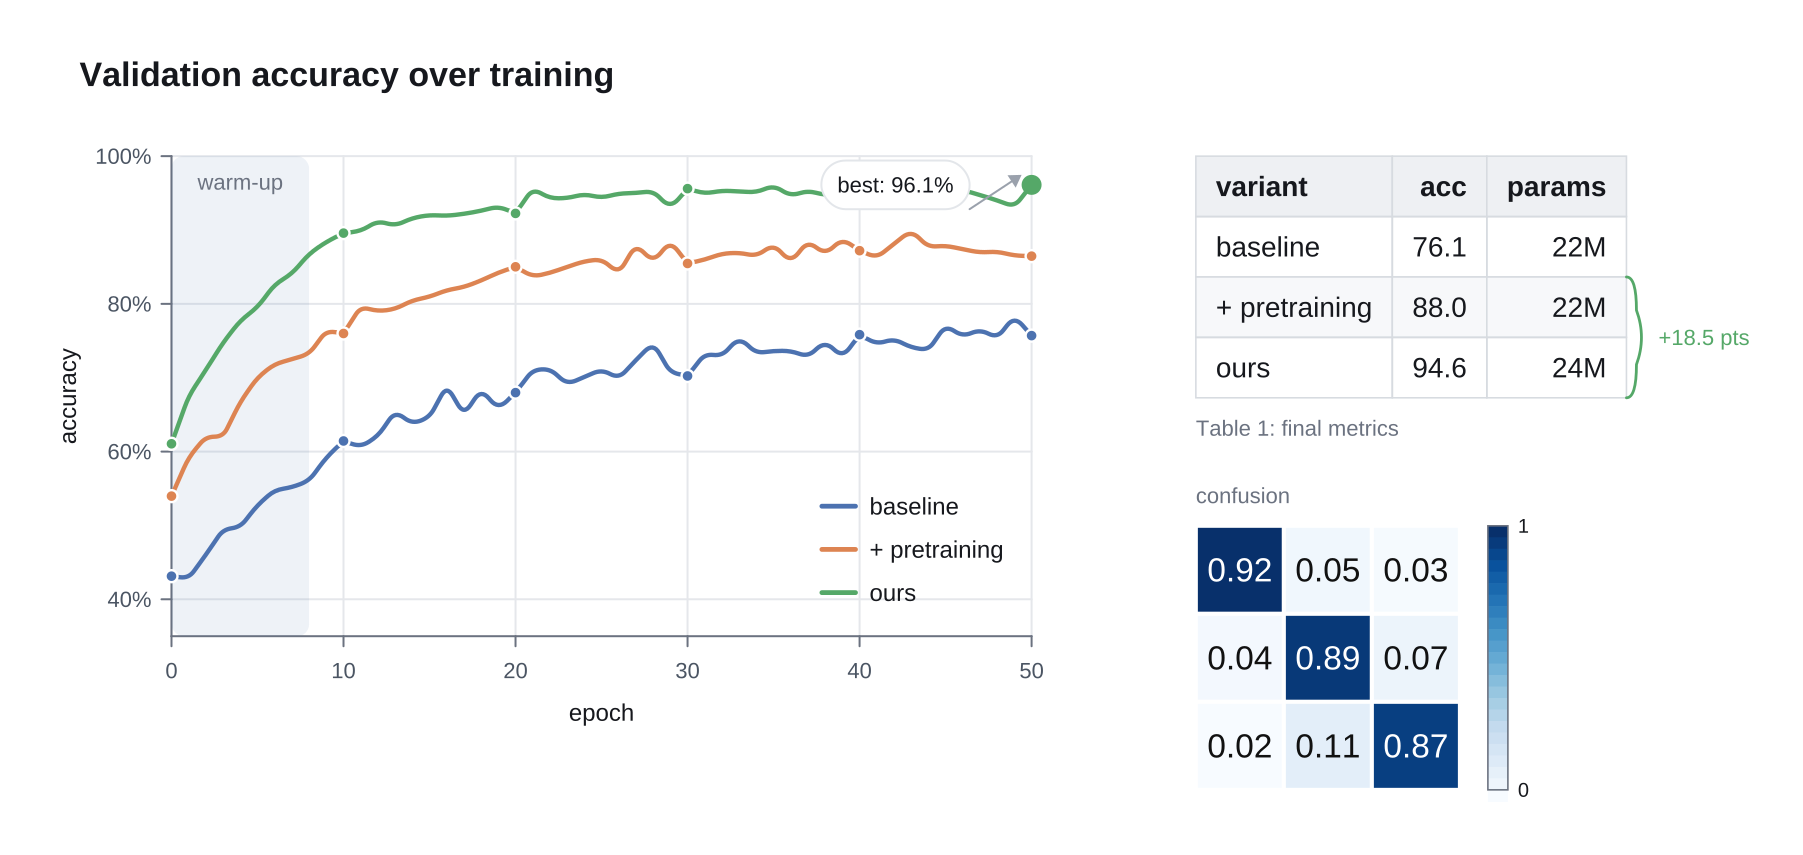
03_data_and_plots.py — data-driven graphics
A coordinate frame, a legend, a table, a brace and a heatmap with a colour bar.
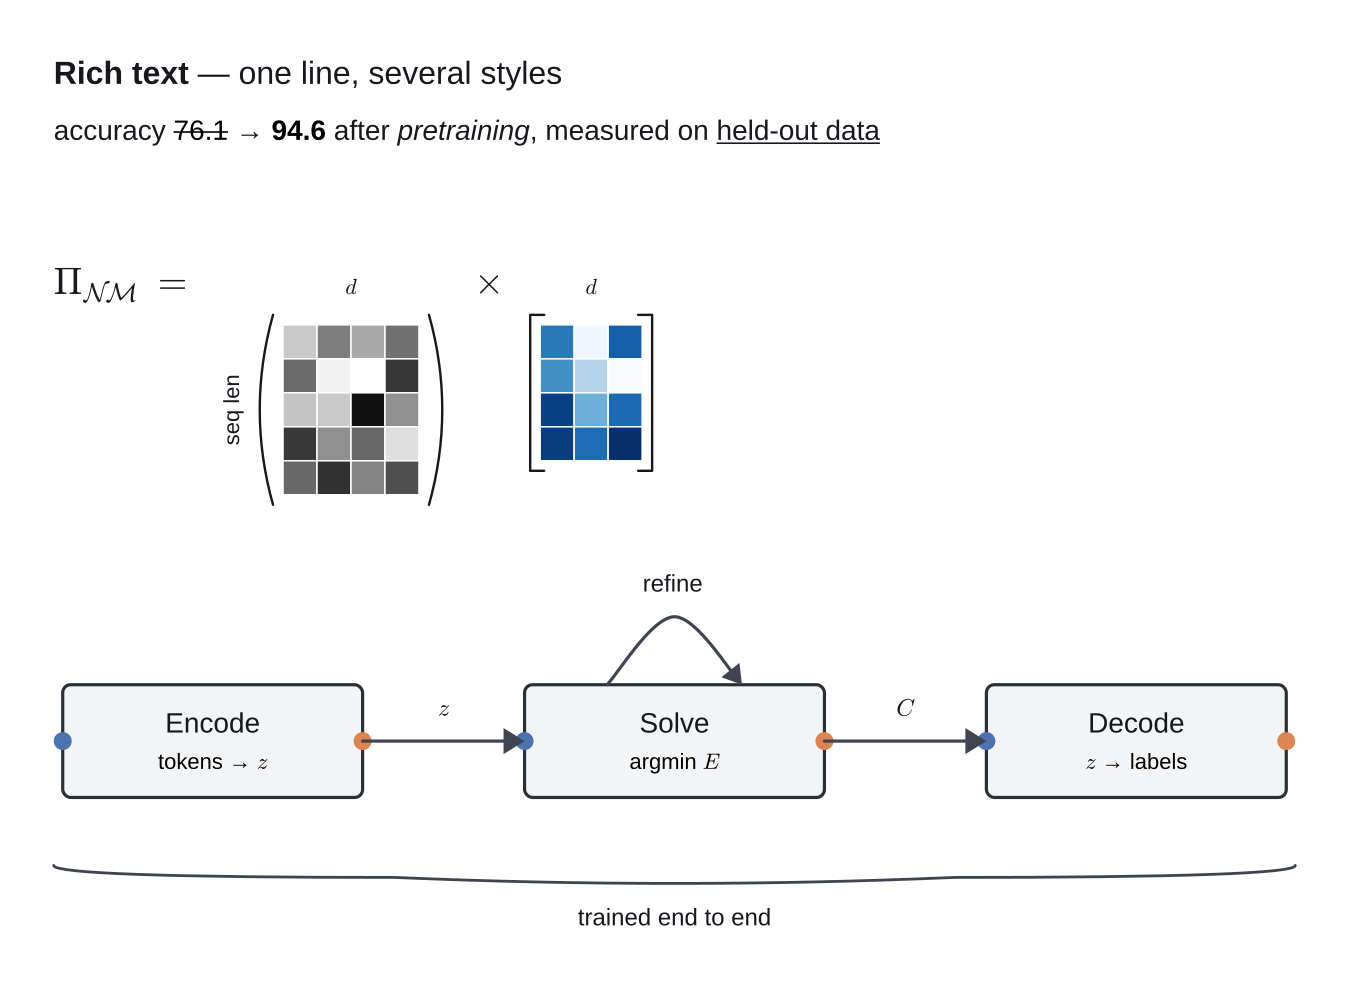
05_rich_text_and_components.py — spans, components and formulas
Per-word colour and strike-through, a Component publishing named ports, and
LabelledMatrix set as an equation with hstack(align="baseline").
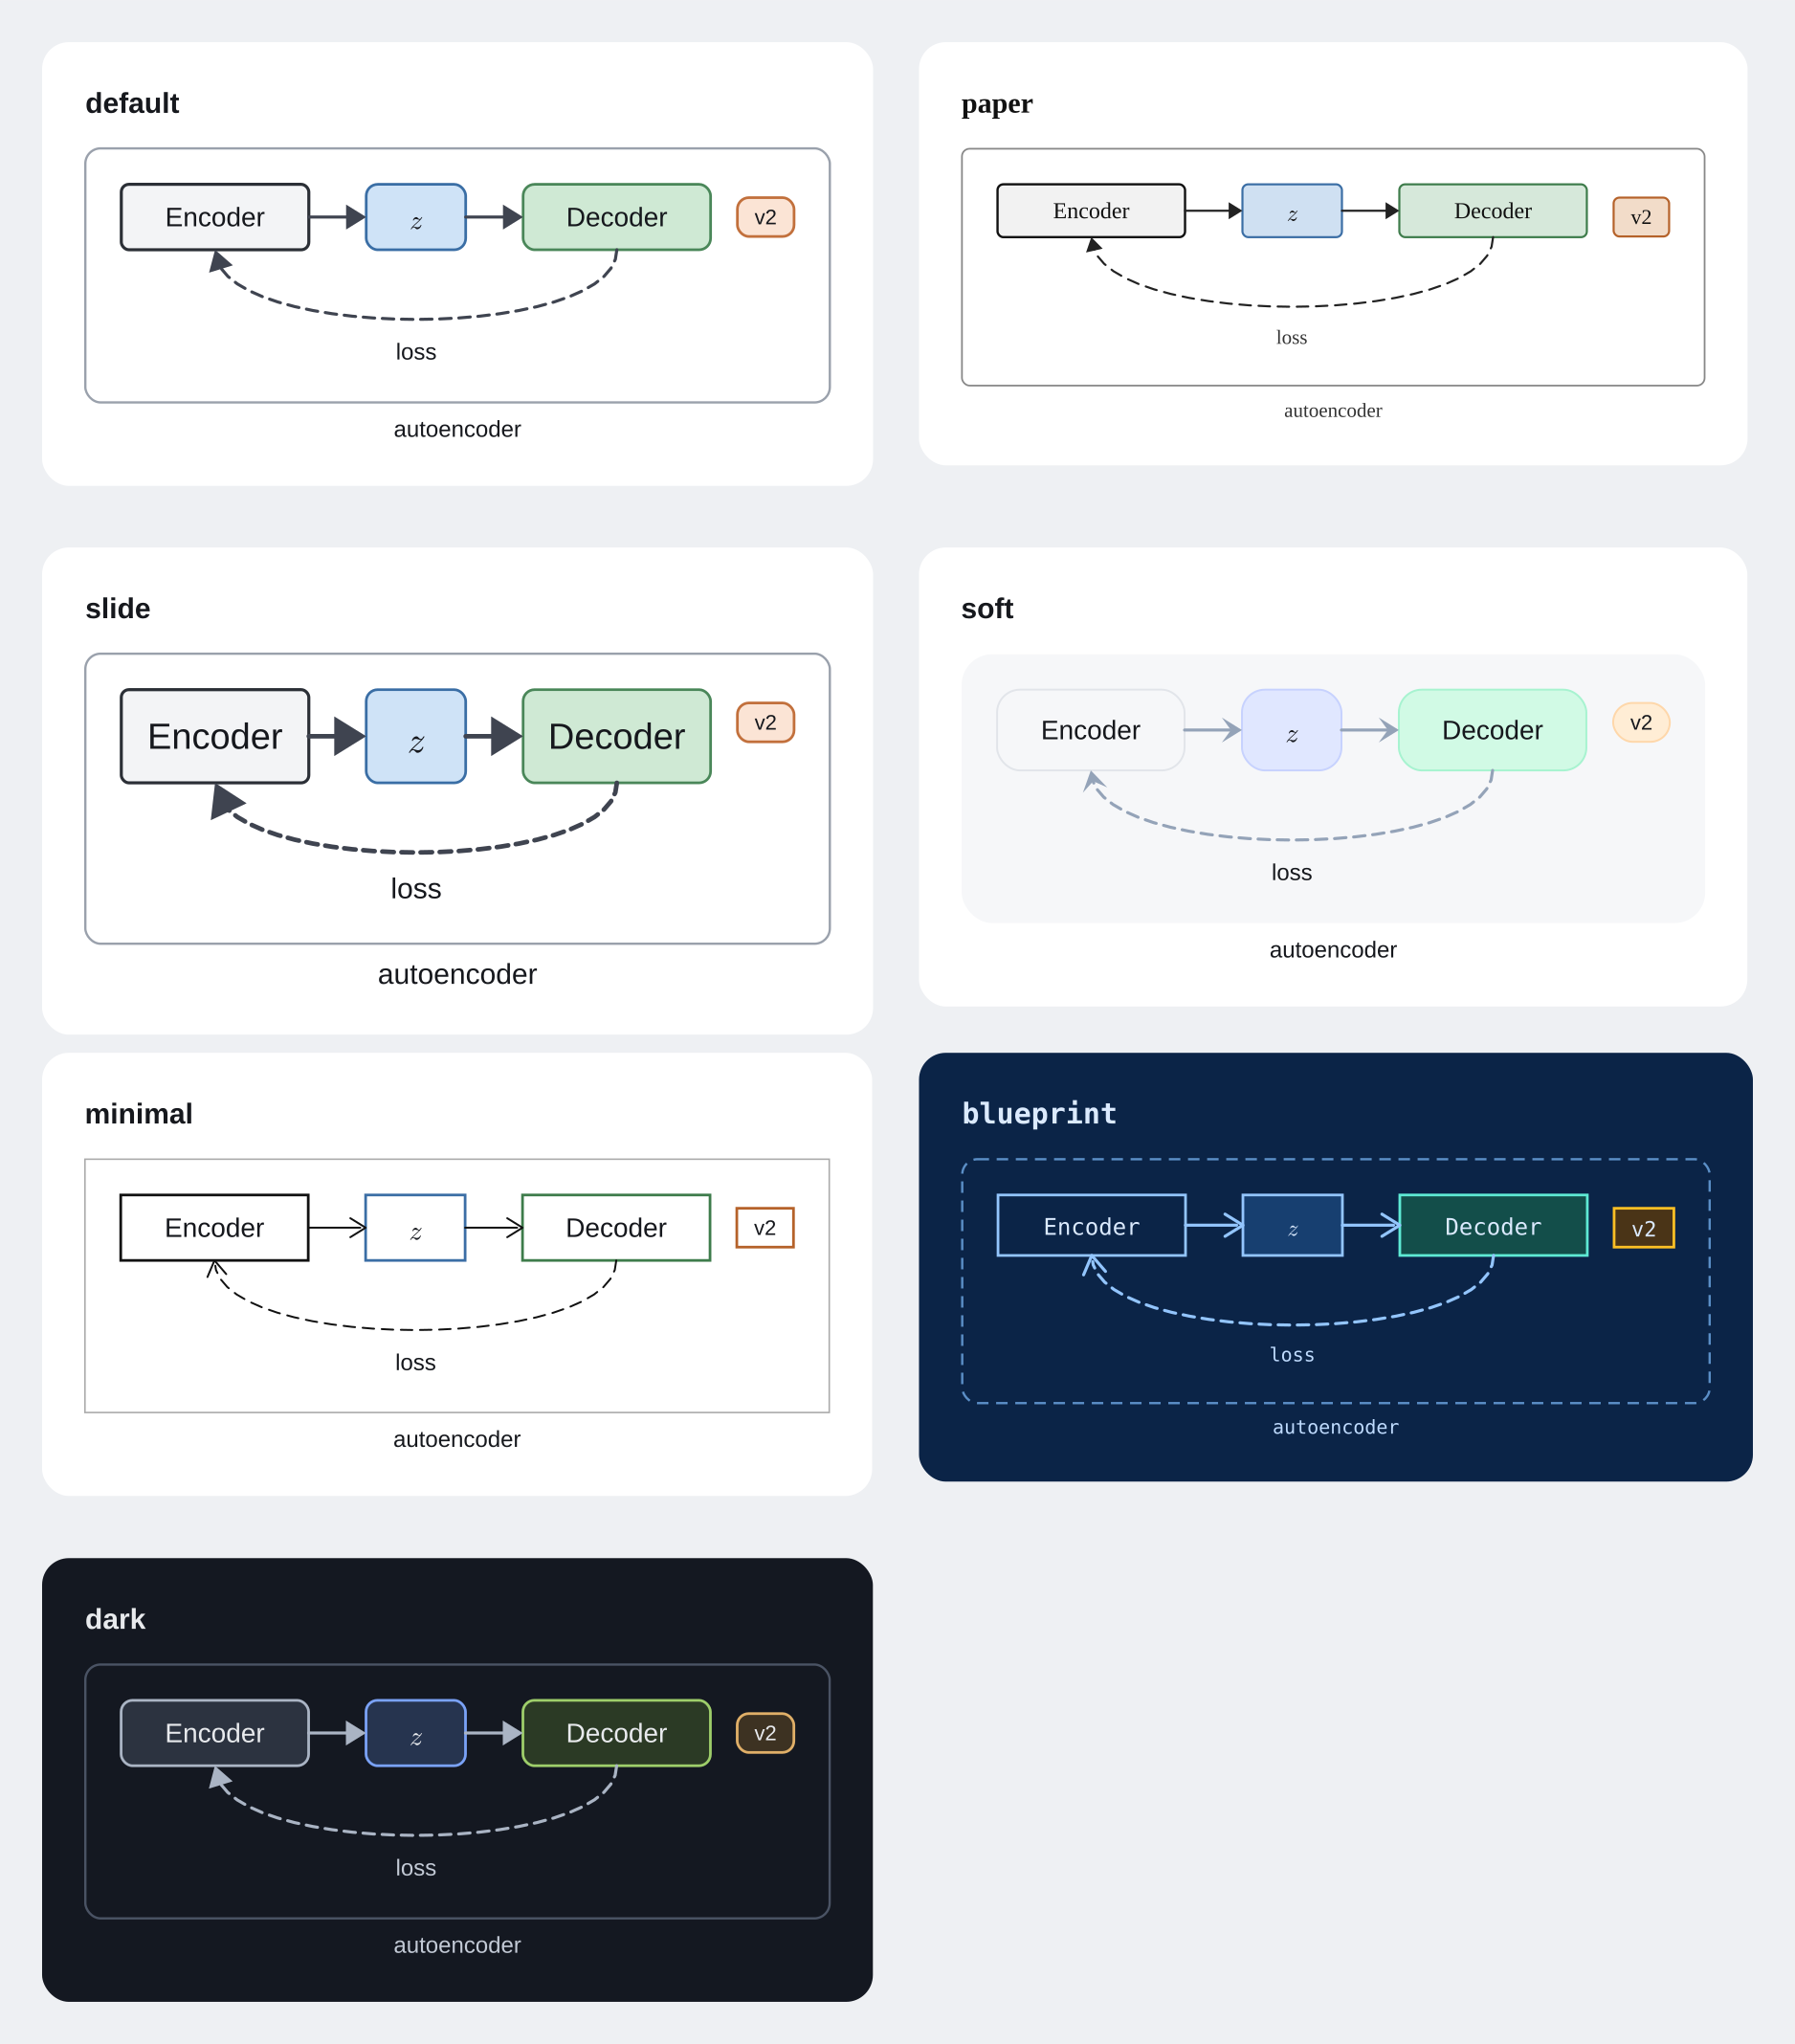
04_themes.py — one diagram, seven themes
Not a single colour is set on an element — the theme cascade decides everything.
API tour
| Canvas | Figure(w, h, pad, background, theme), fig.save(...), fig.to_svg() |
| Shapes | Box Pill Ellipse Circle Diamond Triangle Hexagon Parallelogram Chevron Star Cylinder Note Callout |
| Geometry | Line Polyline Polygon Path Dot Marker |
| Content | Text Label Span (per-word colour / strike / underline) Image |
| Composites | Matrix LabelledMatrix Vector ColorBar Table Legend Brace Bracket Panel Group Spacer Component |
| Connectors | arrow line elbow curve connect double_arrow self_loop |
| Placement | at move center_at right_of left_of above_of below_of inside align_to span_x resize rotate |
| Layout | align distribute_h/v spread_h/v hstack (incl. align="baseline") vstack grid fit brace_around between center_on circular same_size bbox_of |
| Data | Frame (pt line scatter bars area_fill region axes gridlines), nice_ticks |
| Checking | fig.audit() → Report (overlap overflow contrast crossing degenerate offscreen), el.ignore_audit() |
| Style | Style Theme use_theme, classes (classes=, add_class), themes PAPER SLIDE DARK BLUEPRINT MINIMAL SOFT |
| Colour | mix lighten darken alpha colormap palette contrast_color to_hex |
Anchors on every element: n s e w ne nw se sw center, plus at_angle(deg),
uv(u, v) and offsets like box.e + (6, 0). Connectors add c.mid and
c.anchor_at(t), which stay live as the arrow moves.
Design notes
- Coordinates are px, y grows downward — the SVG convention.
nis the top. - The output is clean SVG. No wrapper
<g>soup, no embedded raster of your text: real<text>elements by default, real<path>outlines when you ask fortext_as_paths=True(which PNG and PDF export do automatically). - Groups own their children.
Group(a, b)andfit(a, b)reparent, so the cluster moves as a unit. Usebbox_of([a, b])when you only want the bounds. - Text is centred optically, on the cap-height band, which is what looks right for short labels in boxes.
- No runtime layout engine. Placement happens when you call it. That makes
the code easy to reason about and easy to debug — print a
bboxand you know exactly where something is.
Development
pip install -e ".[dev]"
pytest                       # 277 tests; every example must audit clean
python -m pyflakes figkit
python examples/01_pipeline.py
See CONTRIBUTING.md for what the test suite expects — in particular, that new audit checks come with tests for the cases they must not report.
License
MIT
1 maintainer

Metadata
1 maintainer
Release files for figkit 0.1.0
For a detailed explanation of source distributions (sdists) and built distributions (wheels), please see the package formats documentation.
Source distribution (sdist)
| File | Size | Uploaded | |
|---|---|---|---|
| figkit-0.1.0.tar.gz | 145.8 kB | Details |
Built distribution (wheel)
| File | Interpreter | ABI | Platform | Reset |
|---|---|---|---|---|
| figkit-0.1.0-py3-none-any.whl | Python 3 | none | any | Details |
Total release size: 257.0 kB
Release files / figkit-0.1.0.tar.gz
| Download URL | figkit-0.1.0.tar.gz |
|---|---|
| Size | 145.8 kB |
| Tags | Source |
|
SHA-256 checksum How to use checksums |
8e71d8730ed983a8d2519c5750df191f1bdb0ec10b63f9fe25d936728b8731d7
|
|
BLAKE2b-256 checksum How to use checksums |
9c7d9ab64faa0be00a3761856d0d54def776b574c8f2055abac79068ed1ef770
|
| Upload date | |
|
Uploaded using Trusted Publishing? What is trusted publishing? |
Yes |
| Uploaded via |
twine/7.0.0 CPython/3.13.14
|
Provenance
Provenance describes where a file came from. On PyPI, provenance is shared via attestations, which provide a verifiable record of the build or publishing details. View details, limitations and caveats.


PyPI Publish Attestation
PyPI verified that this artifact, at this checksum, originated from the publisher listed below.
Signed by GitHub Actions, verified by PyPI on Aug 21, 2026.
Transparency logRelease files / figkit-0.1.0-py3-none-any.whl
| Download URL | figkit-0.1.0-py3-none-any.whl |
|---|---|
| Size | 111.3 kB |
| Tags | Python 3 |
|
SHA-256 checksum How to use checksums |
4cc189e986dbf57068ae0c999c8bec0d01bc832c278ea8bf147792a354789021
|
|
BLAKE2b-256 checksum How to use checksums |
3ff01e8a71a9b3ca64cfd844fe531be158990c3b8fe157076e9fce17fad3016d
|
| Upload date | |
|
Uploaded using Trusted Publishing? What is trusted publishing? |
Yes |
| Uploaded via |
twine/7.0.0 CPython/3.13.14
|
Provenance
Provenance describes where a file came from. On PyPI, provenance is shared via attestations, which provide a verifiable record of the build or publishing details. View details, limitations and caveats.
PyPI Publish Attestation
PyPI verified that this artifact, at this checksum, originated from the publisher listed below.
Signed by GitHub Actions, verified by PyPI on Aug 21, 2026.
Transparency log













