Making it easier to navigate and clean station data
Project description
filter_stations
- Import the library and load the api Key to use it
from filterstations import Filter, Interactive_maps
# Retrieve the apiKey and apiSecret from a config.json file
import json

# Authentication
with open('../bson/config.json') as f:
    conf = json.load(f)

apiKey = conf['apiKey']
apiSecret = conf['apiSecret']
Usage
fs = Filter(apiKey, apiSecret)
- getStationsInfo(station=None, multipleStations=[], countrycode=None)
station returns the information for a particular station
multipleStations - pass in a list of the stations. return a dataframe with the particular stations
countrycode - returns a dataframe of the stations in the particular region
returns stations information based on the parameters passed
- filterStations(address, distance, startDate=None, endDate=None, csvfile='KEcheck3.csv')
address - returns a dataframe of the stations and their clog flags in that particular region
distance - the distance desired to draw a radius from a particular region
startDate & endDate - the duration desired
csvfile - a file containing data of the stations in the format Date, station_precipitation, station_clogFlag
returns a dataframe of the filter
- filterStationsList(address, distance=100)
address - desired region
distance - radius of how far from the addres in kilometres
returns a list of the stations within the specified region
- k_neighbours(station, number=5)
station - the target station
number - number of neighbours desired
returns a dictionary of the stations from the closest distance in kilometres
Interacting with the data from the maps
maps = Interactive_maps(apiKey, apiSecret)
-
The maps functions are designed to work on jupyter notebooks
-
draw_map(map_center) Given the map center returns the map of the whole TAHMO stations network
-
create_animation(data, valid_sensors, day=100, T=10, interval=500)
data - The dataframe containing the dat
valid_sensors - the columns to filter from the data
day - the rows to choose from the data
T - the range to change the animation
returns an animated matrix of the data
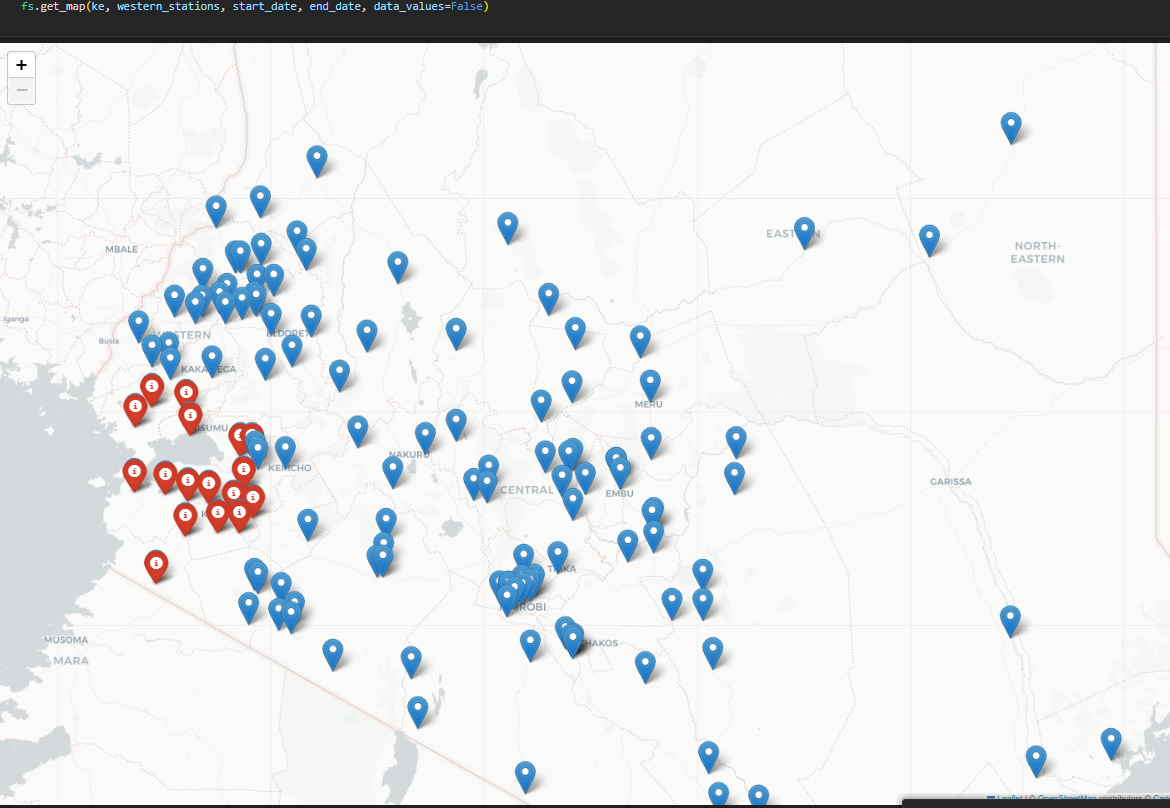
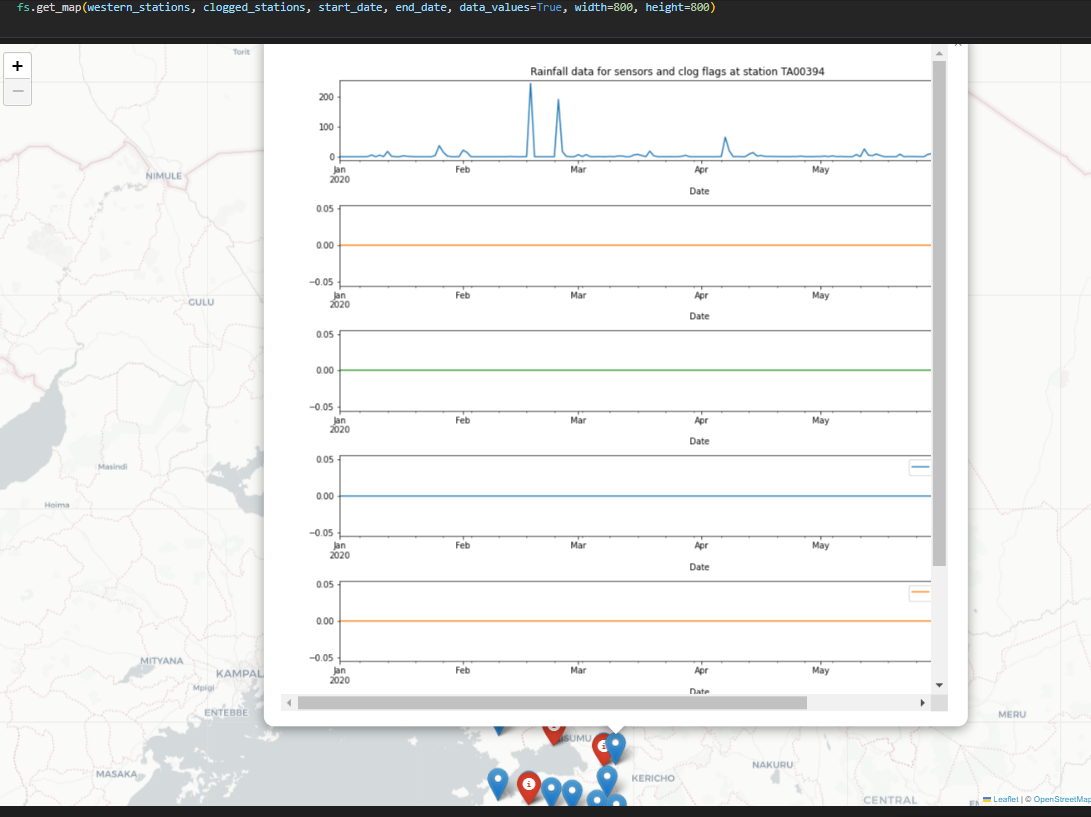
- get_map(subset1, subset2, start_date=None, end_date=None, data_values=False, csv_file='KEcheck3.csv', min_zoom=8, max_zoom=11, width=850, height=850)
Subset1 - a list of the stations
subset2 - a second list of stations
Given two lists, this can be the valid sensors and the clogged sensors or subset1 can be a list of the entire map then subset2 the specific region chosen
returns a map with blue being subset1 and red subset2
To get the values of the stations for the subset on click, set the data_values to be true and choose a specific start and end date
width & height - the size of the popup on click
Project details
Release history Release notifications | RSS feed
Download files
Download the file for your platform. If you're not sure which to choose, learn more about installing packages.
Source Distribution
Built Distribution
Hashes for filter_stations-0.3.0-py3-none-any.whl
| Algorithm | Hash digest | |
|---|---|---|
| SHA256 | 24d869951ff819d8ab94e39cc4f71d5b3df931921841c96a43a550e105f6f557 |
|
| MD5 | 9dd22e7842c53b22c4726bd5225e2dca |
|
| BLAKE2b-256 | 9647e1498b52408fe36725759637b1a9b6d244f2264bf939c58bb30b65d509a1 |


