
fin-pocket






Technical analysis signal visualization tool for stocks. Fetches historical data from Yahoo Finance and renders interactive charts with configurable technical signals.
Quick tip: Not sure whether to buy a stock? Generate a chart, take a screenshot, and send it to any LLM (ChatGPT, Claude, Gemini, etc.) with a question like "Based on these technical signals, is it a good time to buy? What are the key levels to watch?" — you'll get an instant analysis without needing to read the chart yourself.
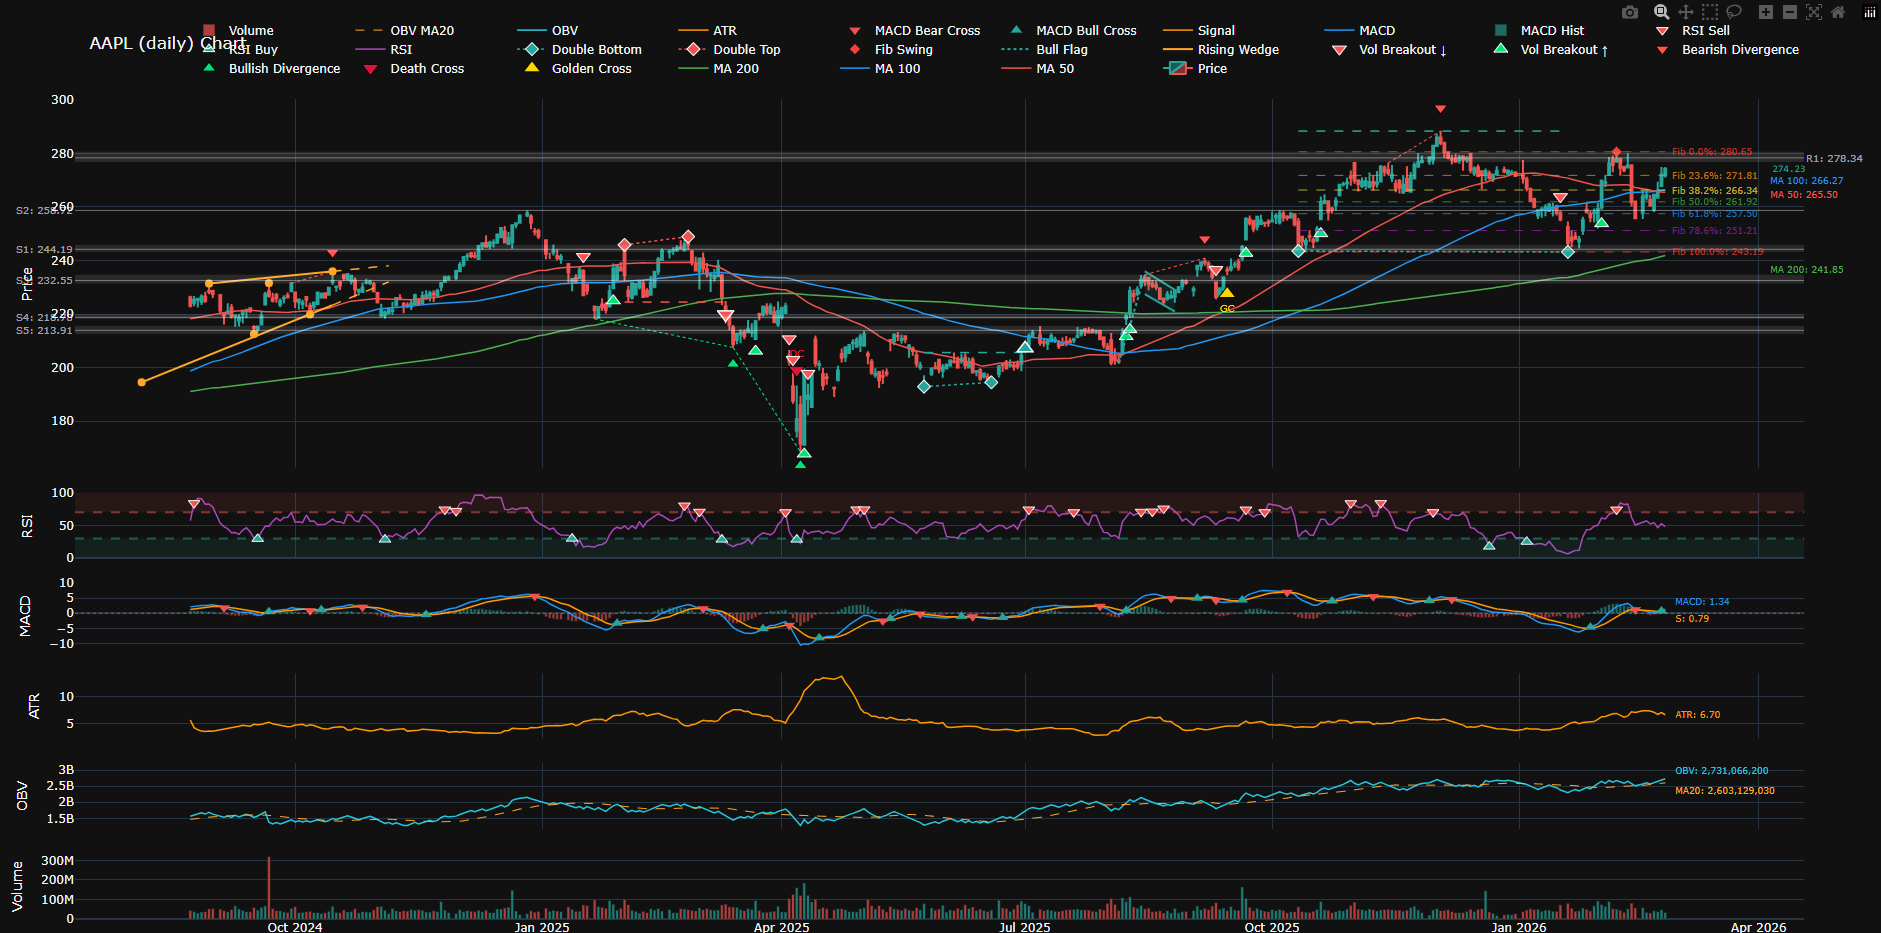
Features
| Signal | Description | Default |
|---|---|---|
| Moving Averages | MA 50 / 100 / 200 (configurable periods) | On |
| MA Crossover | Golden Cross & Death Cross detection | On |
| RSI | Relative Strength Index with overbought/oversold zones | On |
| RSI Divergence | Bullish/bearish divergence between price and RSI | On |
| Support / Resistance | Pivot-based S/R level detection with clustering | On |
| Volume Breakout | S/R breakout confirmed by above-average volume | On |
| Wedge | Rising and falling wedge pattern detection | On |
| Flag & Pennant | Flagpole + parallel channel or converging triangle | On |
| Double Top/Bottom | Double top (bearish) and double bottom (bullish) reversal patterns | On |
| Bollinger Bands | Volatility envelope around a 20-period SMA (±2 std dev) | Off |
| MACD | Moving Average Convergence Divergence (12, 26, 9) with crossover signals | On |
| ATR | Average True Range — 14-period volatility measure | On |
| OBV | On-Balance Volume with 20-period MA overlay | On |
| Fibonacci Retracement | Key retracement levels from the last major swing | On |
Signal Descriptions
Moving Averages (MA)
Simple Moving Averages plotted for 50, 100, and 200 periods (configurable). They smooth out price action and help identify the overall trend direction. When the price is above MAs — the trend is bullish; below — bearish.
MA Crossover (Golden / Death Cross)
Detects when the short-term MA (50) crosses the long-term MA (200). A Golden Cross (50 crosses above 200) is a bullish signal, while a Death Cross (50 crosses below 200) is a bearish signal. Markers are plotted at the crossover points.
RSI (Relative Strength Index)
A momentum oscillator (0–100) that measures the speed and magnitude of price changes over 14 periods. Values above 70 indicate overbought conditions; below 30 — oversold. Displayed on a separate panel with shaded zones.
RSI Divergence
Detects divergences between price and RSI — when price makes a new high/low but RSI does not confirm. Bullish divergence (price makes lower low, RSI makes higher low) suggests potential reversal up. Bearish divergence is the opposite.
Support / Resistance
Identifies key horizontal price levels where buying (support) or selling (resistance) pressure has historically clustered. Uses pivot-based detection with configurable tolerance and clustering to avoid duplicate levels.
Volume Breakout
Flags breakouts through Support/Resistance levels that are confirmed by above-average volume. Higher volume on a breakout increases the probability that the move is genuine rather than a false break.
Wedge
Detects rising wedges (bearish) and falling wedges (bullish) — converging trendlines where both highs and lows move in the same direction. A breakout from the wedge in the opposite direction is plotted.
Flag & Pennant
Identifies continuation patterns: a sharp move (flagpole) followed by a consolidation (flag = parallel channel, pennant = converging triangle). Patterns are highlighted with trendlines on the chart.
Double Top / Bottom
Recognizes classic reversal patterns. A double top occurs when price reaches the same high twice and fails to break through — bearish. A double bottom is the inverse — bullish. Neckline and confirmation levels are plotted.
Bollinger Bands
Three lines plotted around a 20-period SMA: the upper band at +2 standard deviations and the lower band at −2 standard deviations. When the bands contract, volatility is low (squeeze); when they expand, a significant move may follow. Disabled by default.
MACD (Moving Average Convergence Divergence)
Calculated as the difference between the 12-period and 26-period EMAs. A 9-period EMA of the MACD line (signal line) and a histogram (MACD − signal) are also plotted. Bullish crossover: MACD crosses above signal. Bearish crossover: MACD crosses below signal. Crossover markers are displayed on the chart.
ATR (Average True Range)
Measures market volatility as the 14-period rolling average of True Range (the greatest of: High−Low, |High−prevClose|, |Low−prevClose|). Higher ATR = more volatile market. Plotted on a separate panel.
OBV (On-Balance Volume)
A cumulative volume indicator: volume is added when close > previous close and subtracted when close < previous close. Rising OBV confirms an uptrend; falling OBV confirms a downtrend. A 20-period MA overlay is included for smoothing.
Fibonacci Retracement
Plots key retracement levels (23.6%, 38.2%, 50%, 61.8%, 78.6%) based on the last major price swing. Traders watch these levels for potential support/resistance during pullbacks.
Installation
From PyPI:
pip install fin-pocket
From source:
git clone git@github.com:canyoupleasecreateanaccount/fin-pocket.git && cd fin-pocket
python -m venv venv
source venv/bin/activate   # Linux/macOS
venv\Scripts\activate      # Windows
pip install -e ".[dev]"
Usage
Basic
fin-pocket AAPL
or via module:
python -m fin_pocket AAPL
Options
positional arguments:
  ticker                Stock ticker symbol (e.g. AAPL, GOOG, MSFT)

options:
  -t, --timeframe {daily,hourly}   Chart timeframe (default: daily)
  -o, --output FILE                Save chart to HTML file
  --height PIXELS                  Chart height in pixels (default: 1000)

signals:
  --no-ma               Disable Moving Averages
  --no-ma-cross         Disable MA Crossover
  --no-rsi              Disable RSI
  --no-rsi-divergence   Disable RSI Divergence
  --no-sr               Disable Support/Resistance levels
  --no-volume-breakout  Disable Volume Breakout
  --no-wedge            Disable Wedge patterns
  --no-flag             Disable Flag & Pennant patterns
  --no-fibonacci        Disable Fibonacci Retracement
  --no-double           Disable Double Top/Bottom
  --bb                  Enable Bollinger Bands (off by default)
  --no-macd             Disable MACD
  --no-atr              Disable ATR
  --no-obv              Disable OBV
Examples
# Daily chart for Google with all defaults
fin-pocket GOOG

# Hourly chart for Tesla, no wedges
fin-pocket TSLA --timeframe hourly --no-wedge

# Save to file instead of opening browser
fin-pocket MSFT --output msft_chart.html

# Minimal chart — only price and moving averages
fin-pocket AAPL --no-rsi --no-rsi-divergence --no-sr --no-volume-breakout --no-wedge --no-flag --no-fibonacci --no-double --no-macd --no-atr --no-obv
Project Structure
fin-pocket/
├── fin_pocket/
│   ├── __init__.py      # Package version
│   ├── __main__.py      # python -m fin_pocket
│   ├── cli.py           # CLI entry point
│   ├── chart.py         # Plotly chart builder
│   ├── data/
│   │   ├── __init__.py
│   │   └── provider.py  # Yahoo Finance data provider
│   └── signals/
│       ├── __init__.py
│       ├── base.py      # Abstract base signal class
│       ├── moving_averages.py
│       ├── ma_crossover.py
│       ├── rsi.py
│       ├── rsi_divergence.py
│       ├── support_resistance.py
│       ├── volume_breakout.py
│       ├── wedge.py
│       ├── pennant.py   # Flag & Pennant
│       ├── double_top_bottom.py
│       ├── bollinger_bands.py
│       ├── macd.py
│       ├── atr.py
│       ├── obv.py
│       └── fibonacci.py # Fibonacci Retracement
├── tests/
│   └── ...
├── pyproject.toml
├── LICENSE
└── README.md
Running Tests
pytest
pytest --cov=fin_pocket
Dependencies
- yfinance — historical market data from Yahoo Finance
- pandas — data manipulation
- plotly — interactive charting
- numpy — numerical computations
Contributing
See CONTRIBUTING.md for how to submit pull requests.
Contact
Email: solveme.solutions@gmail.com
Support

- BTC:
bc1qdmesklh36r03vgw7m6zcxjhakvsxe4q45nk0p4 - ETH / BNB / MATIC:
0x3EC81929e06950322d5125d8e6CA834F3d9B21f8 - SOL:
86VzJkNe69YZvnKXrUGwoMVJtPp5yk67eQJokBJph4XW - TRX:
TEak8XxSGDeeSY11Dj6BDpiPWadVm75E2C
License
Proprietary — for personal use only. See LICENSE.
1 maintainer

Metadata
1 maintainer
Release files for fin-pocket 1.0.1
For a detailed explanation of source distributions (sdists) and built distributions (wheels), please see the package formats documentation.
Source distribution (sdist)
| File | Size | Uploaded | |
|---|---|---|---|
| fin_pocket-1.0.1.tar.gz | 314.2 kB | Details |
Built distribution (wheel)
| File | Interpreter | ABI | Platform | Reset |
|---|---|---|---|---|
| fin_pocket-1.0.1-py3-none-any.whl | Python 3 | none | any | Details |
Total release size: 352.6 kB
Release files / fin_pocket-1.0.1.tar.gz
| Download URL | fin_pocket-1.0.1.tar.gz |
|---|---|
| Size | 314.2 kB |
| Tags | Source |
|
SHA-256 checksum How to use checksums |
4a2624f81416d0fda605bf25882af5b296e3896d5643c184fecad7ae15a2be94
|
|
BLAKE2b-256 checksum How to use checksums |
6adee5d2297d4663743eae51dfd242b22830a3bcc4ec082a6fb3a644e89a2f1b
|
| Upload date | |
|
Uploaded using Trusted Publishing? What is trusted publishing? |
Yes |
| Uploaded via |
twine/7.0.0 CPython/3.13.14
|
Provenance
Provenance describes where a file came from. On PyPI, provenance is shared via attestations, which provide a verifiable record of the build or publishing details. View details, limitations and caveats.


PyPI Publish Attestation
PyPI verified that this artifact, at this checksum, originated from the publisher listed below.
Signed by GitHub Actions, verified by PyPI on Oct 7, 2026.
Transparency logRelease files / fin_pocket-1.0.1-py3-none-any.whl
| Download URL | fin_pocket-1.0.1-py3-none-any.whl |
|---|---|
| Size | 38.3 kB |
| Tags | Python 3 |
|
SHA-256 checksum How to use checksums |
4d6c8e4be084c12f5d0d1f0622a1c1b1e7a0ae30b2b045fbaf9363373557d818
|
|
BLAKE2b-256 checksum How to use checksums |
cfa67268da3e32c136fee873b80ec9144cafe1e26d844d70e9392406c1d3f9b3
|
| Upload date | |
|
Uploaded using Trusted Publishing? What is trusted publishing? |
Yes |
| Uploaded via |
twine/7.0.0 CPython/3.13.14
|
Provenance
Provenance describes where a file came from. On PyPI, provenance is shared via attestations, which provide a verifiable record of the build or publishing details. View details, limitations and caveats.
PyPI Publish Attestation
PyPI verified that this artifact, at this checksum, originated from the publisher listed below.
Signed by GitHub Actions, verified by PyPI on Oct 7, 2026.
Transparency log













