Prometheus Metrics for Flask Web App

Project description
Flask Prometheus Metrics


Prometheus metrics exporter for Flask web applications.
flask_prometheus_metrics uses official Prometheus Python Client
providing basic metrics about process resource usage, app's requests metrics and information.
Installation
pip install -U flask_prometheus_metrics
You will need Flask to run examples below:
pip install -U 'flask_prometheus_metrics[flask]'
Usage
Run the following minimal example in Python shell:
from flask import Flask
from prometheus_client import make_wsgi_app
from werkzeug.middleware.dispatcher import DispatcherMiddleware
from werkzeug.serving import run_simple
from flask_prometheus_metrics import register_metrics

app = Flask(__name__)

@app.route("/")
def index():
    return "Test"

# provide app's version and deploy environment/config name to set a gauge metric
register_metrics(app, app_version="v0.1.2", app_config="staging")

# Plug metrics WSGI app to your main app with dispatcher
dispatcher = DispatcherMiddleware(app.wsgi_app, {"/metrics": make_wsgi_app()})

run_simple(hostname="localhost", port=5000, application=dispatcher)
Then go over http://localhost:5000/, refresh page a few times and check your
app's metrics at http://localhost:5000/metrics.
See also example.py for more elaborate example of library usage in real Flask applications.
Metrics
flask_prometheus_metrics exposes the following application metrics:
app_request_latency_seconds(histogram) - Application request latencyapp_request_count_total(counter) - application request countapp_version_info(gauge) - application version
Library also provides some metrics about a Python interpreter used and process resource usage:
python_gc_objects_collected_total(counter) - objects collected during gcpython_gc_objects_uncollectable_total(counter) - uncollectable object found during GCpython_gc_collections_total(counter) - number of times this generation was collectedpython_info(gauge) - Python platform informationprocess_virtual_memory_bytes(gauge) - virtual memory size in bytesprocess_resident_memory_bytes(gauge) - resident memory size in bytesprocess_start_time_seconds(gauge) - start time of the process since unix epoch in secondsprocess_cpu_seconds_total(counter) - total user and system CPU time spent in secondsprocess_open_fds(gauge) - number of open file descriptorsprocess_max_fds(gauge) - maximum number of open file descriptors
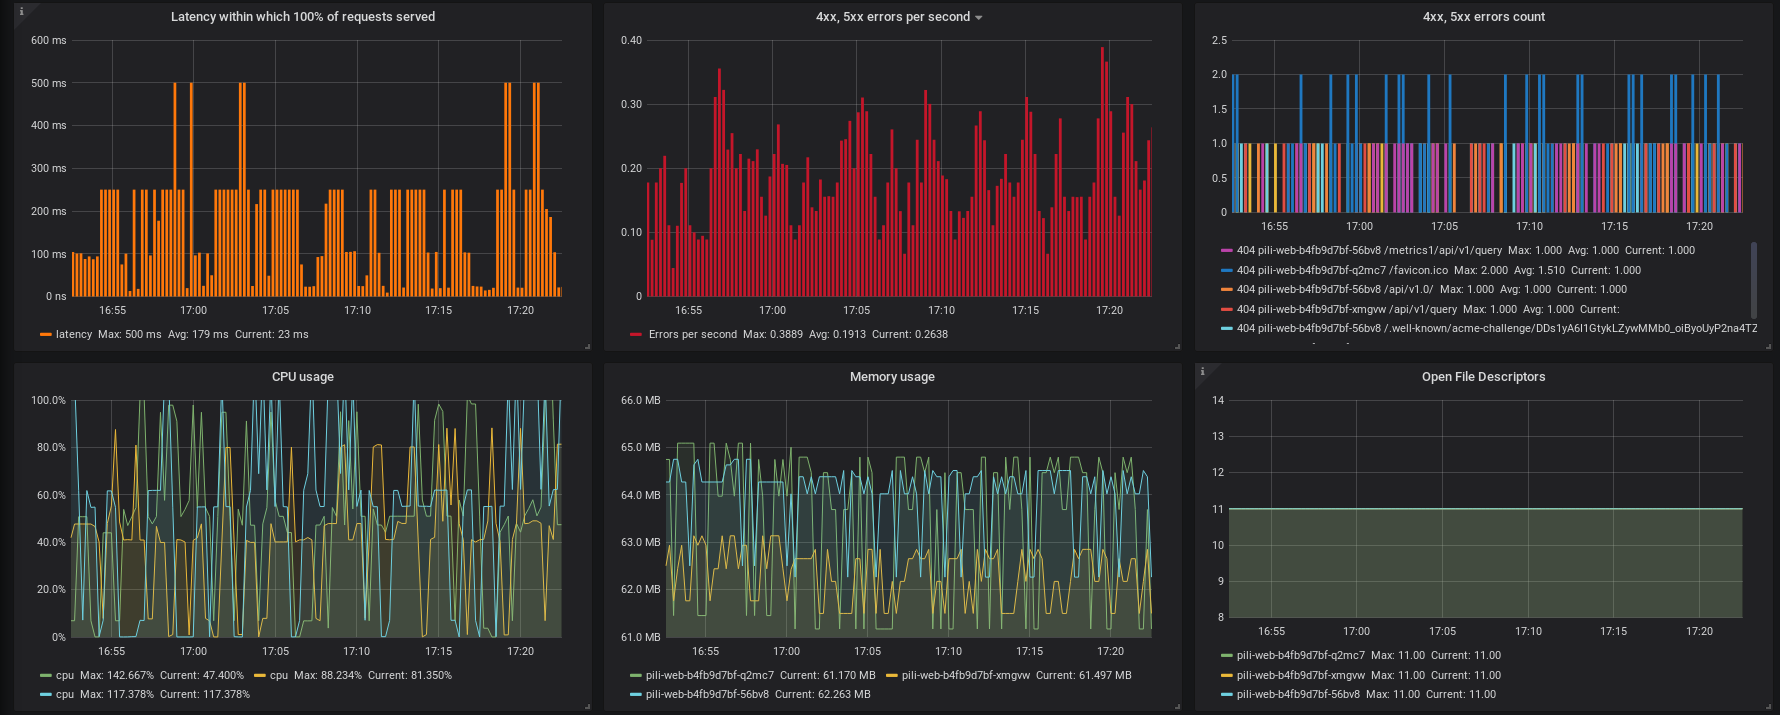
Grafana dashboard
The metrics exported by flask_prometheus_metrics can be scraped by
Prometheus monitoring system and then visualized in
Grafana.
You can download Grafana dashboard crafted specifically for the flask_prometheus_metrics
default metrics here.
Testing
When testing Flask application with DispatcherMiddleware (see Usage example above)
you may want to use a little hack
in order to make Flask's test_client() work properly.
History
v1.0.0 (2019-06-06)
- Library is ready for production
- Minor setup.py fixes (#12)
v0.7.0 (2019-06-06)
- README.md adjusted to work both on GitHub and PyPi (#11)
v0.6.2 (2019-06-06)
- Codeclimate integration added
v0.6.1 (2019-06-06)
- Travis CI configuration fixed
v0.6.0 (2019-06-06)
- README and CHANGELOG as long description added
v0.5.0 (2019-06-06)
- CHANGELOG.md added
v0.4.0 (2019-06-06)
- Import simplified for metrics registration function
v0.3.1 (2019-06-05)
- Minor CI config fix
v0.3.0 (2019-06-05)
- Dependencies versions and safety checks added
v0.2.1 (2019-06-01)
- Update installation example in README
v0.2.0 (2019-06-01)
- README added, some code refactoring
v0.1.2 (2019-06-01)
- Version bumped
v0.1.1 (2019-06-01)
- Package versioning fix
v0.1.0 (2019-06-01)
- MVP
Release history Release notifications | RSS feed


Download files
Download the file for your platform. If you're not sure which to choose, learn more about installing packages.
Source Distribution
Built Distribution
Filter files by name, interpreter, ABI, and platform.
If you're not sure about the file name format, learn more about wheel file names.
Copy a direct link to the current filters
File details
Details for the file flask_prometheus_metrics-1.0.0.tar.gz.
File metadata
- Download URL: flask_prometheus_metrics-1.0.0.tar.gz
- Upload date:
- Size: 5.8 kB
- Tags: Source
- Uploaded using Trusted Publishing? No
- Uploaded via: twine/1.13.0 pkginfo/1.5.0.1 requests/2.22.0 setuptools/41.0.1 requests-toolbelt/0.9.1 tqdm/4.32.1 CPython/3.7.1
File hashes
| Algorithm | Hash digest | |
|---|---|---|
| SHA256 |
a2f79c40b53a04e861c4192514c043ff7d807e2fb0131b3eee29a6984206b22e
|
|
| MD5 |
f358667a31cffbae283616f2a8a133d6
|
|
| BLAKE2b-256 |
74a283a59fb33c2024dff49d6a493cced94c34d57fbfe6ee1fa5e90faf86df90
|
File details
Details for the file flask_prometheus_metrics-1.0.0-py3-none-any.whl.
File metadata
- Download URL: flask_prometheus_metrics-1.0.0-py3-none-any.whl
- Upload date:
- Size: 6.2 kB
- Tags: Python 3
- Uploaded using Trusted Publishing? No
- Uploaded via: twine/1.13.0 pkginfo/1.5.0.1 requests/2.22.0 setuptools/41.0.1 requests-toolbelt/0.9.1 tqdm/4.32.1 CPython/3.7.1
File hashes
| Algorithm | Hash digest | |
|---|---|---|
| SHA256 |
f28e8d3a9d0b7ee4761f1490c9653a95d83e11136ba6ecd010697aa9b3b83724
|
|
| MD5 |
c5e1ef5be75d42d812f816b15a77c9fd
|
|
| BLAKE2b-256 |
e66409958116bdc267a1ee8f442e135166990d54403c8fdd4e8b3d275d7f7433
|


