
A flexible profiling utility for Python.

Project description



🚀 About
FlexProfiler is a lightweight, flexible profiling utility for Python that makes it easy to measure function and method performance with minimal code changes. It supports both function-level and line-level profiling, recursive class method tracking, and customizable statistics reporting. Designed for developers who want actionable insights into their code’s runtime behavior, FlexProfiler helps you identify bottlenecks and optimize performance with simple decorators and clear output.
📦 Installation
pip install flexprofiler
💻 Usage
The most common usage involves adding simple decorators to your functions or classes, enabling you to profile execution time and other metrics with minimal changes to your codebase. This approach makes it easy to identify bottlenecks and optimize your code efficiently.
@track()- decorate a function to collect call counts and timing statistics. Args:lines: boolean, collect per-line timing inside the function.
@track()- Decorate a class to profile all its methods. Args:max_depth: integer, how deep to recursively profile composed objects (default: 10).include: list of method names to track (default: None to track all).exclude: list of method names to skip (default: None to skip none).arg_sensitive: list of method names to track argument values (default: None).
stats()- print aggregated profiling statistics (function-level and, when enabled, line-level). Args:unit: the time unit to use for displaying statistics (default: "ms").
⬇️ Examples
1. Tracking a Simple Function
Simple function profiling example — demonstrates using @track to profile a standalone function.
import time
from flexprofiler import stats, track

@track()  # Use @track() decorator to profile the function
def simple_func():
    time.sleep(0.1)

simple_func()
simple_func()

stats() # display the profiling statistics
output:

2. Tracking All Methods in a Class
Class profiling example — demonstrates using @track to profile all methods of a class.
import time
from flexprofiler import track, stats

@track()  # Use @track() decorator to profile all methods in the class
class Foo:
    def example_method(self):
        self.another_method()
        time.sleep(0.1)
    def another_method(self):
        time.sleep(0.2)

Foo().example_method()
Foo().another_method()

stats()
output:

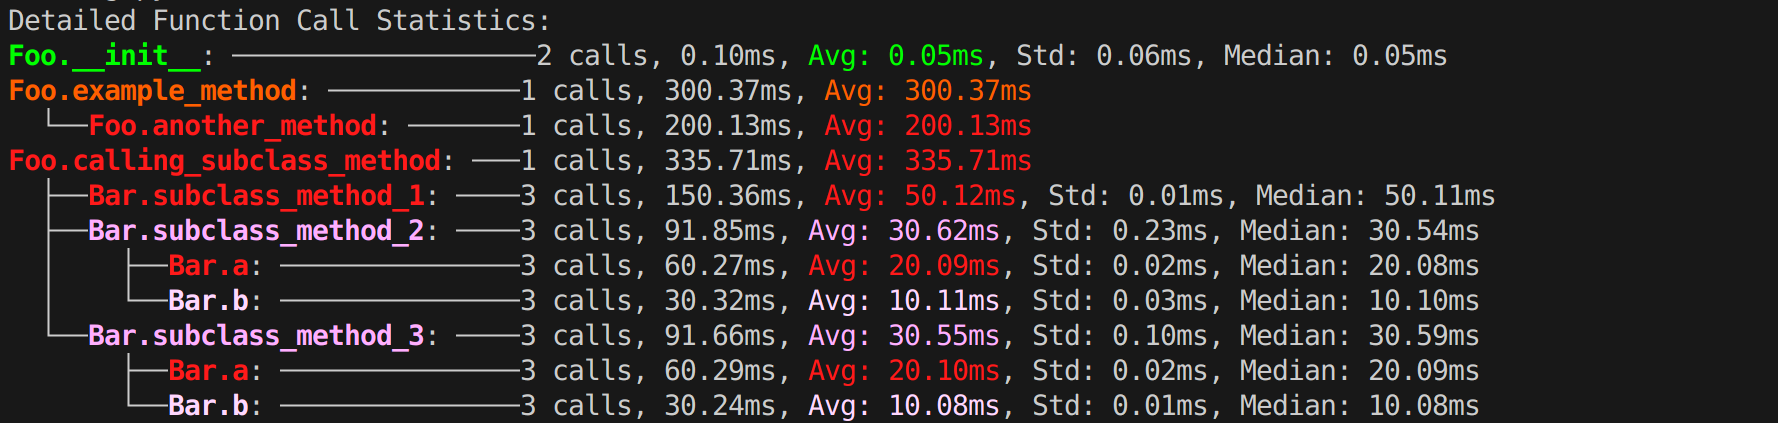
3. Tracking All Methods in a Class Recursively
Recursive class profiling example — demonstrates recursively tracking methods in nested/instantiated classes using @track(max_depth=...).
import time
from flexprofiler import track, stats

@track(max_depth=3)
class Foo:
    def __init__(self):
        self.sub_class = Bar()
    def example_method(self):
        self.another_method()
        time.sleep(0.1)
    def another_method(self):
        time.sleep(0.2)
    def calling_subclass_method(self):
        for i in range(3):
            self.sub_class.subclass_method_1()
            self.sub_class.subclass_method_2()
            self.sub_class.subclass_method_3()

class Bar:
    def subclass_method_1(self):
        time.sleep(0.05)
    def subclass_method_2(self):
        self.a()
        self.b()
    def subclass_method_3(self):
        self.a()
        self.b()
    def a(self):
        time.sleep(0.02)
    def b(self):
        time.sleep(0.01)

obj = Foo()
obj.example_method()
obj.calling_subclass_method()

stats()
output:
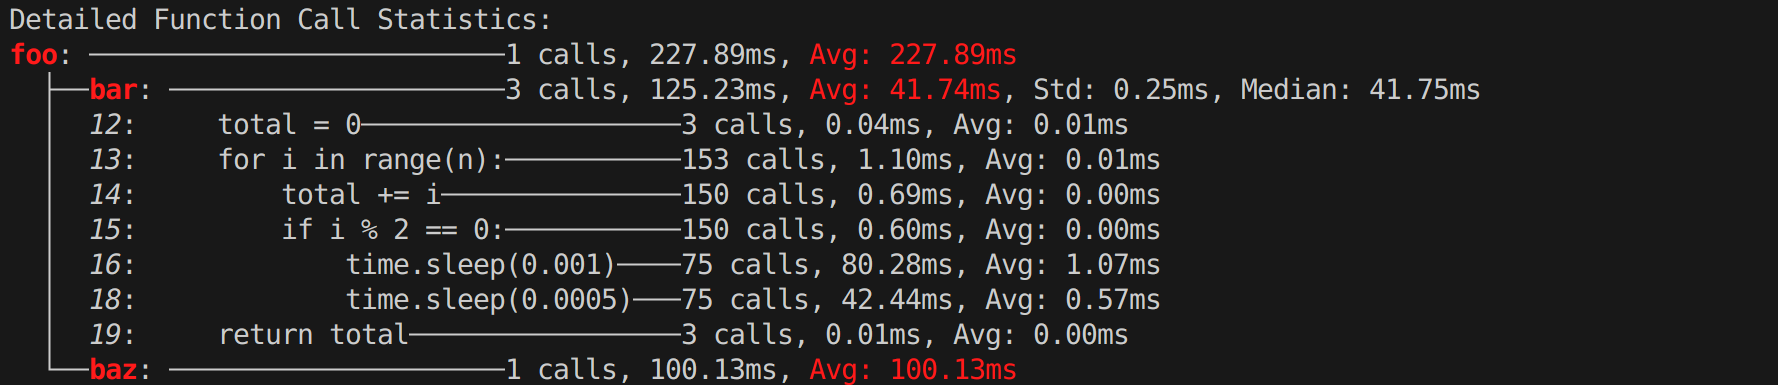
4. Track All lines in a function
Line-by-line profiling example — demonstrates per-line timing with @track(lines=True).
import time
from flexprofiler import track, stats


@track(lines=True)  # with line tracking
def bar(n):
    total = 0
    for i in range(n):
        total += i
        if i % 2 == 0:
            time.sleep(0.001)
        else:
            time.sleep(0.0005)
    return total

@track()  # no line tracking
def baz():
    time.sleep(0.1)

@track()  # no line tracking
def foo():
    for _ in range(3):
        bar(50)
    baz()

foo()
stats()  # display the profiling statistics
output:
🤝 Feedback and Contributions
Contributions, suggestions, and feedback are welcome! Feel free to open issues or submit pull requests on GitHub.
Author
Arthur Fender C Bucker


Download files
Download the file for your platform. If you're not sure which to choose, learn more about installing packages.
Source Distribution
Built Distribution
Filter files by name, interpreter, ABI, and platform.
If you're not sure about the file name format, learn more about wheel file names.
Copy a direct link to the current filters
File details
Details for the file flexprofiler-0.1.4.tar.gz.
File metadata
- Download URL: flexprofiler-0.1.4.tar.gz
- Upload date:
- Size: 415.1 kB
- Tags: Source
- Uploaded using Trusted Publishing? No
- Uploaded via: twine/5.0.0 CPython/3.11.11
File hashes
| Algorithm | Hash digest | |
|---|---|---|
| SHA256 |
aa24f9df039377527b4657632e793567b02a49e6f0d6b0229446077f66fec9ab
|
|
| MD5 |
3c6601c93fcb22bed80113d4f006e085
|
|
| BLAKE2b-256 |
fcb4e71fbe4715542ff9cb87f7b102f3e8420457564cf3f7066c8c9549c678c5
|
File details
Details for the file flexprofiler-0.1.4-py3-none-any.whl.
File metadata
- Download URL: flexprofiler-0.1.4-py3-none-any.whl
- Upload date:
- Size: 12.8 kB
- Tags: Python 3
- Uploaded using Trusted Publishing? No
- Uploaded via: twine/5.0.0 CPython/3.11.11
File hashes
| Algorithm | Hash digest | |
|---|---|---|
| SHA256 |
2b10499f09d199100096d82b053c76c1805d2210475e249433b907b0290ea926
|
|
| MD5 |
0be9ebb92b423e0ede62e345e031bfe1
|
|
| BLAKE2b-256 |
1383aba5877ce39fa10901fe2c413407e1430d232db6127823ce6c6997b12367
|






