
This release is a pre-release and may not be stable for production use.

Interactive visualization at scale.
Python · Polars-native · stateless server · Rust-accelerated




[!WARNING] FlexViz is pre-1.0 and under active development. APIs, defaults, and the spec format may change between minor releases, and rough edges remain. Bug reports are very welcome.
FlexViz is a visualization library for exploring datasets that are far too big for conventional Python dashboarding tools. Charts stay interactive (zoom, brush, cross-filter) at 100M+ rows, because every interaction is answered by lazy Polars aggregations and Rust kernels instead of by shipping raw data to the browser.
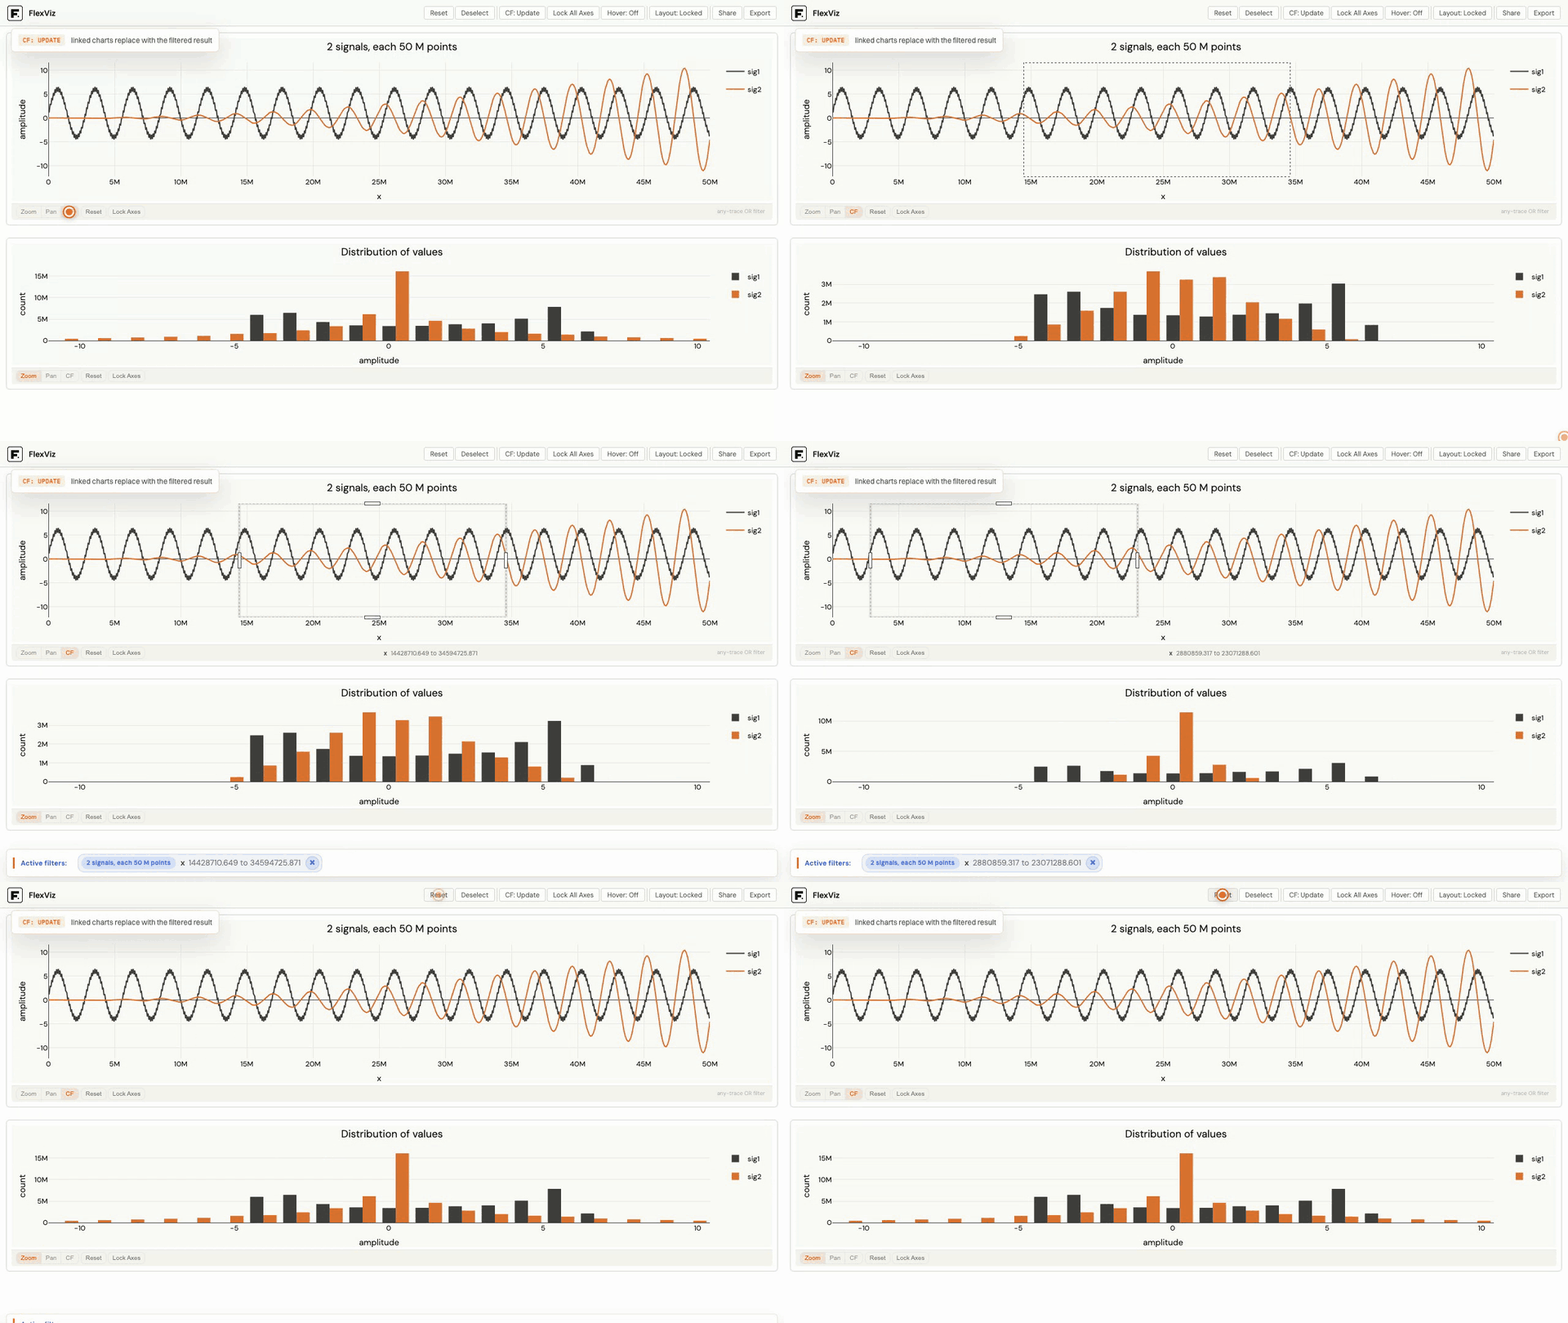
Brush one chart and every linked chart re-aggregates against the filtered set. Try it yourself on 100M rows in the live demo.
Why it's fast
- Polars-native. Data stays a lazy
LazyFrameuntil the last moment; in-memory frames and parquet-backed sources both work, and larger-than-RAM sources stream through Polars' streaming engine. - Rust kernels. Min/max line downsampling and fixed-bin histogram/heatmap
binning run as parallel Polars expression plugins
(
flexviz_polars), at memory-bandwidth speed. - Cube live-brushing. Dragging a brush is served client-side from a small pre-aggregated cube: zero server round-trips during the drag.
- Stateless server. The client owns all interaction state and every request carries the complete dashboard spec. No sessions, no server affinity, and shareable dashboard URLs fall out for free.
Features
- 10 trace types. Line, histogram, box, bar, pie, treemap, 2D histogram, correlation heatmap, geo 2D histogram, geo line.
- Native cross-filtering. Brush one figure to filter the others (update or overlay mode), with grouped traces and linked hover.
- Shareable URLs. Every view — viewport, selections, cross-filter mode, and layout — encodes into a single URL. Send the link and a teammate opens the exact live view; the server stores nothing.
- Drag-and-drop dashboard grid. Rearrange and resize panels in the browser and lock the layout when it's done; the arrangement also travels with the URL.
- Bring any DataFrame. Polars DataFrames/LazyFrames, pandas DataFrames, and PyArrow tables.
- Plotly.js rendering. The renderer sits behind a clean adapter boundary.
- Embeddable. Mounts into an existing FastAPI app via
mount_into().
Quickstart
import polars as pl
from flexviz import Dashboard

lf = pl.scan_parquet("readings.parquet")  # 100M rows, stays lazy

dash = Dashboard(lf)
dash.add_figure().add_line(x="timestamp", y="value")
dash.add_figure().add_histogram(x="value", bins=50)
dash.show()  # brush one chart to cross-filter the other
Install
pip install flexviz
The Rust kernels arrive as a prebuilt wheel (flexviz-polars) on Linux
(x86_64, aarch64), macOS (Intel and Apple silicon), and Windows (x64). Any
other platform builds them from source and needs a Rust toolchain.
From source:
git clone https://github.com/flex-analytics/flexviz
cd flexviz
uv sync              # installs deps and builds the Rust plugin
make test
The Rust plugin builds automatically; the toolchain is pinned in
rust-toolchain.toml.
Benchmarks
Time to render 1 billion points per chart: 5 traces × 200M rows from an in-memory frame, clocked browser-side from the request to painted pixels (median of 5 warm repeats). Each engine renders its own native chart: the line runs against Datashader and Mosaic, the histogram against Vaex and Mosaic, because neither of those tools has the other chart.

Peak backend memory stays at ~25 MB from 1M to 200M rows: FlexViz aggregates the caller's frame zero-copy. Interactive charts for the full matrix (1M–200M rows, 1/2/5 traces, in-memory and Parquet-backed) are at flexviz.tech/benchmarks; the harness, correctness gates, per-trial results, and caveats live in flexviz-benchmarks.
Status
Pre-1.0. The Python API and the spec wire format may change between minor versions; see the compatibility policy in the changelog. Architecture.md is the design source of truth.
License
Apache-2.0 © 2026 Flex Analytics BV
1 maintainer

Release files for flexviz 0.1.0b1
For a detailed explanation of source distributions (sdists) and built distributions (wheels), please see the package formats documentation.
Source distribution (sdist)
| File | Size | Uploaded | |
|---|---|---|---|
| flexviz-0.1.0b1.tar.gz | 514.8 kB | Details |
Built distribution (wheel)
| File | Interpreter | ABI | Platform | Reset |
|---|---|---|---|---|
| flexviz-0.1.0b1-py3-none-any.whl | Python 3 | none | any | Details |
Total release size: 783.2 kB
Release files / flexviz-0.1.0b1.tar.gz
| Download URL | flexviz-0.1.0b1.tar.gz |
|---|---|
| Size | 514.8 kB |
| Tags | Source |
|
SHA-256 checksum How to use checksums |
b04c959f1c6e78d3fd6ad12c16086e4d246ec9a26a2dfac05bc4dcf864193d5c
|
|
BLAKE2b-256 checksum How to use checksums |
e005541a51135d6593eadb8cbc64e575738f606474269b8df65969547227f840
|
| Upload date | |
|
Uploaded using Trusted Publishing? What is trusted publishing? |
Yes |
| Uploaded via |
twine/7.0.0 CPython/3.13.14
|
Provenance
Provenance describes where a file came from. On PyPI, provenance is shared via attestations, which provide a verifiable record of the build or publishing details. View details, limitations and caveats.


PyPI Publish Attestation
PyPI verified that this artifact, at this checksum, originated from the publisher listed below.
Signed by GitHub Actions, verified by PyPI on Aug 25, 2026.
Transparency logRelease files / flexviz-0.1.0b1-py3-none-any.whl
| Download URL | flexviz-0.1.0b1-py3-none-any.whl |
|---|---|
| Size | 268.4 kB |
| Tags | Python 3 |
|
SHA-256 checksum How to use checksums |
5e0777922398ef50ca3cf78cc2ac4ef2fdb6111c4f4a085c95e4920ecae43e32
|
|
BLAKE2b-256 checksum How to use checksums |
3049ea487e0326b8606aac3ec2cbbc34fbabf21ce9ba1438b7e9f4abedbd7ac8
|
| Upload date | |
|
Uploaded using Trusted Publishing? What is trusted publishing? |
Yes |
| Uploaded via |
twine/7.0.0 CPython/3.13.14
|
Provenance
Provenance describes where a file came from. On PyPI, provenance is shared via attestations, which provide a verifiable record of the build or publishing details. View details, limitations and caveats.
PyPI Publish Attestation
PyPI verified that this artifact, at this checksum, originated from the publisher listed below.
Signed by GitHub Actions, verified by PyPI on Aug 25, 2026.
Transparency log













