Execution graph debugger — see what your agent / pipeline actually does.

Project description
See what your agent actually does.
One decorator, one HTML file — a visual execution graph instead of logs.


from flow_xray import trace

@trace
def call_llm(prompt):
    return openai.chat(prompt)

@trace
def agent(query):
    plan = call_llm(f"plan: {query}")
    return call_llm(f"answer based on: {plan}")

result = trace.run(agent, "weather in Tokyo?")
result.to_html("trace.html")
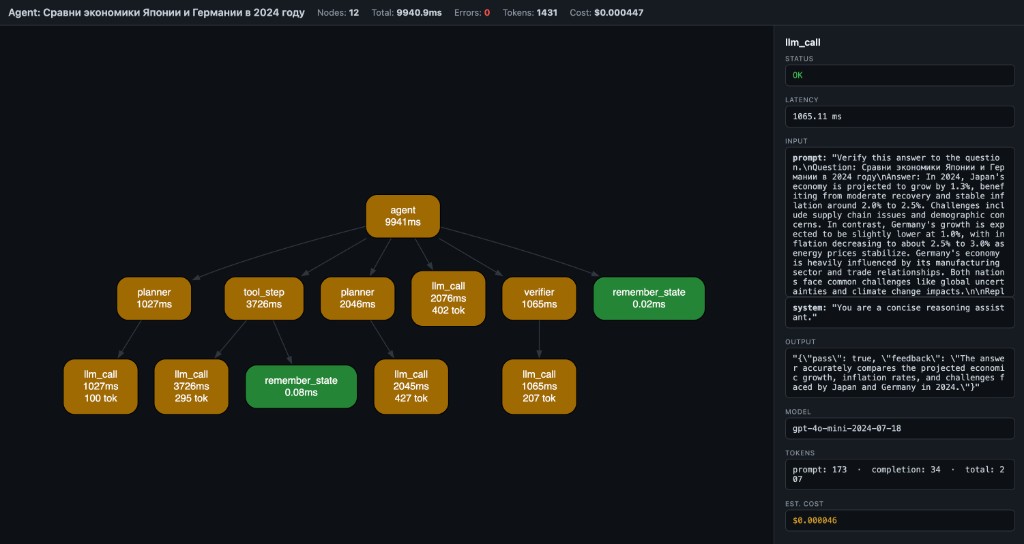
Open trace.html — you get a DAG of every traced step with inputs, outputs, latency, tokens, cost, and errors. Click a node to inspect. No server, no account, no log viewer — one local file.
Install
pip install flow-xray
30-second quickstart
Create demo_trace.py:
from flow_xray import trace

@trace
def fetch_profile(user_id):
    return {"id": user_id, "plan": "pro"}

@trace
def answer_question(user_id):
    profile = fetch_profile(user_id)
    return f"user {profile['id']} is on {profile['plan']}"

result = trace.run(answer_question, 42)
result.to_html("demo_trace.html")
Run it:
python demo_trace.py
Open demo_trace.html in your browser. You should see one root node (answer_question) and one child node (fetch_profile).
Usage
Decorator + trace.run
from flow_xray import trace

@trace
def step_a(x):
    return x + 1

@trace
def pipeline(x):
    return step_a(x) * 2

result = trace.run(pipeline, 5)
result.to_html("pipeline.html")
CLI
flow-xray run my_agent.py --html trace.html
The script must use @trace on the functions you want captured. The CLI provides the session and executes the file without entering if __name__ == "__main__" blocks, so put a traced demo call at module scope if you want flow-xray run to capture it directly.
Async support
@trace works with async def out of the box — no extra config:
from flow_xray import trace
import asyncio

@trace
async def call_api(query):
    await asyncio.sleep(0.1)  # simulate async I/O
    return {"answer": query}

@trace
async def agent(query):
    result = await call_api(query)
    return result["answer"]

result = trace.run(lambda: asyncio.run(agent("hello")))
result.to_html("async_trace.html")
Token / cost tracking
Token usage and estimated cost are auto-extracted from OpenAI response objects, or you can set them manually:
@trace
def call_llm(prompt):
    resp = openai.chat.completions.create(...)
    trace.meta(model=resp.model,
               prompt_tokens=resp.usage.prompt_tokens,
               completion_tokens=resp.usage.completion_tokens)
    return resp.choices[0].message.content
Redaction and share-safe traces
Use decorator options when a trace may contain secrets or bulky payloads:
from flow_xray import trace

@trace(redact={"api_key", "authorization"}, capture_output=False)
def call_service(api_key, payload):
    ...
redact={...}masks matching argument names and nested dict keys as[redacted]capture_output=Falsekeeps the real return value in Python, but stores[redacted]in the HTML trace
Safety note
flow-xray serializes function inputs, outputs, errors, and attached metadata into the generated HTML file. Treat trace files as local debugging artifacts: avoid tracing secrets or redact sensitive payloads before sharing the HTML with others.
What you see
- Nodes = function calls (name + latency + tokens)
- Edges = caller → callee
- Green = OK, Red = error, Yellow = slow (>1s)
- Header = total nodes, latency, tokens, estimated cost
- Click a node → side panel shows inputs, output, error, timing, model, tokens, cost
Why this exists
Langfuse, Helicone, LangSmith — they give you timelines and logs.
But when your agent pipeline branches, retries, or chains 6 tools — you don't need another table. You need a graph.
flow-xray is not an agent framework. It's the layer below them — like Chrome DevTools is to browsers.
Compatibility
- Python 3.10, 3.11, 3.12, 3.13, 3.14 — tested
- Sync and async functions — both supported
- Any Python code — not limited to LLM calls; works with any function you decorate
- Frameworks — works alongside LangGraph, CrewAI, OpenAI SDK, or plain Python
How it works
@trace wraps functions (sync and async). When called inside a trace.run() session (or flow-xray run CLI), it records:
- function name
- bound arguments
- return value or exception
- wall-clock latency
- token usage and estimated cost (auto or manual)
- parent/child relationships (call stack → DAG)
result.to_html() embeds the trace as JSON in a self-contained HTML page that renders via WASM Graphviz (CDN, works offline after first load).
The trace viewer also includes search, zoom/reset controls, and copy-details for the currently selected node.
Also included
Scalar autodiff core (micrograd-style Value graph with DOT/JSON export and stepping debugger) lives under flow-xray dot CLI and from flow_xray import Value. See examples/ and plan.md.
License
MIT


Download files
Download the file for your platform. If you're not sure which to choose, learn more about installing packages.
Source Distribution
Built Distribution
Filter files by name, interpreter, ABI, and platform.
If you're not sure about the file name format, learn more about wheel file names.
Copy a direct link to the current filters
File details
Details for the file flow_xray-0.3.0.tar.gz.
File metadata
- Download URL: flow_xray-0.3.0.tar.gz
- Upload date:
- Size: 22.7 kB
- Tags: Source
- Uploaded using Trusted Publishing? No
- Uploaded via: twine/6.2.0 CPython/3.14.4
File hashes
| Algorithm | Hash digest | |
|---|---|---|
| SHA256 |
8023eb283025a14566b11d8af7ece46329017bc3760d9b91edb6b5986f257aae
|
|
| MD5 |
baaca2083875e1149b97a1e56fdc42d0
|
|
| BLAKE2b-256 |
e9b11f1bdc48ef75eb5c2faa02cfd41d0fcf7715eaa67a9868e5d5b96954e9e7
|
File details
Details for the file flow_xray-0.3.0-py3-none-any.whl.
File metadata
- Download URL: flow_xray-0.3.0-py3-none-any.whl
- Upload date:
- Size: 27.0 kB
- Tags: Python 3
- Uploaded using Trusted Publishing? No
- Uploaded via: twine/6.2.0 CPython/3.14.4
File hashes
| Algorithm | Hash digest | |
|---|---|---|
| SHA256 |
49953390fc66699c211757d20ad6489c9afc7f335783a963bbe62c7b441e33fe
|
|
| MD5 |
df011b54b7350cd543fc84cd2538a844
|
|
| BLAKE2b-256 |
5aeca0f2c9b202a82ef2feb1d55c12bb7b28fecddf5cd423ded7bdfccc893644
|


