
Unix terminal plotter for foamLog-generated numeric files

Project description
foamplot




Plot OpenFOAM-style residual/log files as line charts in the terminal. Useful for monitoring solver output on servers.
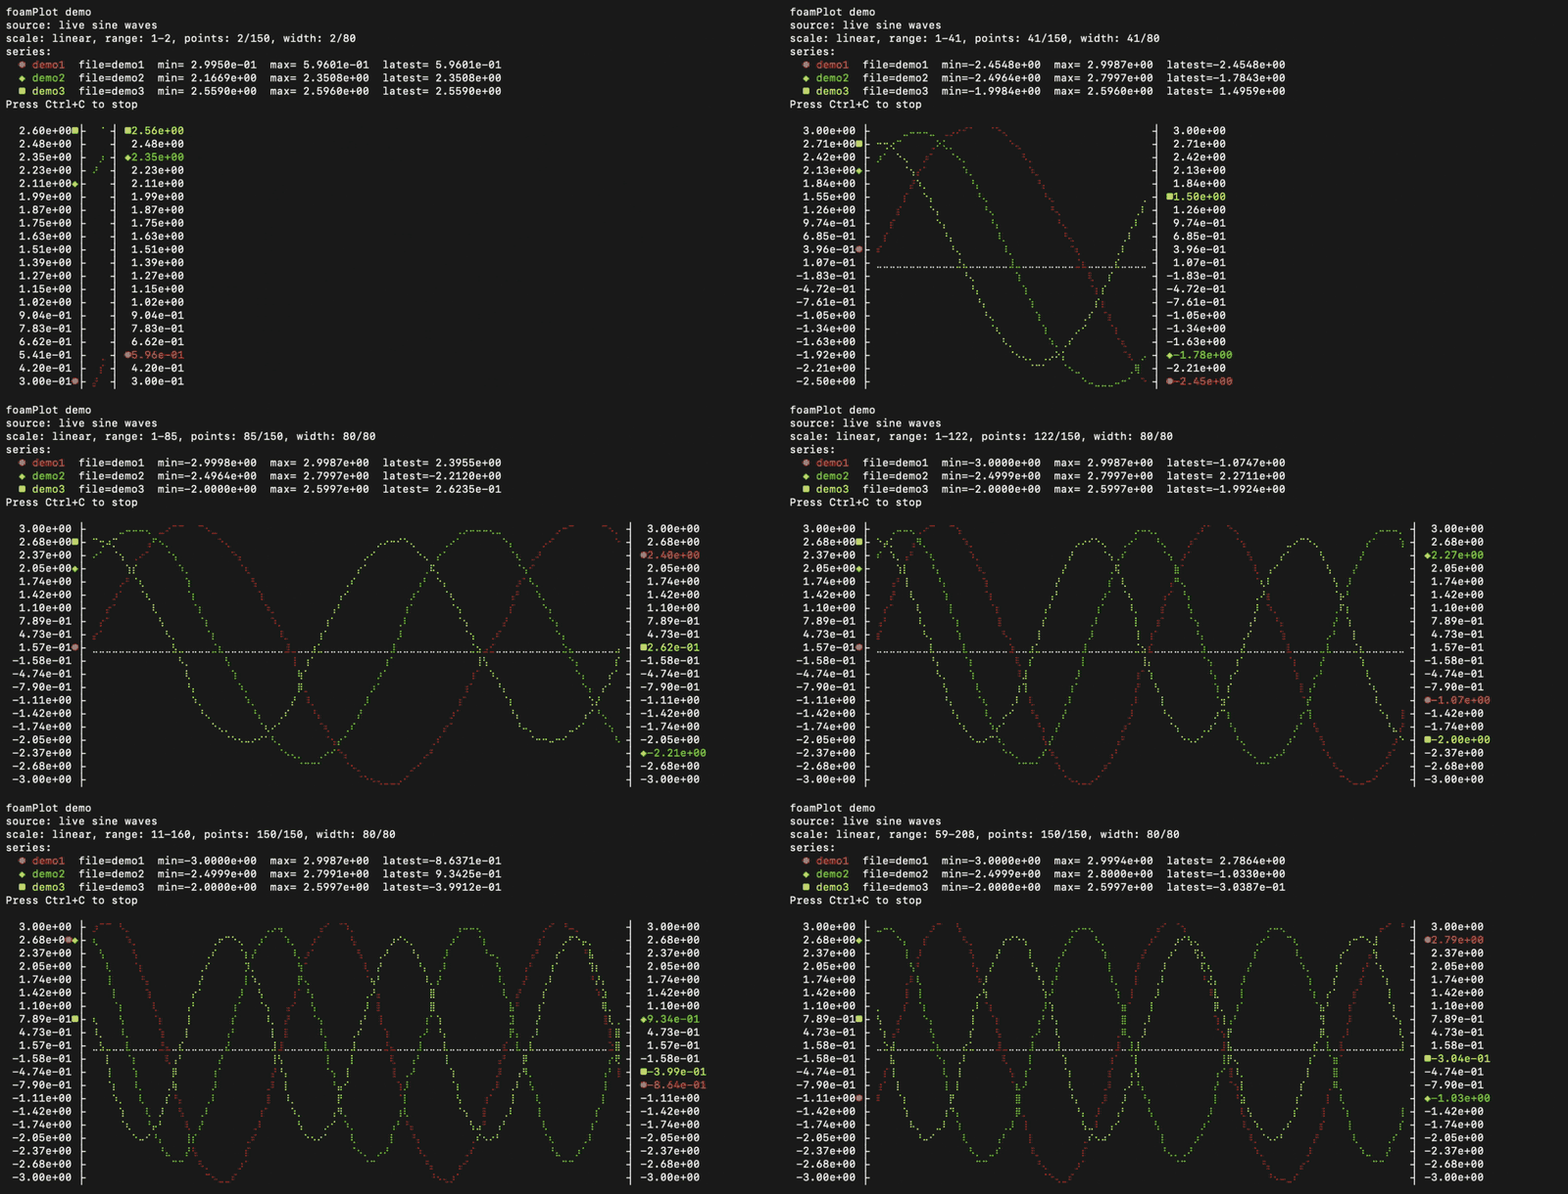
foamplot reads numeric values from one or more files and draws a live terminal plot using Unicode/Braille characters. It is useful for watching residuals, objective values, forces, coefficients, or any scalar log that grows line by line.
Built on top of plotille.
Inspired by asciichartpy.
Install
pip install foamplot
or, as an isolated CLI app:
pipx install foamplot
Demo
foamplot --demo -i 0.1 -W 80
Plot OpenFOAM Residuals
foamplot works directly with residual files generated by foamLog.
Static plot
Run an OpenFOAM case and write the solver output to a log file:
# at your working directory
cp -r "$FOAM_TUTORIALS/incompressible/icoFoam/cavity/cavity" .
cd cavity

blockMesh | tee log.blockMesh
icoFoam | tee log.icoFoam
Run foamLog to extract residuals into logs/:
foamLog log.icoFoam
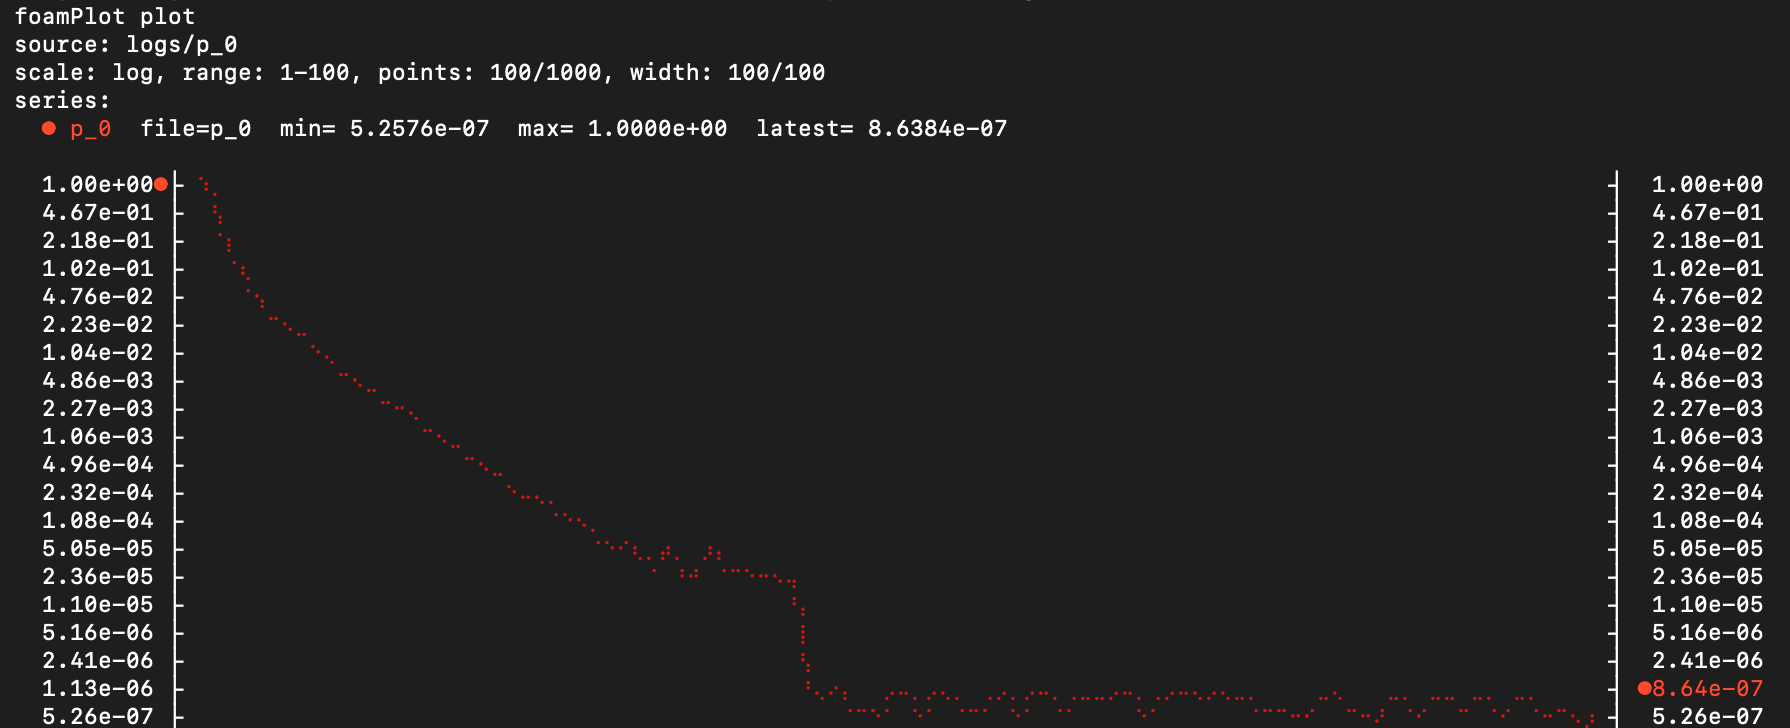
Plot any generated file in logs/:
foamplot logs/p_0
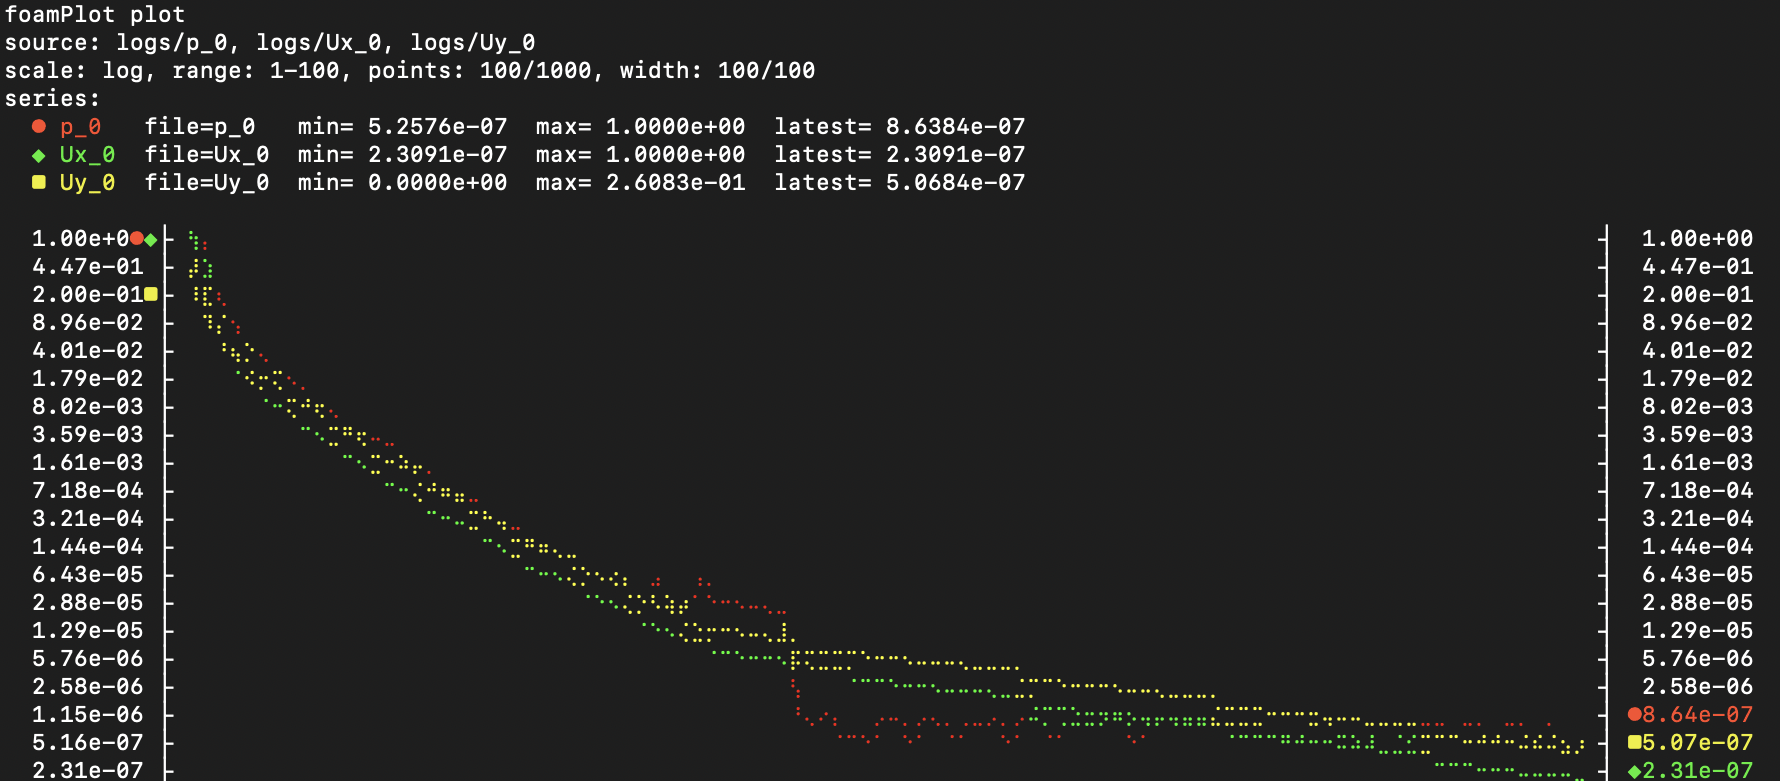
You can also plot multiple files, up to 5 series:
foamplot logs/p_0 logs/Ux_0 logs/Uy_0
Monitor residuals live
Run an OpenFOAM case and write the solver output to a log file. For example, using the official motorBike tutorial:
# at your working directory
cp -r "$FOAM_TUTORIALS/incompressible/simpleFoam/motorBike" .
cd motorBike

./Allrun
Update the residual files live in another terminal:
watch -n 0.2 foamLog log.simpleFoam
Follow the generated residual file:
foamplot logs/p_0 --follow
Two options control the horizontal view:
foamplot logs/p_0 --follow -W 120 -p 200
| Option | Meaning |
|---|---|
-W, --plot-width |
Plot width in terminal columns. |
-p, --points |
Maximum number of latest points to keep. |
Behaviour:
- If points
< plot-width, the curve grows to the right. - If
plot-width < points < max points, the curve is compressed into the plot width. - If points
> max points, only the latest points are shown and the plot scrolls.
In follow mode, the plot refreshes in place. Press Ctrl+C to stop.
Other useful examples
Name the series:
foamplot logs/p_0 logs/Ux_0 logs/Uy_0 --names p,Ux,Uy
Because foamplot is mainly intended for residual histories, the default scale is log10. In log mode, only positive values are plotted.
For zero or negative values, use a linear scale:
foamplot logs/p_0 --scale linear
Customize the plot size:
foamplot logs/p_0 --plot-width 160 --height 30
Show only the latest 200 values:
foamplot logs/p_0 --points 200
Refresh every second in follow mode:
foamplot logs/p_0 --follow --interval 1
Plot Other Data Files
foamplot can also plot simple numeric text files.
For example:
1	1
2	0.270842
3	0.134221
4	0.0782715
5	0.0602821
6	0.0495971
7	0.0428131
8	0.0384169
9	0.0360277
10	0.0341129
By default, foamplot uses the last numeric token on each line. For the file above, it plots the second column.
foamplot data.txt
To select a specific numeric token, use --column. The index is zero-based:
foamplot data.txt --column 1
Options
usage: foamplot [-h] [-p POINTS] [-W PLOT_WIDTH] [-H HEIGHT]
                [-i INTERVAL] [-c COLUMN] [--names NAMES]
                [-f] [--demo] [--demo-points DEMO_POINTS]
                [--demo-lines DEMO_LINES] [--phase-step PHASE_STEP]
                [--scale {log,linear}]
                [files ...]
positional arguments:
  files                 foamLog-generated file(s); each file becomes one line

optional arguments:
  -h, --help            show this help message and exit
  -p POINTS, --points POINTS
                        latest lines to read from each file
  -W PLOT_WIDTH, --plot-width PLOT_WIDTH
                        maximum plot width in terminal columns
  -H HEIGHT, --height HEIGHT
                        chart height
  -i INTERVAL, --interval INTERVAL
                        refresh interval in seconds
  -c COLUMN, --column COLUMN
                        zero-based numeric token; default: last number
  --names NAMES         comma-separated series names, e.g. pa,p,ux
  -f, --follow          keep refreshing the file(s)
  --demo                run demo instead of reading files
  --demo-kind {sine,cfd}
                        demo data type
  --demo-points DEMO_POINTS
                        maximum retained demo points before the live window
                        starts scrolling
  --demo-lines DEMO_LINES
                        number of demo lines, 1 to 5
  --scale {log,linear}  plot scale for file mode
Notes
- Requires Python 3.6+.
- Intended for Linux/macOS terminals.
- Uses
tail -ninternally. - Requires a Unicode-capable terminal.
- In log mode, only positive values are plotted.
- Use
--scale linearfor values that may be zero or negative. foamplot --followredraws the files you pass to it. It does not runfoamLogautomatically.
License
MIT
Release history Release notifications | RSS feed


Download files
Download the file for your platform. If you're not sure which to choose, learn more about installing packages.
Source Distribution
Built Distribution
Filter files by name, interpreter, ABI, and platform.
If you're not sure about the file name format, learn more about wheel file names.
Copy a direct link to the current filters
File details
Details for the file foamplot-1.0.1.tar.gz.
File metadata
- Download URL: foamplot-1.0.1.tar.gz
- Upload date:
- Size: 2.8 MB
- Tags: Source
- Uploaded using Trusted Publishing? No
- Uploaded via: twine/6.2.0 CPython/3.11.13
File hashes
| Algorithm | Hash digest | |
|---|---|---|
| SHA256 |
c5239a538ed12907868a41a04904437dcdfbf6c38b7e4e2d08f156ec179a8ec6
|
|
| MD5 |
19974905cc7ebdd2ef7ccc195875c3a4
|
|
| BLAKE2b-256 |
626b65093e749e03dd0f70af7dc1e22c1e18a57e36637b2a86ebd6b0ef04a3a5
|
File details
Details for the file foamplot-1.0.1-py3-none-any.whl.
File metadata
- Download URL: foamplot-1.0.1-py3-none-any.whl
- Upload date:
- Size: 17.6 kB
- Tags: Python 3
- Uploaded using Trusted Publishing? No
- Uploaded via: twine/6.2.0 CPython/3.11.13
File hashes
| Algorithm | Hash digest | |
|---|---|---|
| SHA256 |
7b67fa5771631aec286752a3dba23ba4a67410baedc29c1455801097391cafb8
|
|
| MD5 |
12248315b4b1160285309386b9b326e1
|
|
| BLAKE2b-256 |
0a73d32dd503cd994d5fe9292163f9c4fdce4bc959e2a4a91b39c083323d2a5b
|






