
This release is a pre-release and may not be stable for production use.
forestploter for Python





forestploter is a Python package for publication-ready, table-style forest
plots from auditable XLSX or CSV long tables. It validates the input contract,
keeps text and confidence intervals on shared row geometry, and renders static
PNG or SVG output with Matplotlib. It deliberately does not calculate effect
sizes, confidence intervals, or meta-analysis statistics.
Project identity: this is an independent Python package, not the
forestploterR package. It is not affiliated with, endorsed by, or maintained by the authors or maintainers of that R package.
Showcase
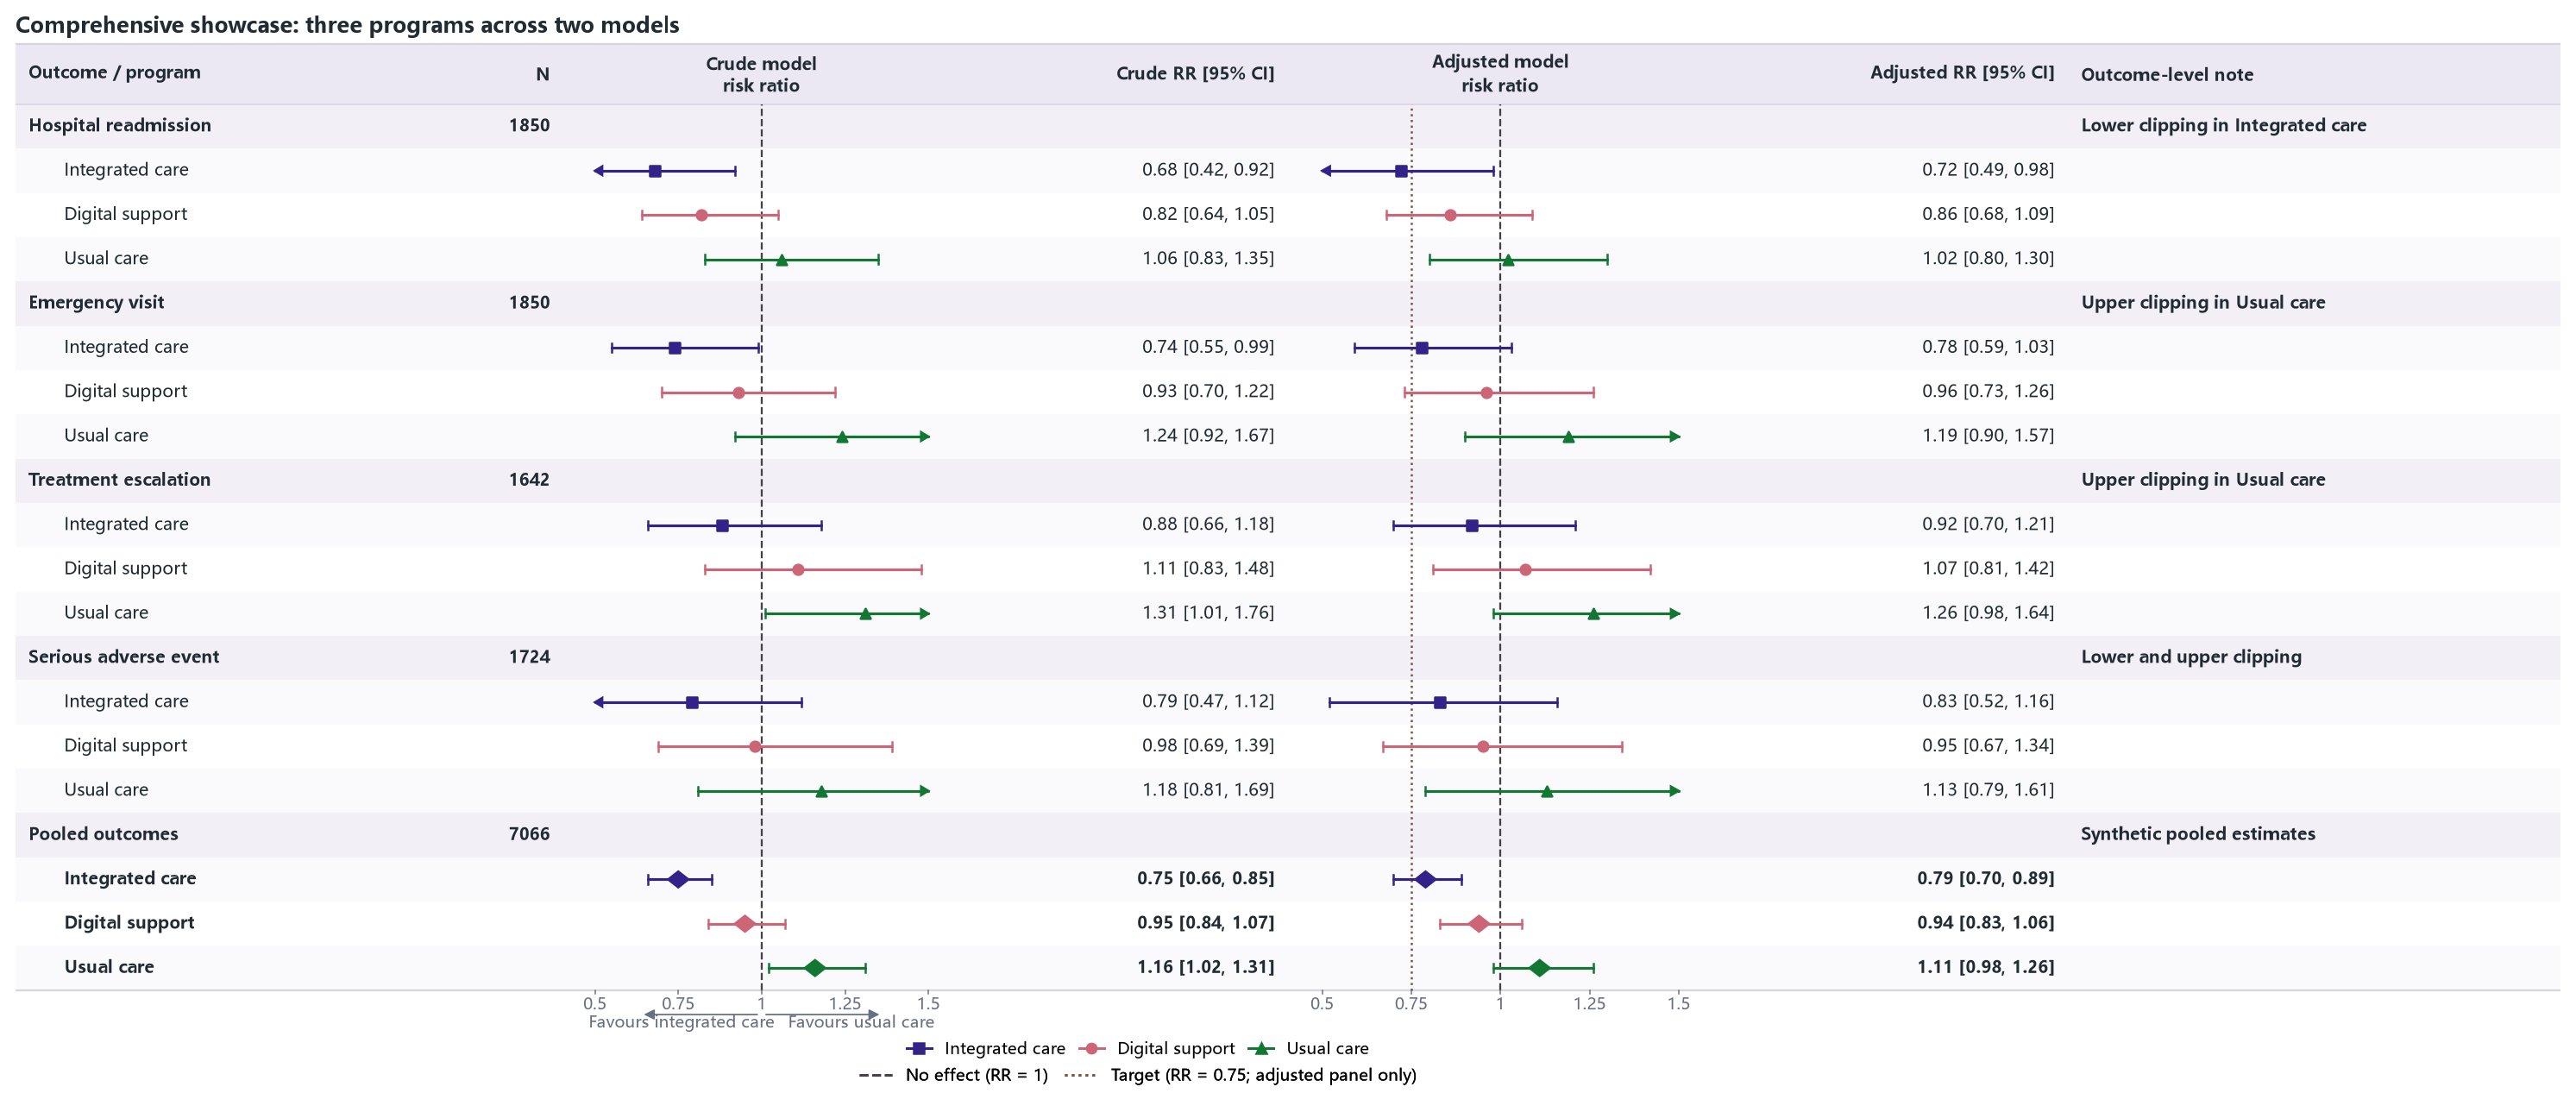
Three series remain row-aligned across crude and adjusted CI panels and their matching text columns in a compact layout. CI text contains values only; a high-contrast indigo, rose, and green palette, distinct marker shapes, the legend, and indented child labels identify each series. Shared outcome data appear once on group-header rows rather than in merged cells. The example also combines lower- and upper-bound clipping, no-effect lines in both panels plus an additional target line in the adjusted panel only, direction labels, summary diamonds, and bottom legends. Synthetic demonstration data. View the exact code and download the XLSX or CSV input.
Highlights
- Read one auditable long-table contract from XLSX or CSV, or pass a compatible
pandas.DataFramedirectly. - Express conventional hierarchy with group-header rows and indented children, keeping shared values on the header row.
- Preserve supported vertical XLSX merges when a specialized centered multirow display is needed.
- Align single or multiple series across one or more CI columns with explicit
_plot_row,_series, and_ci_columnfields. - Place ordinary text or numeric columns before, between, or after CI plotting
columns; the
columnssequence controls the final left-to-right order. - Render summary diamonds, clipped-interval arrows, shared reference lines, additional target lines restricted to selected CI columns, series styles, configurable themes, and legends in a header or below the figure.
- Use automatic sizing and layout diagnostics to make dense tables, long text, Unicode labels, and PNG/SVG export easier to review.
Installation
The current release is a public preview, so install the release candidate explicitly:
python -m pip install --pre forestploter
Python 3.10 or later is required.
Quick start
Download the runnable case 01 workbook, then run:
from forestploter import ForestColumn, forest, read_forest_data

df = read_forest_data("01_single_series.xlsx", sheet_name="Forest")
result = forest(
    df,
    columns=[
        ForestColumn("label", "Outcome / study", "text", 2.8),
        ForestColumn("n", "N", "numeric", 0.7, "right"),
        ForestColumn("ci", "Treatment effect", "ci", 3.3, "center"),
        ForestColumn(
            "effect_display",
            "Mean difference [95% CI]",
            "numeric",
            2.0,
            "right",
        ),
    ],
    xlim=(-1.0, 1.0),
    ticks_at=(-1.0, -0.5, 0.0, 0.5, 1.0),
    ref_line=0.0,
)
result.save("forest.png", dpi=300)
The columns sequence alone controls the rendered left-to-right order, so
ordinary display columns can appear before or after any CI plotting column
regardless of the physical XLSX/CSV header order.
Input model at a glance
read_forest_data() returns ForestData: normalized values are available in
df.frame, and supported XLSX merge ranges are retained in df.spans. CSV
uses the same logical fields but has no merge metadata.
One source record describes one series in one target CI column with one shared
estimate/lower/upper triple. _plot_row explicitly selects the visual row.
To show one series in several CI columns, duplicate the record, keep the same
_plot_row, and change _ci_column.
See the complete data contract and the XLSX workbook template.
Documentation and examples
- English and Chinese documentation
- Getting started
- Example gallery
- API reference
- Thirteen XLSX/CSV/PNG regression examples
Current scope and status
The 0.1 series is a quality-first public preview. Python 3.10 through 3.14
are covered by CI, with additional Windows and macOS smoke tests. Public APIs
may still evolve with documented deprecations before 1.0.
All CI columns currently share one global linear axis configuration. Independent per-column axes and logarithmic scales are planned; see the roadmap.
Support, contribution, and citation
Acknowledgments and development transparency
The table-oriented forest-plot workflow in this project was inspired by the R
package forestploter, created by
Alimu Dayimu. This repository is a separate implementation for the Python
ecosystem, with its own API and data contract. It is not an official Python
port and is not affiliated with, endorsed by, or maintained by the authors or
maintainers of the R package.
The implementation, tests, documentation, release engineering, and maintenance workflow of this project include substantial AI-assisted contributions from OpenAI Codex. All changes and releases are directed, reviewed, and approved by Xuxu Wei, the package author and maintainer. OpenAI is not a project maintainer or sponsor.
License
MIT © 2026 Xuxu Wei. See the license.
1 maintainer

Metadata
1 maintainer
Release files for forestploter 0.1.0rc1
For a detailed explanation of source distributions (sdists) and built distributions (wheels), please see the package formats documentation.
Source distribution (sdist)
| File | Size | Uploaded | |
|---|---|---|---|
| forestploter-0.1.0rc1.tar.gz | 2.0 MB | Details |
Built distribution (wheel)
| File | Interpreter | ABI | Platform | Reset |
|---|---|---|---|---|
| forestploter-0.1.0rc1-py3-none-any.whl | Python 3 | none | any | Details |
Total release size: 2.0 MB
Release files / forestploter-0.1.0rc1.tar.gz
| Download URL | forestploter-0.1.0rc1.tar.gz |
|---|---|
| Size | 2.0 MB |
| Tags | Source |
|
SHA-256 checksum How to use checksums |
d98899ab919c3f5c2e294ac318739e1234bab7613c8ab9a034bf5e551c616b56
|
|
BLAKE2b-256 checksum How to use checksums |
fa8429d3fe3954ec8c4173b24f02a23aa2e3194cae85e207503a7920c3794f89
|
| Upload date | |
|
Uploaded using Trusted Publishing? What is trusted publishing? |
Yes |
| Uploaded via |
twine/7.0.0 CPython/3.13.14
|
Provenance
Provenance describes where a file came from. On PyPI, provenance is shared via attestations, which provide a verifiable record of the build or publishing details. View details, limitations and caveats.


PyPI Publish Attestation
PyPI verified that this artifact, at this checksum, originated from the publisher listed below.
Signed by GitHub Actions, verified by PyPI on Aug 28, 2026.
Transparency logRelease files / forestploter-0.1.0rc1-py3-none-any.whl
| Download URL | forestploter-0.1.0rc1-py3-none-any.whl |
|---|---|
| Size | 37.4 kB |
| Tags | Python 3 |
|
SHA-256 checksum How to use checksums |
4af9c281f3e961c45ef0413bb7563da514287fbc43630a00daa9b976d6c9df95
|
|
BLAKE2b-256 checksum How to use checksums |
923efaa91f0acd4a962e1e8a92b3918f7aec3e89ba03547d43ab085e818d9a35
|
| Upload date | |
|
Uploaded using Trusted Publishing? What is trusted publishing? |
Yes |
| Uploaded via |
twine/7.0.0 CPython/3.13.14
|
Provenance
Provenance describes where a file came from. On PyPI, provenance is shared via attestations, which provide a verifiable record of the build or publishing details. View details, limitations and caveats.
PyPI Publish Attestation
PyPI verified that this artifact, at this checksum, originated from the publisher listed below.
Signed by GitHub Actions, verified by PyPI on Aug 28, 2026.
Transparency log












